Your first survival curve!
Survival Analysis in Python

Shae Wang
Senior Data Scientist
The survival function
- $T$: when the event of interest occurs
- $t$: any point in time during an observation
$$\Large{S(t) = Pr(T>t)}$$
- $S(t)$: models the probability that the event of interest happens after $t$
- $Pr(T>t)$: the survival probability
The survival curve
$$\Large{S(t) = Pr(T>t)}$$
The survival curve
$$\Large{S(t) = Pr(T>t)}$$
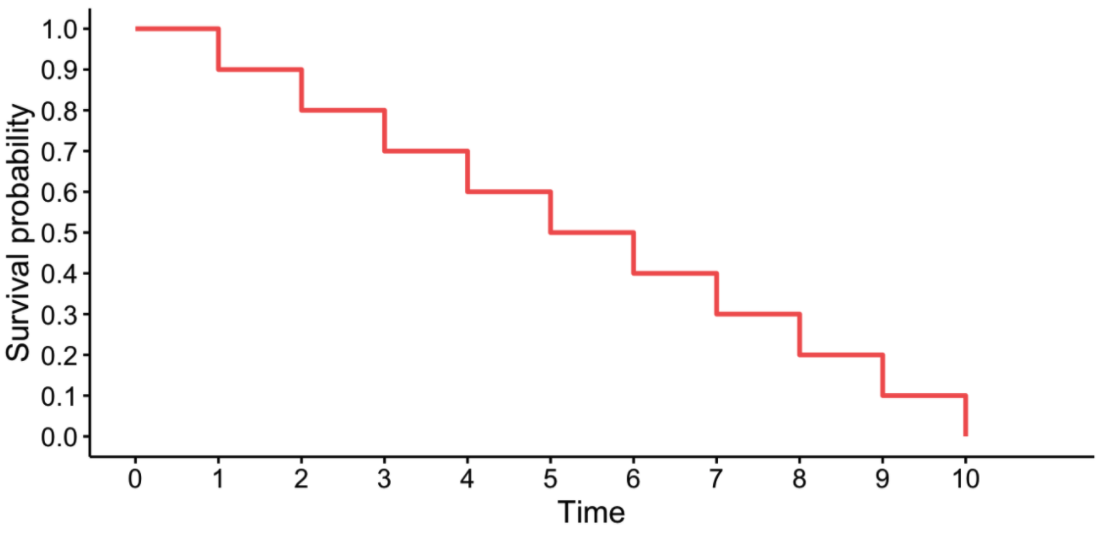
The survival curve
$$\Large{S(t) = Pr(T>t)}$$
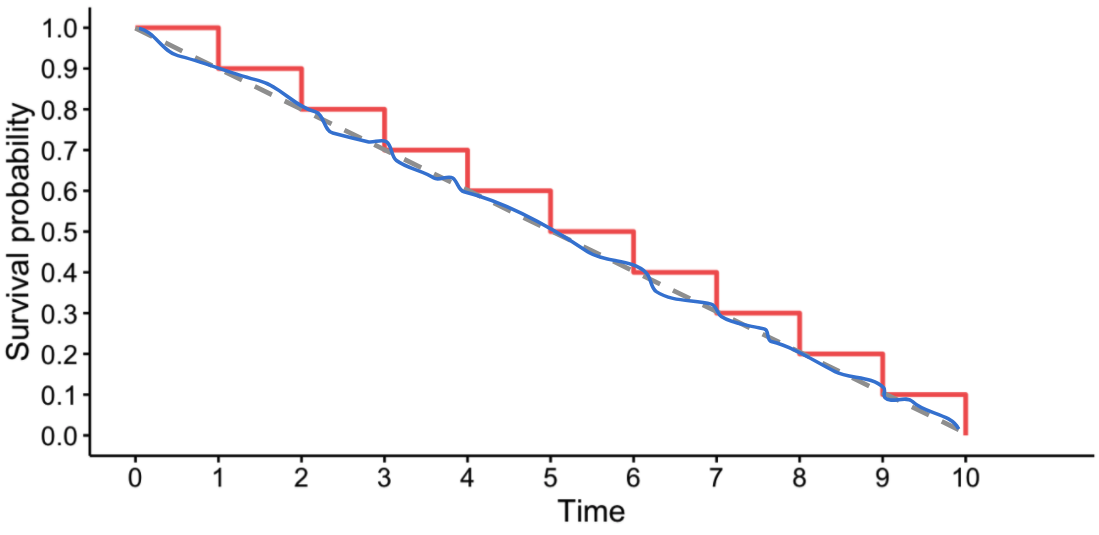
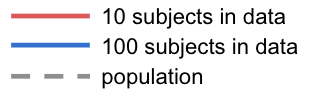
Interpreting a survival curve
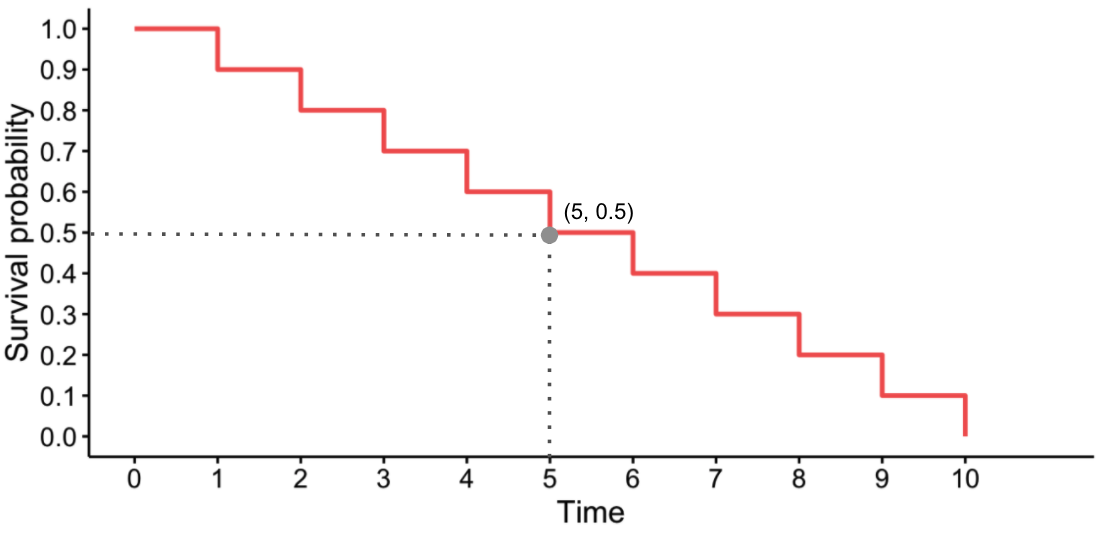
- Point$(a,b)$: the probability that an individual survives longer than $a$ is $b$

Interpreting a survival curve
- Point$(a,b)$: the probability that an individual survives longer than $a$ is $b$
- Flatter curve: lower rate of event occurrence
- Steeper curve: higher rate of event occurrence
Non-parametric versus parametric models
Non-parametric modeling
- Make no assumptions about the shape of the data
Parametric modeling
- Make some assumptions about the shape of the data
- Described with a limited set of parameters
- i.e. the survival curve may be assumed to follow an exponential distribution
Non-parametric versus parametric models
Non-parametric modeling
- Survival curve is usually NOT smooth

Parametric modeling
- Survival curve is usually smooth
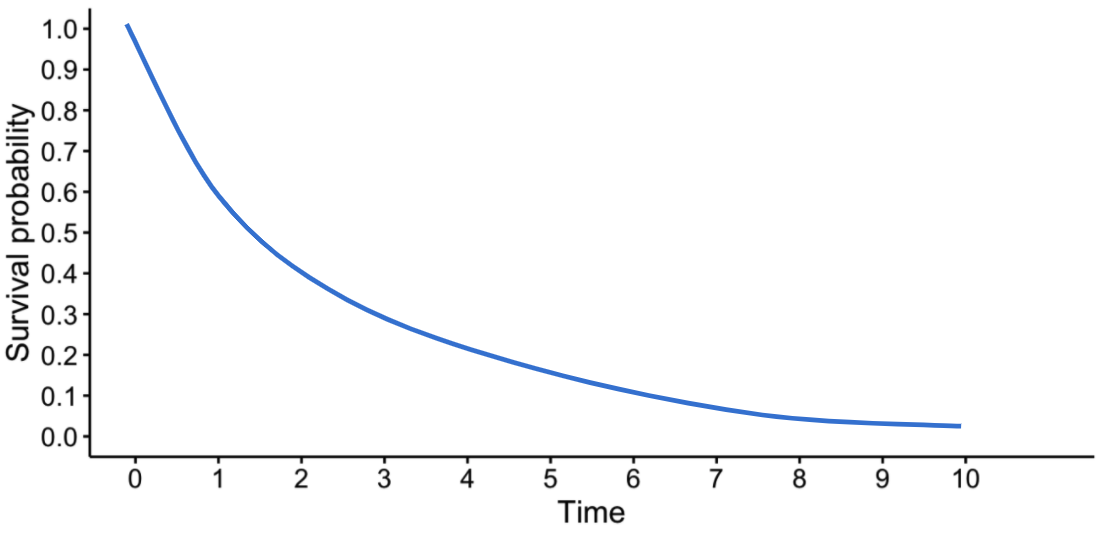
- Relies on the parametric model actually being a good description of the data
Drawing a survival curve
The lifelines package is a complete survival analysis library.
- Fit survival functions to data
- Plot survival curves based on the fitted survival functions
import lifelines
import matplotlib.pyplot as plt
.fit(durations, event_observed)
.plot_survival_function()
Survival curve example
DataFrame name: mortgage_df
| id | duration | paid_off |
|---|---|---|
| 1 | 25 | 0 |
| 2 | 17 | 1 |
| 3 | 5 | 0 |
| ... | ... | ... |
| 100 | 30 | 1 |
id: the id of a mortgage loanduration: the number of years the mortgage is not paid offpaid_off:1if the mortgage is fully paid off,0if not fully paid off
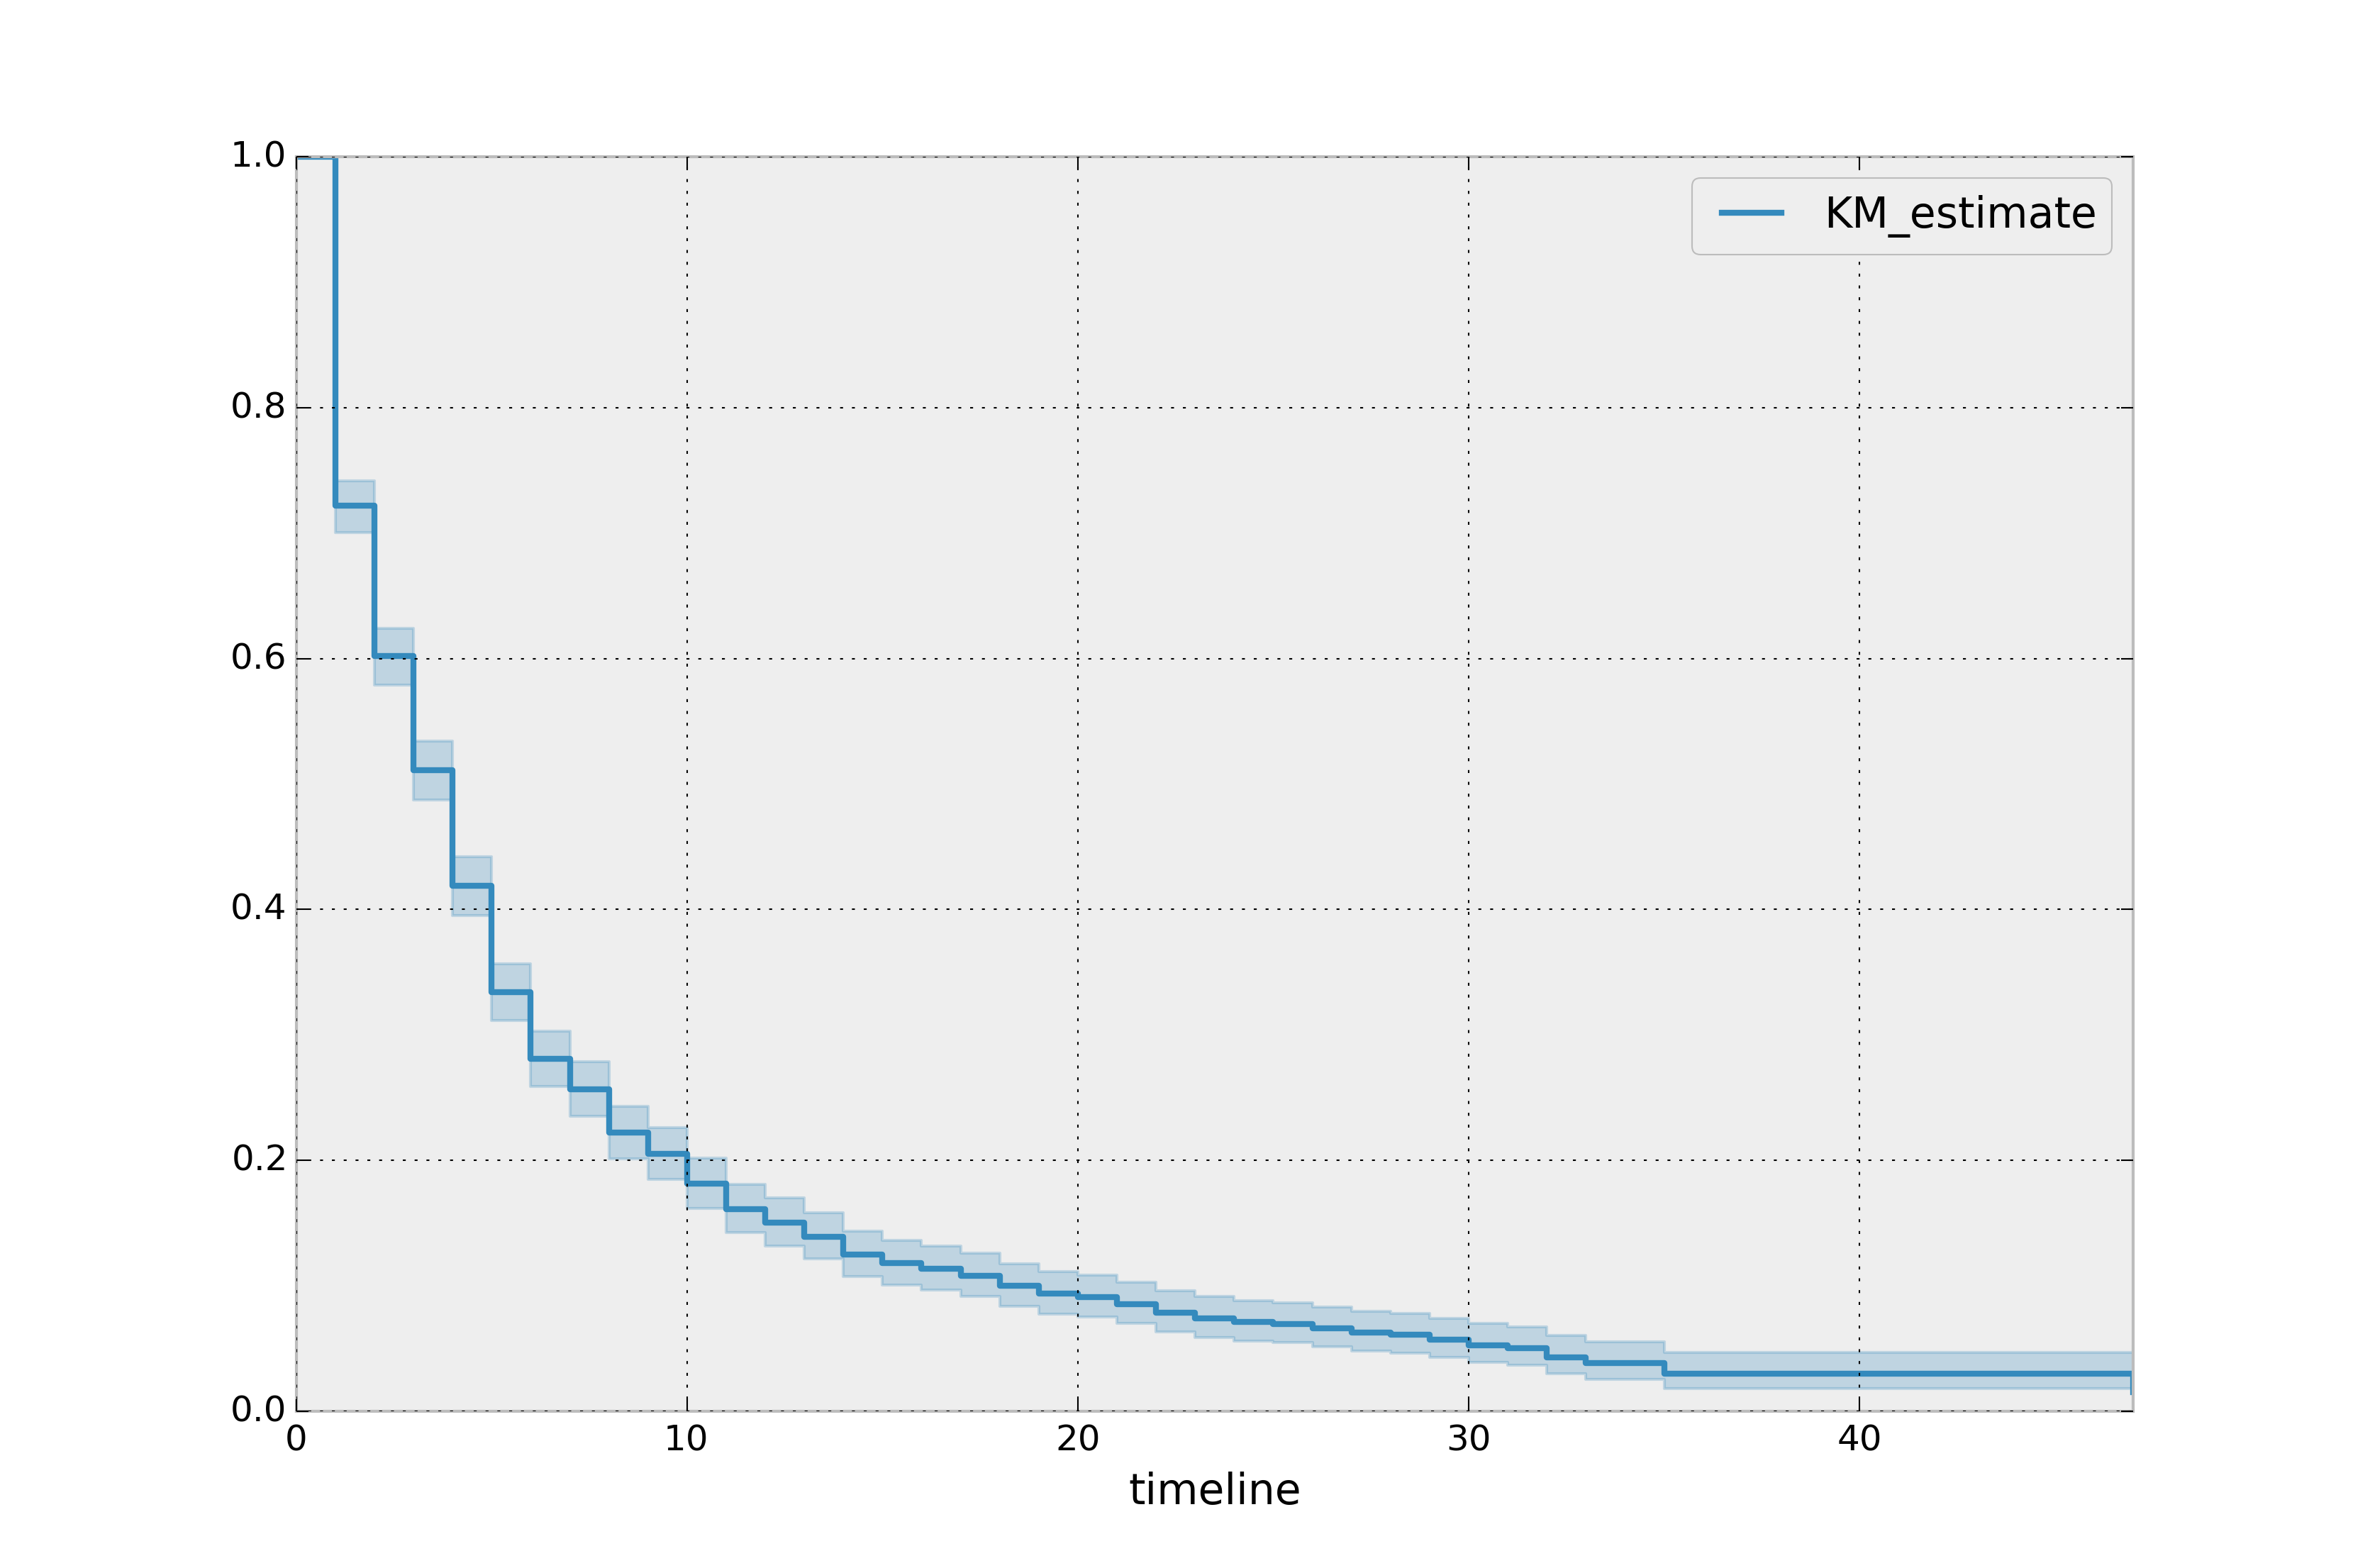
Survival curve example
import lifelines
from matplotlib import pyplot as plt
kmf = lifelines.KaplanMeierFitter()
kmf.fit(duration=mortgage_df["duration"],
        event_observed=mortgage_df["paid_off"])
kmf.plot_survival_function()
plt.show()
Let's practice!
Survival Analysis in Python

