Applying survival analysis to groups
Survival Analysis in Python

Shae Wang
Senior Data Scientist
The mortgage problem
DataFrame name: mortgage_df
| id | property type | duration | paid_off |
|---|---|---|---|
| 1 | house | 25 | 0 |
| 2 | apartment | 17 | 1 |
| 3 | apartment | 5 | 0 |
| ... | ... | ... | ... |
| 100 | house | 30 | 1 |
Property type: the type of home that's financed by the mortgage (either house or apartment)
Is there a difference in time to payoff for house versus apartment mortgages?
Comparing groups' survival distributions
We are often interested in assessing whether there are differences in survival (or event/survival probabilities) among different groups of subjects.
- Dimensional attributes about the subjects
- i.e. different types of mortgages, different brands of tires
- Different experiment groups
- i.e. treatment versus control groups
- Different values for the same dimensional attribute
- i.e. high versus low income households
Types of survival group comparisons
1. Are any point estimates or survival statistics different?
- Compare two groups' survival probabilities at a specific time
- Compare total proportion of survived subjects across two groups
Types of survival group comparisons
2. Are the underlying distributions different?
- Requires formal hypothesis testing
Types of survival group comparisons
3. How much does an attribute affect survival?
- Requires regression-based modeling frameworks
Visualizing group differences
Fitting a Kaplan-Meier survival function to each group and visualize their survival curves side-by-side.
Benefits:
- Simple and straight-forward to use and interpret.
- Non-parametric means it is more flexible for different types of survival distributions.
- Useful illustrative tool for demonstrating differences in survival functions.
Identifying the groups
DataFrame name: mortgage_df
| id | property type | duration | paid_off |
|---|---|---|---|
| 1 | house | 25 | 0 |
| 2 | apartment | 17 | 1 |
| 3 | apartment | 5 | 0 |
| ... | ... | ... | ... |
| 100 | house | 30 | 1 |
Create a Boolean mask for each group.
house = (mortgage_df["property_type"]=="house")
apt = (mortgage_df["property_type"]=="apartment")
If there are only 2 groups, only 1 mask is necessary. The other group could be referenced using negation.
Fitting and plotting survival curves
Create one figure and instantiate a KaplanMeierFitter class.
ax = plt.subplot(111)
mortgage_kmf = KaplanMeierFitter()
Fit mortgage_kmf to the house group and plot on the figure ax.
mortgage_kmf.fit(duration=mortgage_df[house]["duration"],
                 event_observed=mortgage_df[house]["paid_off"],
                 label="Houses")
mortgage_kmf.plot_survival_function(ax=ax)
Fitting and plotting survival curves
Fit mortgage_kmf to the apartment group and plot on the figure ax.
mortgage_kmf.fit(duration=mortgage_df[apt]["duration"],
                 event_observed=mortgage_df[apt]["paid_off"],
                 label="Apartments")
mortgage_kmf.plot_survival_function(ax=ax)
Visualizing side-by-side
plt.show()
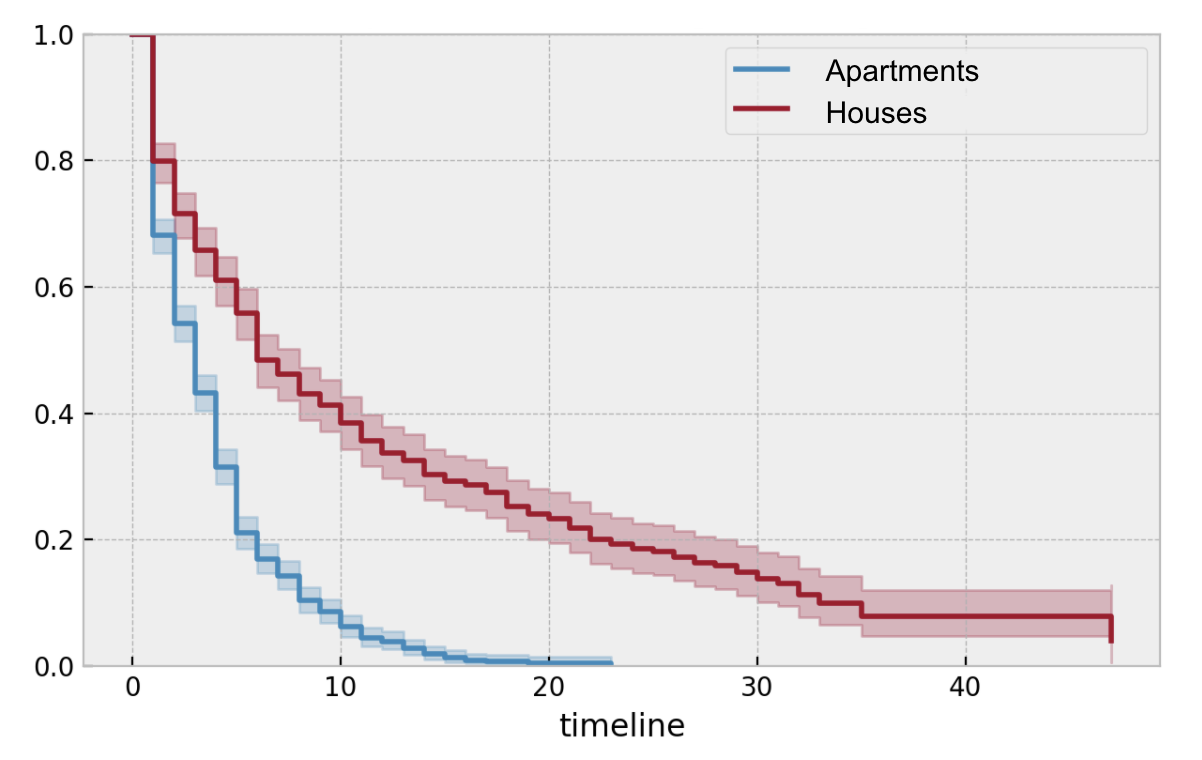
Interpreting groups' survival curves
- Apartment mortgages seem to be paid off faster than house mortgages on average.
- At any given duration, a higher proportion of users pay off apartment mortgages than house mortgages.
Note: if the confidence intervals overlap at some points, it's less likely that there's a real difference between the curves.
Let's practice!
Survival Analysis in Python

