Introdução à Visualização de Dados com a Matplotlib
Introdução à Visualização de Dados com a Matplotlib

Ariel Rokem
Data Scientist
Visualização de dados
Crédito da imagem: Gytis Dudas e Andrew Rambaut
Apresentando a interface pyplot
![]()
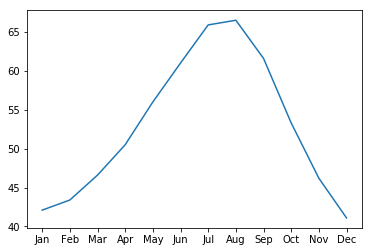
Adicionando dados aos eixos
ax.plot(seattle_weather["MONTH"], seattle_weather["MLY-TAVG-NORMAL"])
plt.show()
Adicionando mais dados
ax.plot(austin_weather["MONTH"], austin_weather["MLY-TAVG-NORMAL"])
plt.show()
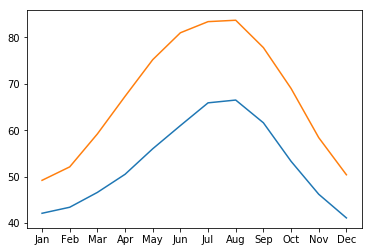
Reunindo tudo
fig, ax = plt.subplots()
ax.plot(seattle_weather["MONTH"], seattle_weather["MLY-TAVG-NORMAL"])
ax.plot(austin_weather["MONTH"], austin_weather["MLY-TAVG-NORMAL"])
plt.show()

