Próximos passos
Introdução à Visualização de Dados com a Matplotlib

Ariel Rokem
Data Scientist
Galeria de exemplos
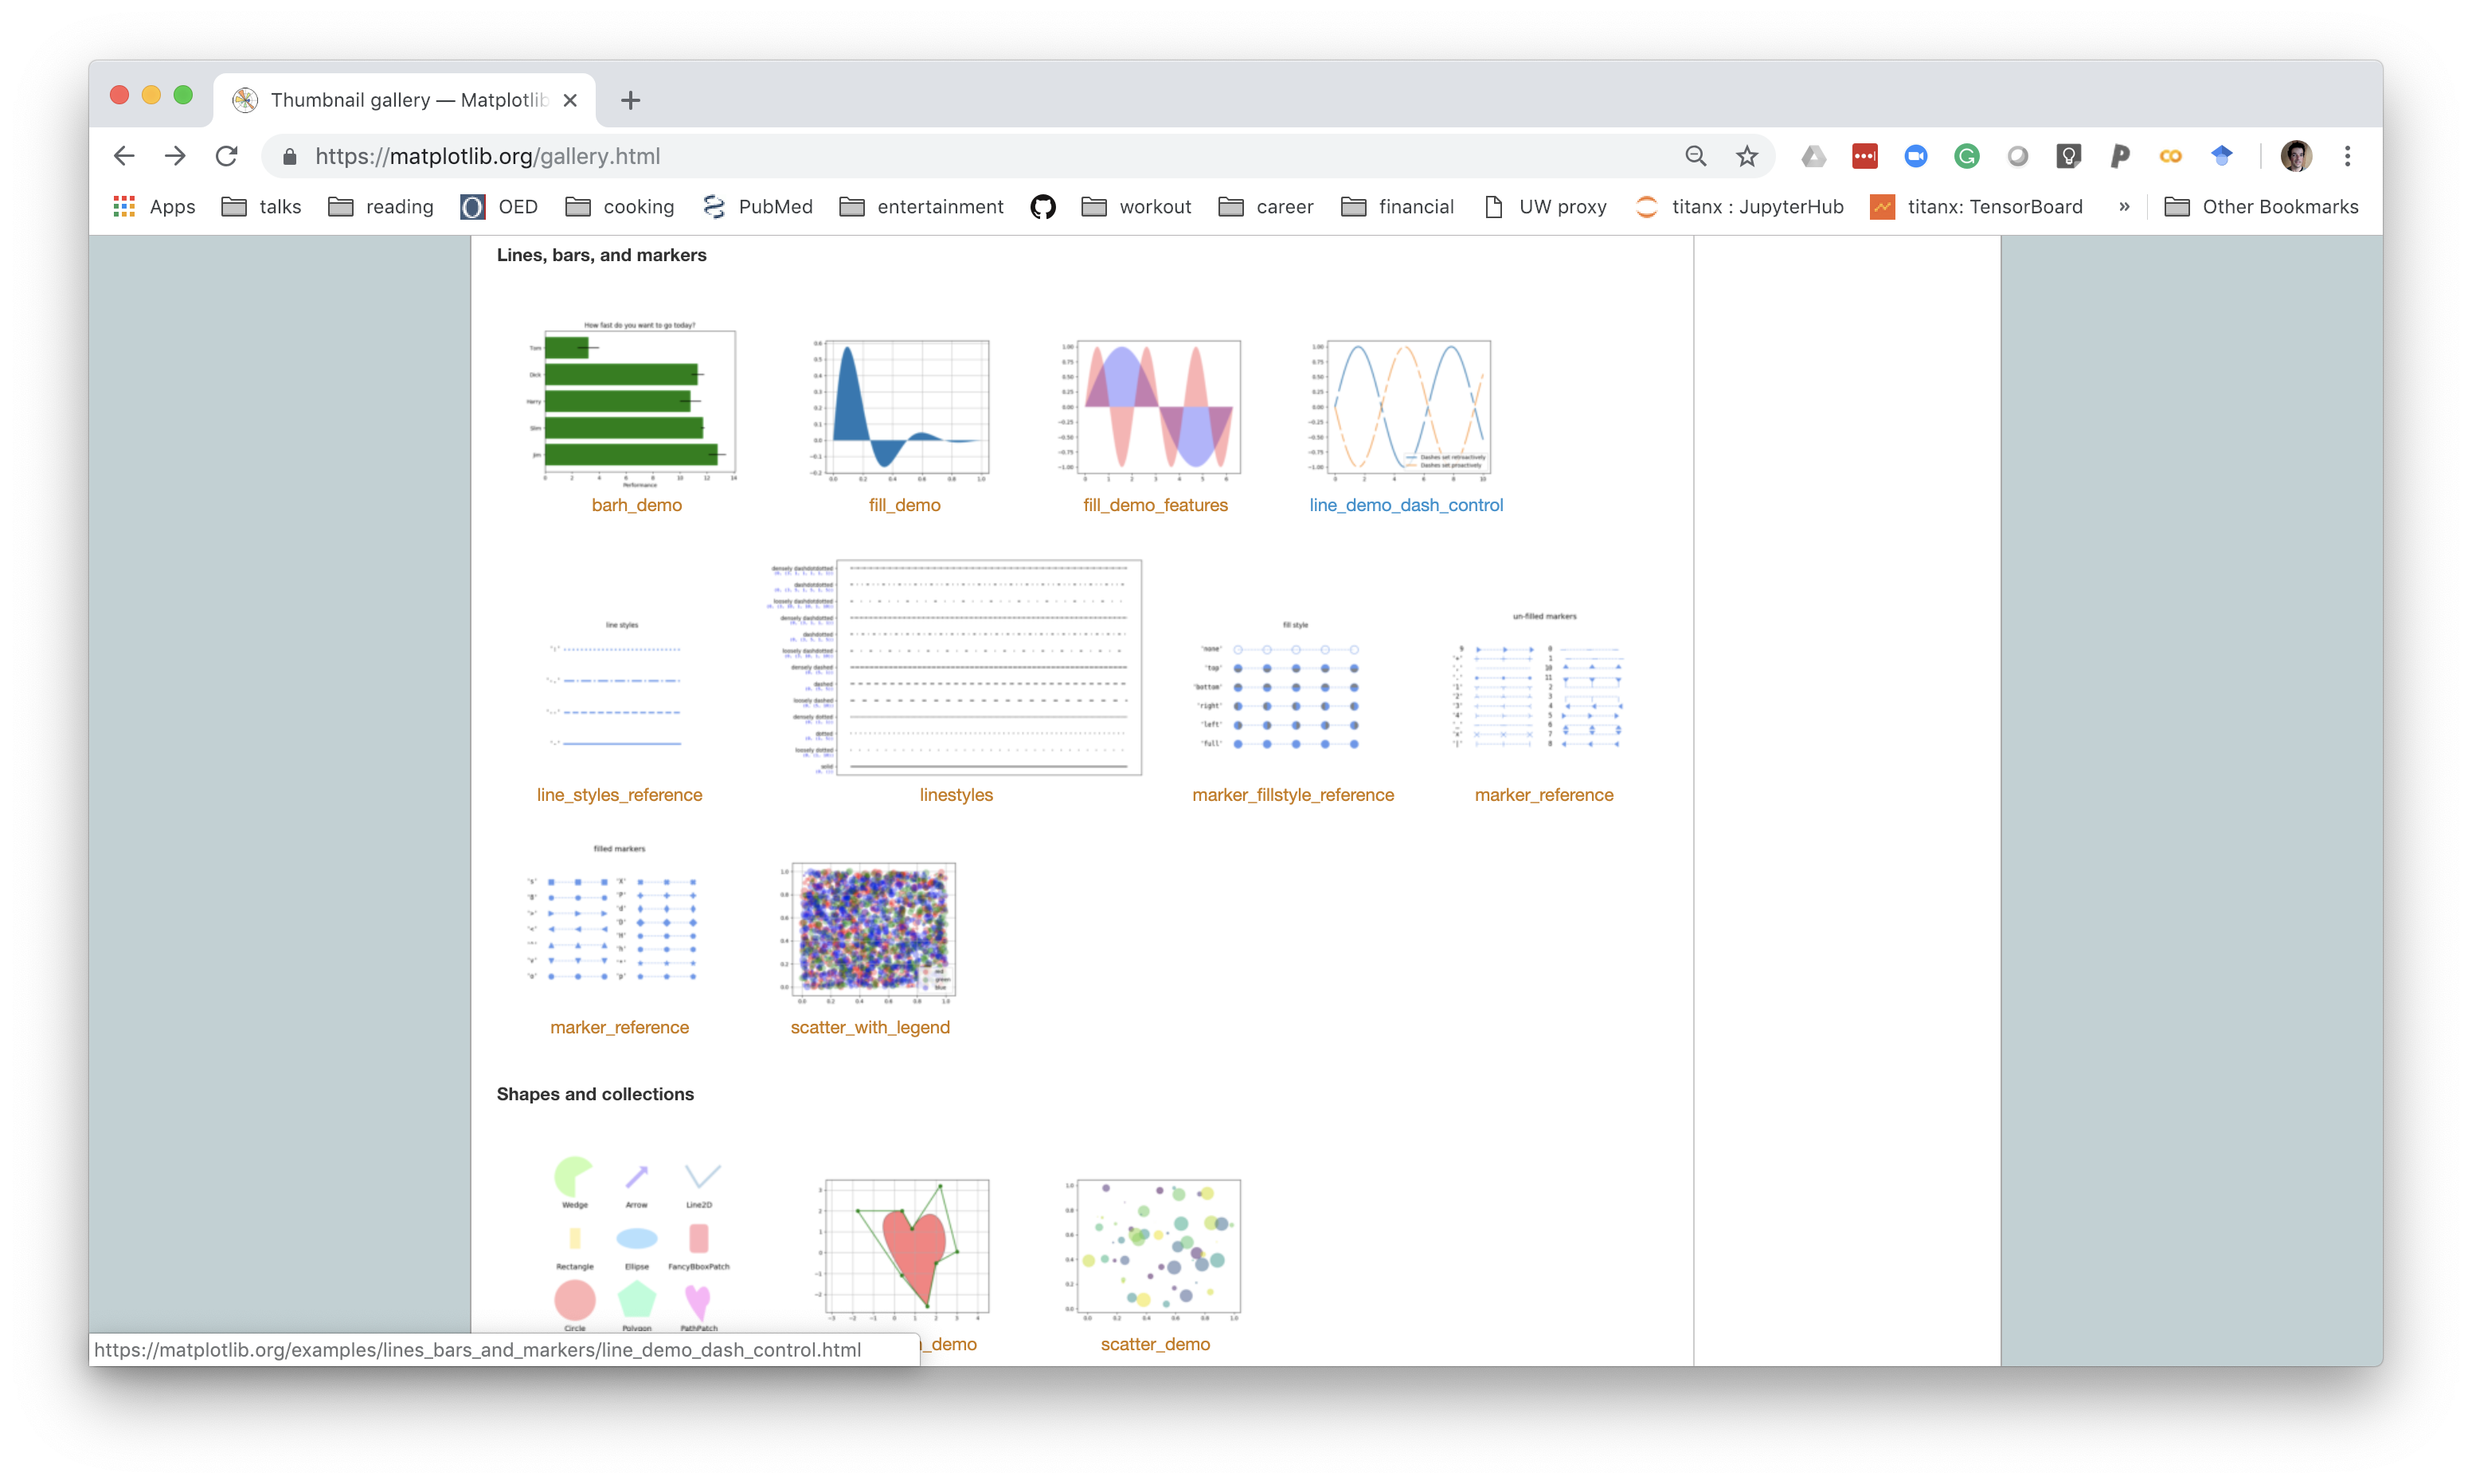
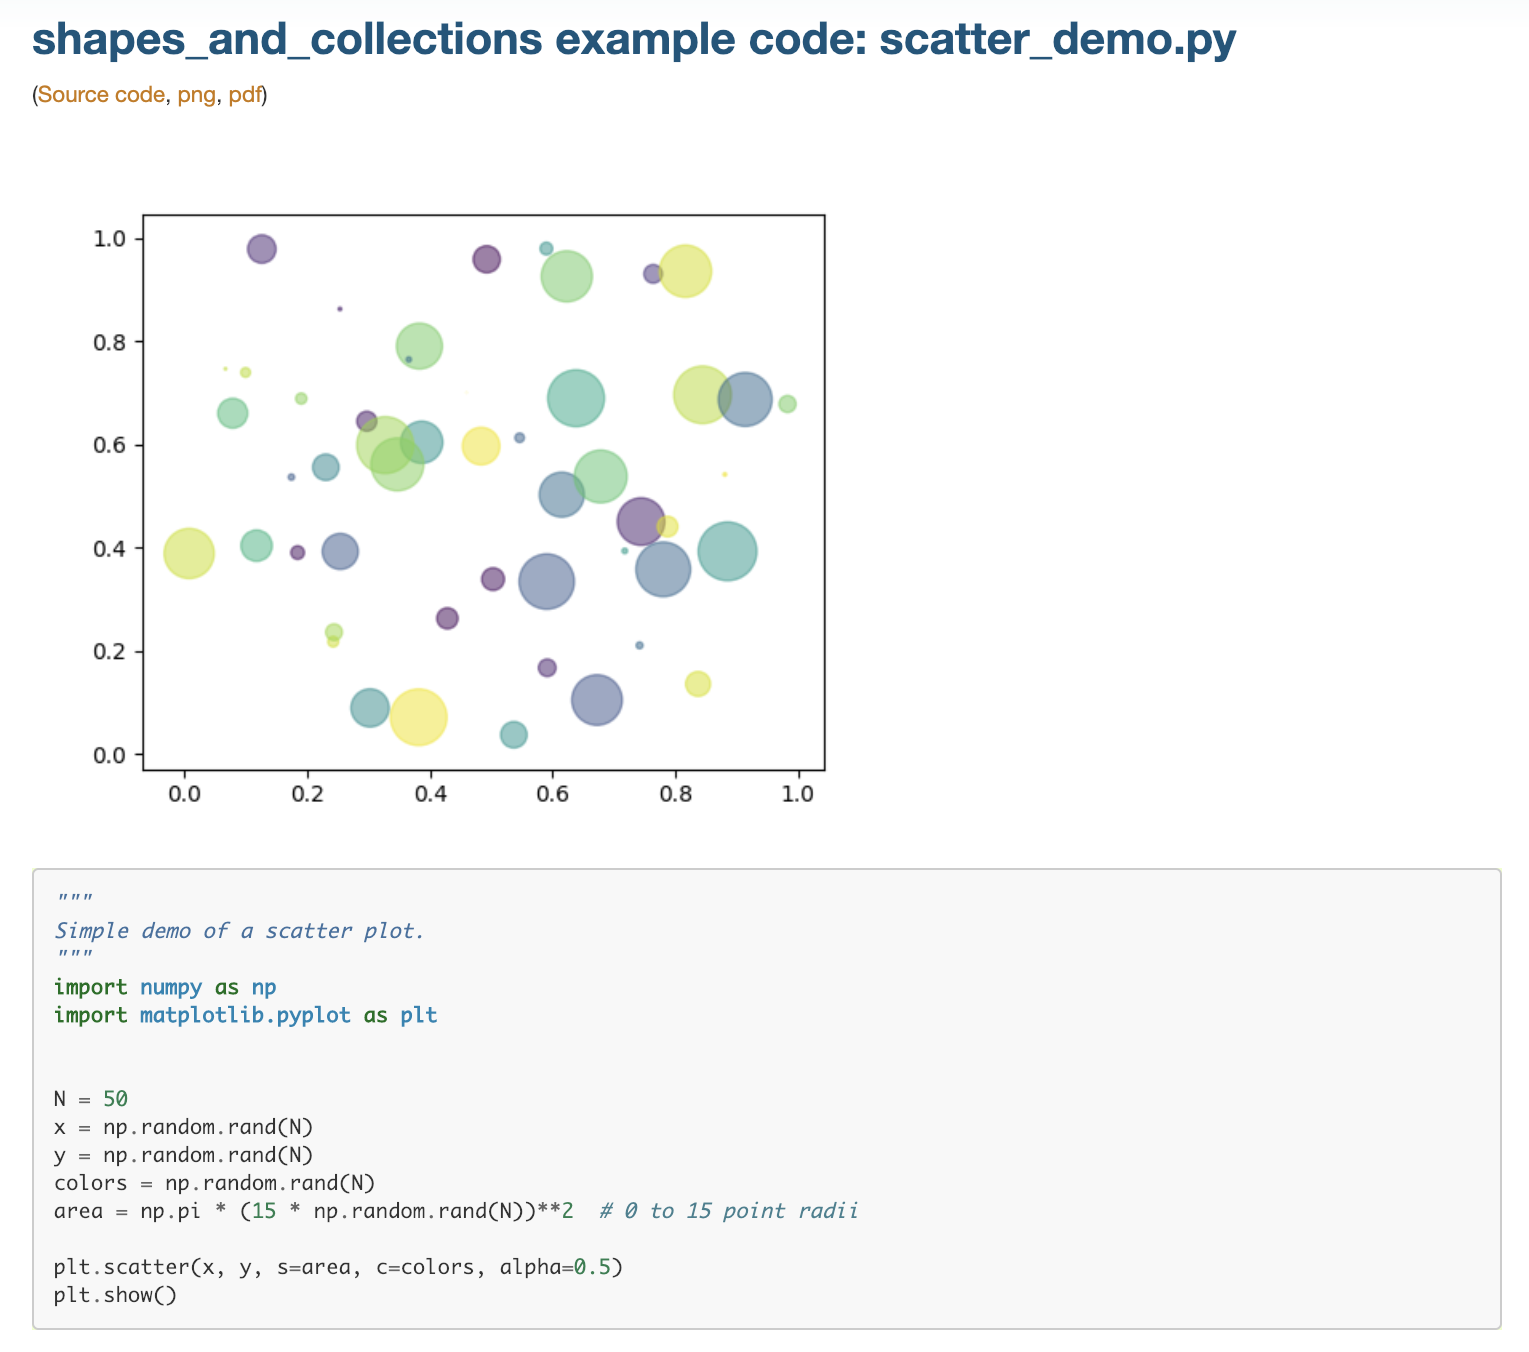
Página de exemplo com código
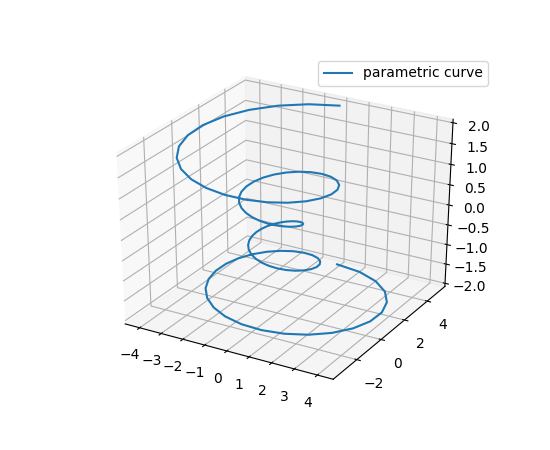
Plotando dados em 3D
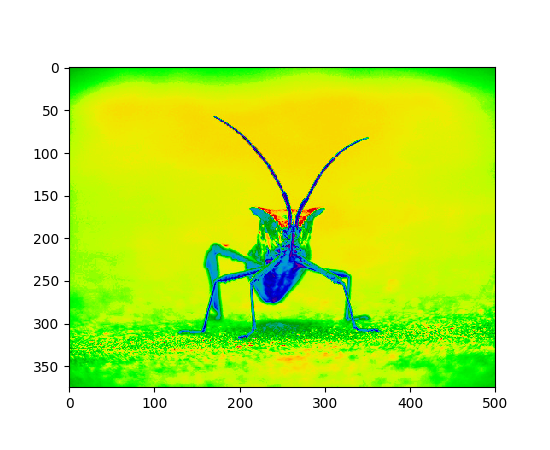
Visualizando imagens com pseudocores
Animações
Usando o Matplotlib para dados geoespaciais

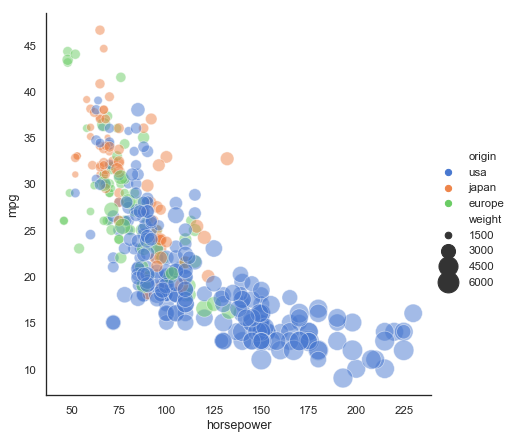
pandas + Matplotlib = Seaborn
seaborn.relplot(x="horsepower", y="mpg", hue="origin", size="weight",
                sizes=(40, 400), alpha=.5, palette="muted",
                height=6, data=mpg)