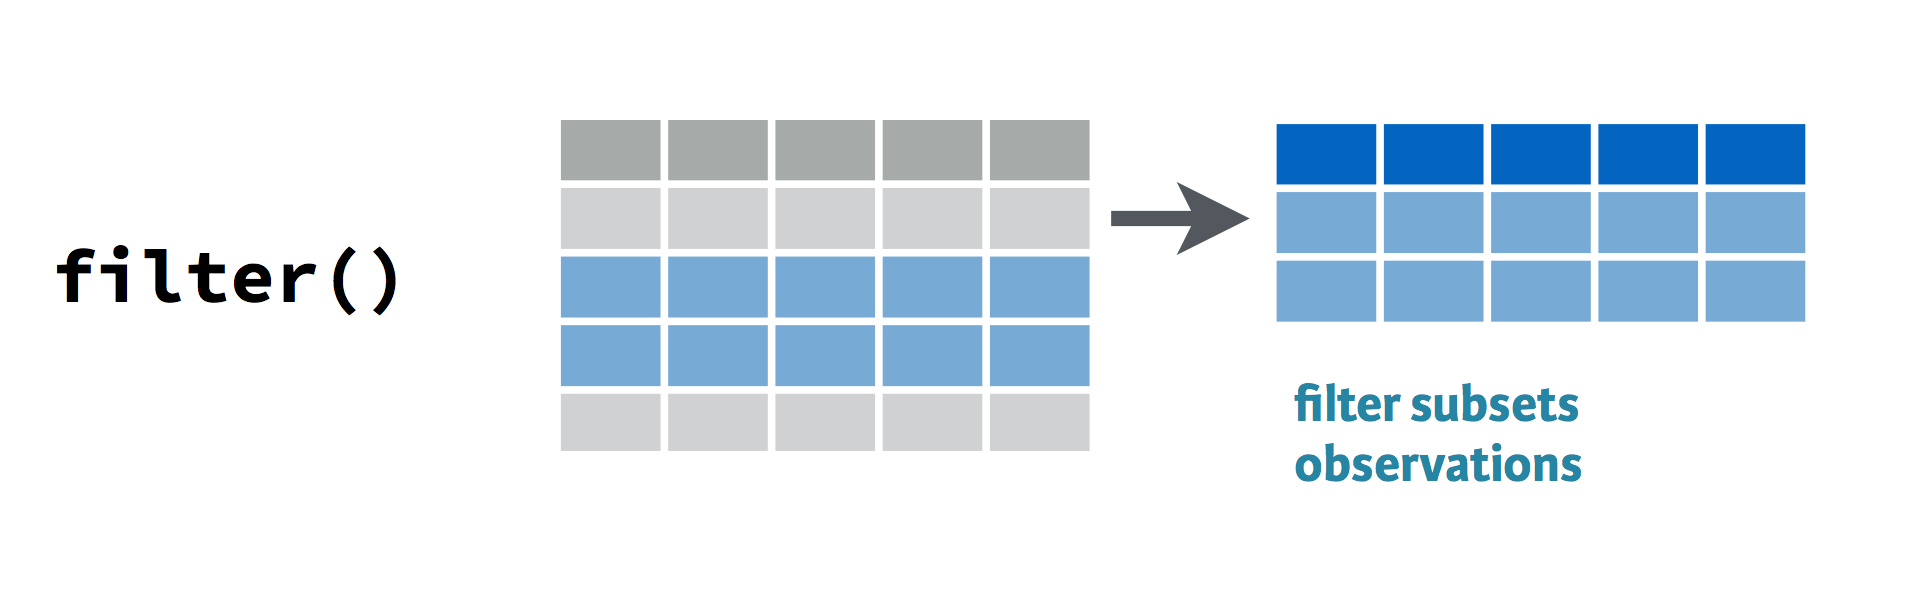
O verbo “filter”
Introdução ao Tidyverse

David Robinson
Chief Data Scientist, DataCamp
O verbo “filter”
Filtrar por um ano
gapminder %>%
  filter(year == 2007)
# A tibble: 142 x 6
       country continent  year lifeExp       pop  gdpPercap
         <fct>     <fct> <int>   <dbl>     <dbl>      <dbl>
 1 Afghanistan      Asia  2007  43.828  31889923   974.5803
 2     Albania    Europe  2007  76.423   3600523  5937.0295
 3     Algeria    Africa  2007  72.301  33333216  6223.3675
 4      Angola    Africa  2007  42.731  12420476  4797.2313
 5   Argentina  Americas  2007  75.320  40301927 12779.3796
 6   Australia   Oceania  2007  81.235  20434176 34435.3674
 7     Austria    Europe  2007  79.829   8199783 36126.4927
 8     Bahrain      Asia  2007  75.635    708573 29796.0483
 9  Bangladesh      Asia  2007  64.062 150448339  1391.2538
10     Belgium    Europe  2007  79.441  10392226 33692.6051
# ... with 132 more rows
Filtrar por um país
gapminder %>%
  filter(country == "United States")
# A tibble: 12 x 6
         country continent  year lifeExp       pop gdpPercap
           <fct>     <fct> <int>   <dbl>     <dbl>     <dbl>
 1 United States  Americas  1952  68.440 157553000  13990.48
 2 United States  Americas  1957  69.490 171984000  14847.13
 3 United States  Americas  1962  70.210 186538000  16173.15
 4 United States  Americas  1967  70.760 198712000  19530.37
 5 United States  Americas  1972  71.340 209896000  21806.04
 6 United States  Americas  1977  73.380 220239000  24072.63
 7 United States  Americas  1982  74.650 232187835  25009.56
 8 United States  Americas  1987  75.020 242803533  29884.35
 9 United States  Americas  1992  76.090 256894189  32003.93
10 United States  Americas  1997  76.810 272911760  35767.43
11 United States  Americas  2002  77.310 287675526  39097.10
12 United States  Americas  2007  78.242 301139947  42951.65
Filtrar por duas variáveis
gapminder %>%
  filter(year == 2007, country == "United States")
# A tibble: 1 x 6
        country continent  year lifeExp       pop gdpPercap
          <fct>     <fct> <int>   <dbl>     <dbl>     <dbl>
1 United States  Americas  2007  78.242 301139947  42951.65
Vamos praticar!
Introdução ao Tidyverse

