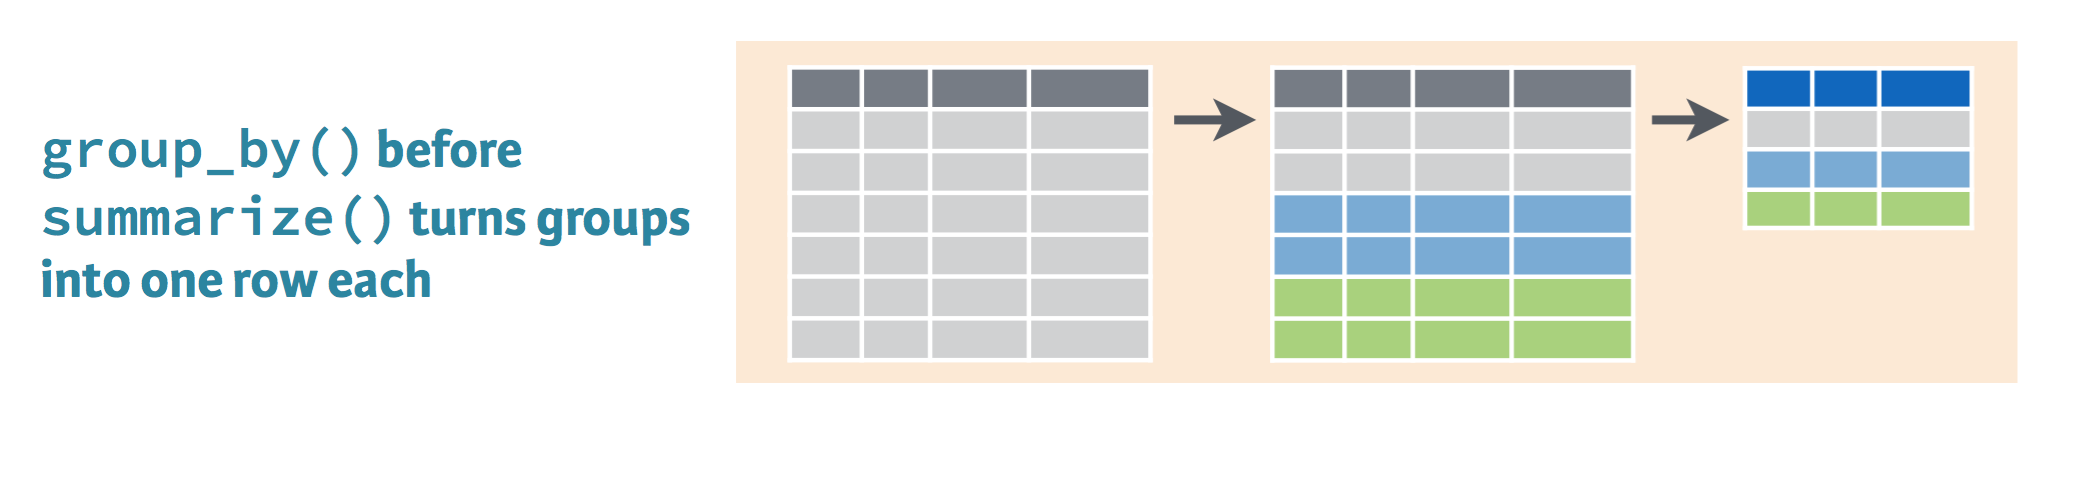
Introduction to the Tidyverse
David Robinson
Chief Data Scientist, DataCamp
gapminder %>%
filter(year == 2007) %>%
summarize(meanLifeExp = mean(lifeExp),
totalPop = sum(pop))
# A tibble: 1 x 2
meanLifeExp totalPop
<dbl> <dbl>
1 67.00742 6251013179
gapminder %>%
group_by(year) %>%
summarize(meanLifeExp = mean(lifeExp),
totalPop = sum(pop))
# A tibble: 12 x 3
year meanLifeExp totalPop
<int> <dbl> <dbl>
1 1952 49.05762 2406957150
2 1957 51.50740 2664404580
3 1962 53.60925 2899782974
4 1967 55.67829 3217478384
5 1972 57.64739 3576977158
6 1977 59.57016 3930045807
7 1982 61.53320 4289436840
8 1987 63.21261 4691477418
9 1992 64.16034 5110710260
10 1997 65.01468 5515204472
11 2002 65.69492 5886977579
12 2007 67.00742 6251013179
gapminder %>%
filter(year == 2007) %>%
group_by(continent) %>%
summarize(meanLifeExp = mean(lifeExp),
totalPop = sum(pop))
# A tibble: 5 x 3
continent meanLifeExp totalPop
<fct> <dbl> <dbl>
1 Africa 48.86533 6187585961
2 Americas 64.65874 7351438499
3 Asia 60.06490 30507333901
4 Europe 71.90369 6181115304
5 Oceania 74.32621 212992136
gapminder %>%
group_by(year, continent) %>%
summarize(totalPop = sum(pop),
meanLifeExp = mean(lifeExp))
# A tibble: 60 x 4
# Groups: year [?]
year continent totalPop meanLifeExp
<int> <fct> <dbl> <dbl>
1 1952 Africa 237640501 39.13550
2 1952 Americas 345152446 53.27984
3 1952 Asia 1395357351 46.31439
4 1952 Europe 418120846 64.40850
5 1952 Oceania 10686006 69.25500
6 1957 Africa 264837738 41.26635
7 1957 Americas 386953916 55.96028
8 1957 Asia 1562780599 49.31854
9 1957 Europe 437890351 66.70307
10 1957 Oceania 11941976 70.29500
# ... with 50 more rows
Introduction to the Tidyverse