O verbo “mutate”
Introdução ao Tidyverse

David Robinson
Chief Data Scientist, DataCamp
O verbo “mutate”
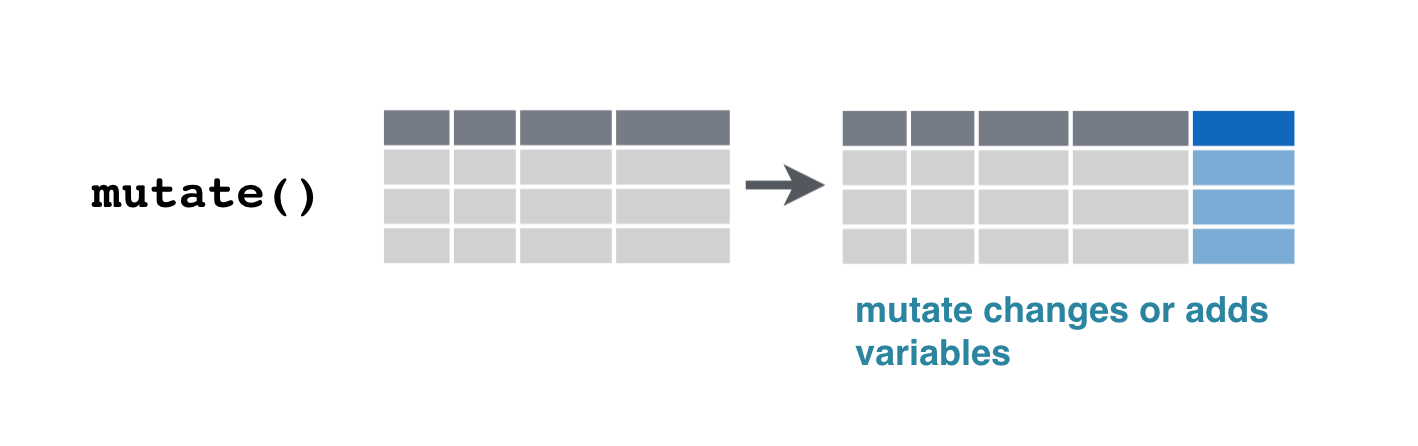
Usar mutate para alterar uma variável
gapminder %>%
  mutate(pop = pop / 1000000)
# A tibble: 1,704 x 6
       country continent  year lifeExp       pop gdpPercap
         <fct>     <fct> <int>   <dbl>     <dbl>     <dbl>
 1 Afghanistan      Asia  1952  28.801  8.425333  779.4453
 2 Afghanistan      Asia  1957  30.332  9.240934  820.8530
 3 Afghanistan      Asia  1962  31.997 10.267083  853.1007
 4 Afghanistan      Asia  1967  34.020 11.537966  836.1971
 5 Afghanistan      Asia  1972  36.088 13.079460  739.9811
 6 Afghanistan      Asia  1977  38.438 14.880372  786.1134
 7 Afghanistan      Asia  1982  39.854 12.881816  978.0114
 8 Afghanistan      Asia  1987  40.822 13.867957  852.3959
 9 Afghanistan      Asia  1992  41.674 16.317921  649.3414
10 Afghanistan      Asia  1997  41.763 22.227415  635.3414
# ... with 1,694 more rows
Usar mutate para adicionar uma nova variável
gapminder %>%
  mutate(gdp = gdpPercap * pop)
# A tibble: 1,704 x 7
       country continent  year lifeExp      pop gdpPercap         gdp
         <fct>     <fct> <int>   <dbl>    <dbl>     <dbl>       <dbl>
 1 Afghanistan      Asia  1952  28.801  8425333  779.4453  6567086330
 2 Afghanistan      Asia  1957  30.332  9240934  820.8530  7585448670
 3 Afghanistan      Asia  1962  31.997 10267083  853.1007  8758855797
 4 Afghanistan      Asia  1967  34.020 11537966  836.1971  9648014150
 5 Afghanistan      Asia  1972  36.088 13079460  739.9811  9678553274
 6 Afghanistan      Asia  1977  38.438 14880372  786.1134 11697659231
 7 Afghanistan      Asia  1982  39.854 12881816  978.0114 12598563401
 8 Afghanistan      Asia  1987  40.822 13867957  852.3959 11820990309
 9 Afghanistan      Asia  1992  41.674 16317921  649.3414 10595901589
10 Afghanistan      Asia  1997  41.763 22227415  635.3414 14121995875
# ... with 1,694 more rows
Combinar verbos
gapminder %>%
  mutate(gdp = gdpPercap * pop) %>%
  filter(year == 2007) %>%
  arrange(desc(gdp))
# A tibble: 142 x 7
          country continent  year lifeExp        pop gdpPercap          gdp
            <fct>     <fct> <int>   <dbl>      <dbl>     <dbl>        <dbl>
 1  United States  Americas  2007  78.242  301139947 42951.653 1.293446e+13
 2          China      Asia  2007  72.961 1318683096  4959.115 6.539501e+12
 3          Japan      Asia  2007  82.603  127467972 31656.068 4.035135e+12
 4          India      Asia  2007  64.698 1110396331  2452.210 2.722925e+12
 5        Germany    Europe  2007  79.406   82400996 32170.374 2.650871e+12
 6 United Kingdom    Europe  2007  79.425   60776238 33203.261 2.017969e+12
 7         France    Europe  2007  80.657   61083916 30470.017 1.861228e+12
 8         Brazil  Americas  2007  72.390  190010647  9065.801 1.722599e+12
 9          Italy    Europe  2007  80.546   58147733 28569.720 1.661264e+12
10         Mexico  Americas  2007  76.195  108700891 11977.575 1.301973e+12
# ... with 132 more rows
Vamos praticar!
Introdução ao Tidyverse

