Como criar uma história que faz sentido
Estudo de Caso: Analisando Churn de Clientes no Power BI

Iason Prassides
Content Developer, Datacamp
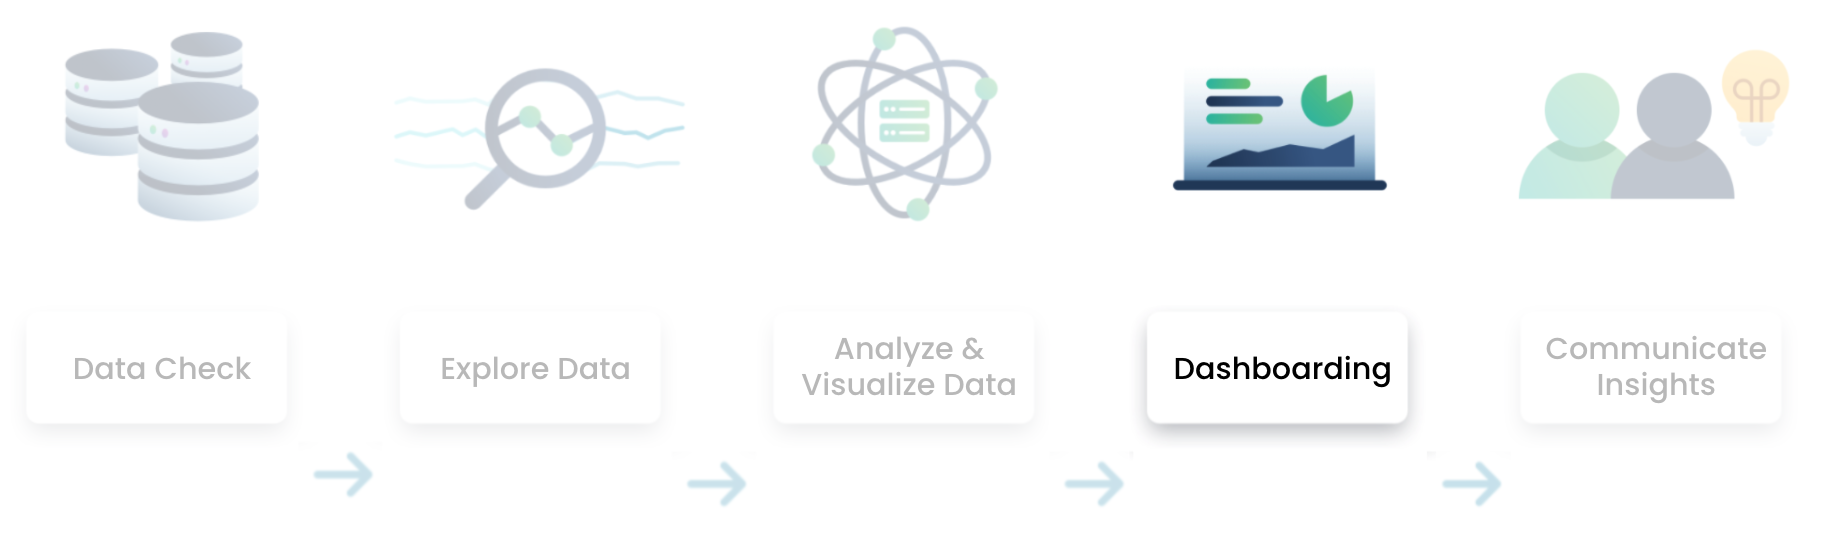
Fluxo de análise de dados
Organizar sua análise não é fácil
- Não é informativo publicar visualizações colocadas aleatoriamente em páginas diferentes.
- É necessário juntar as informações que combinam bem.
É hora de criar uma narrativa para os stakeholders
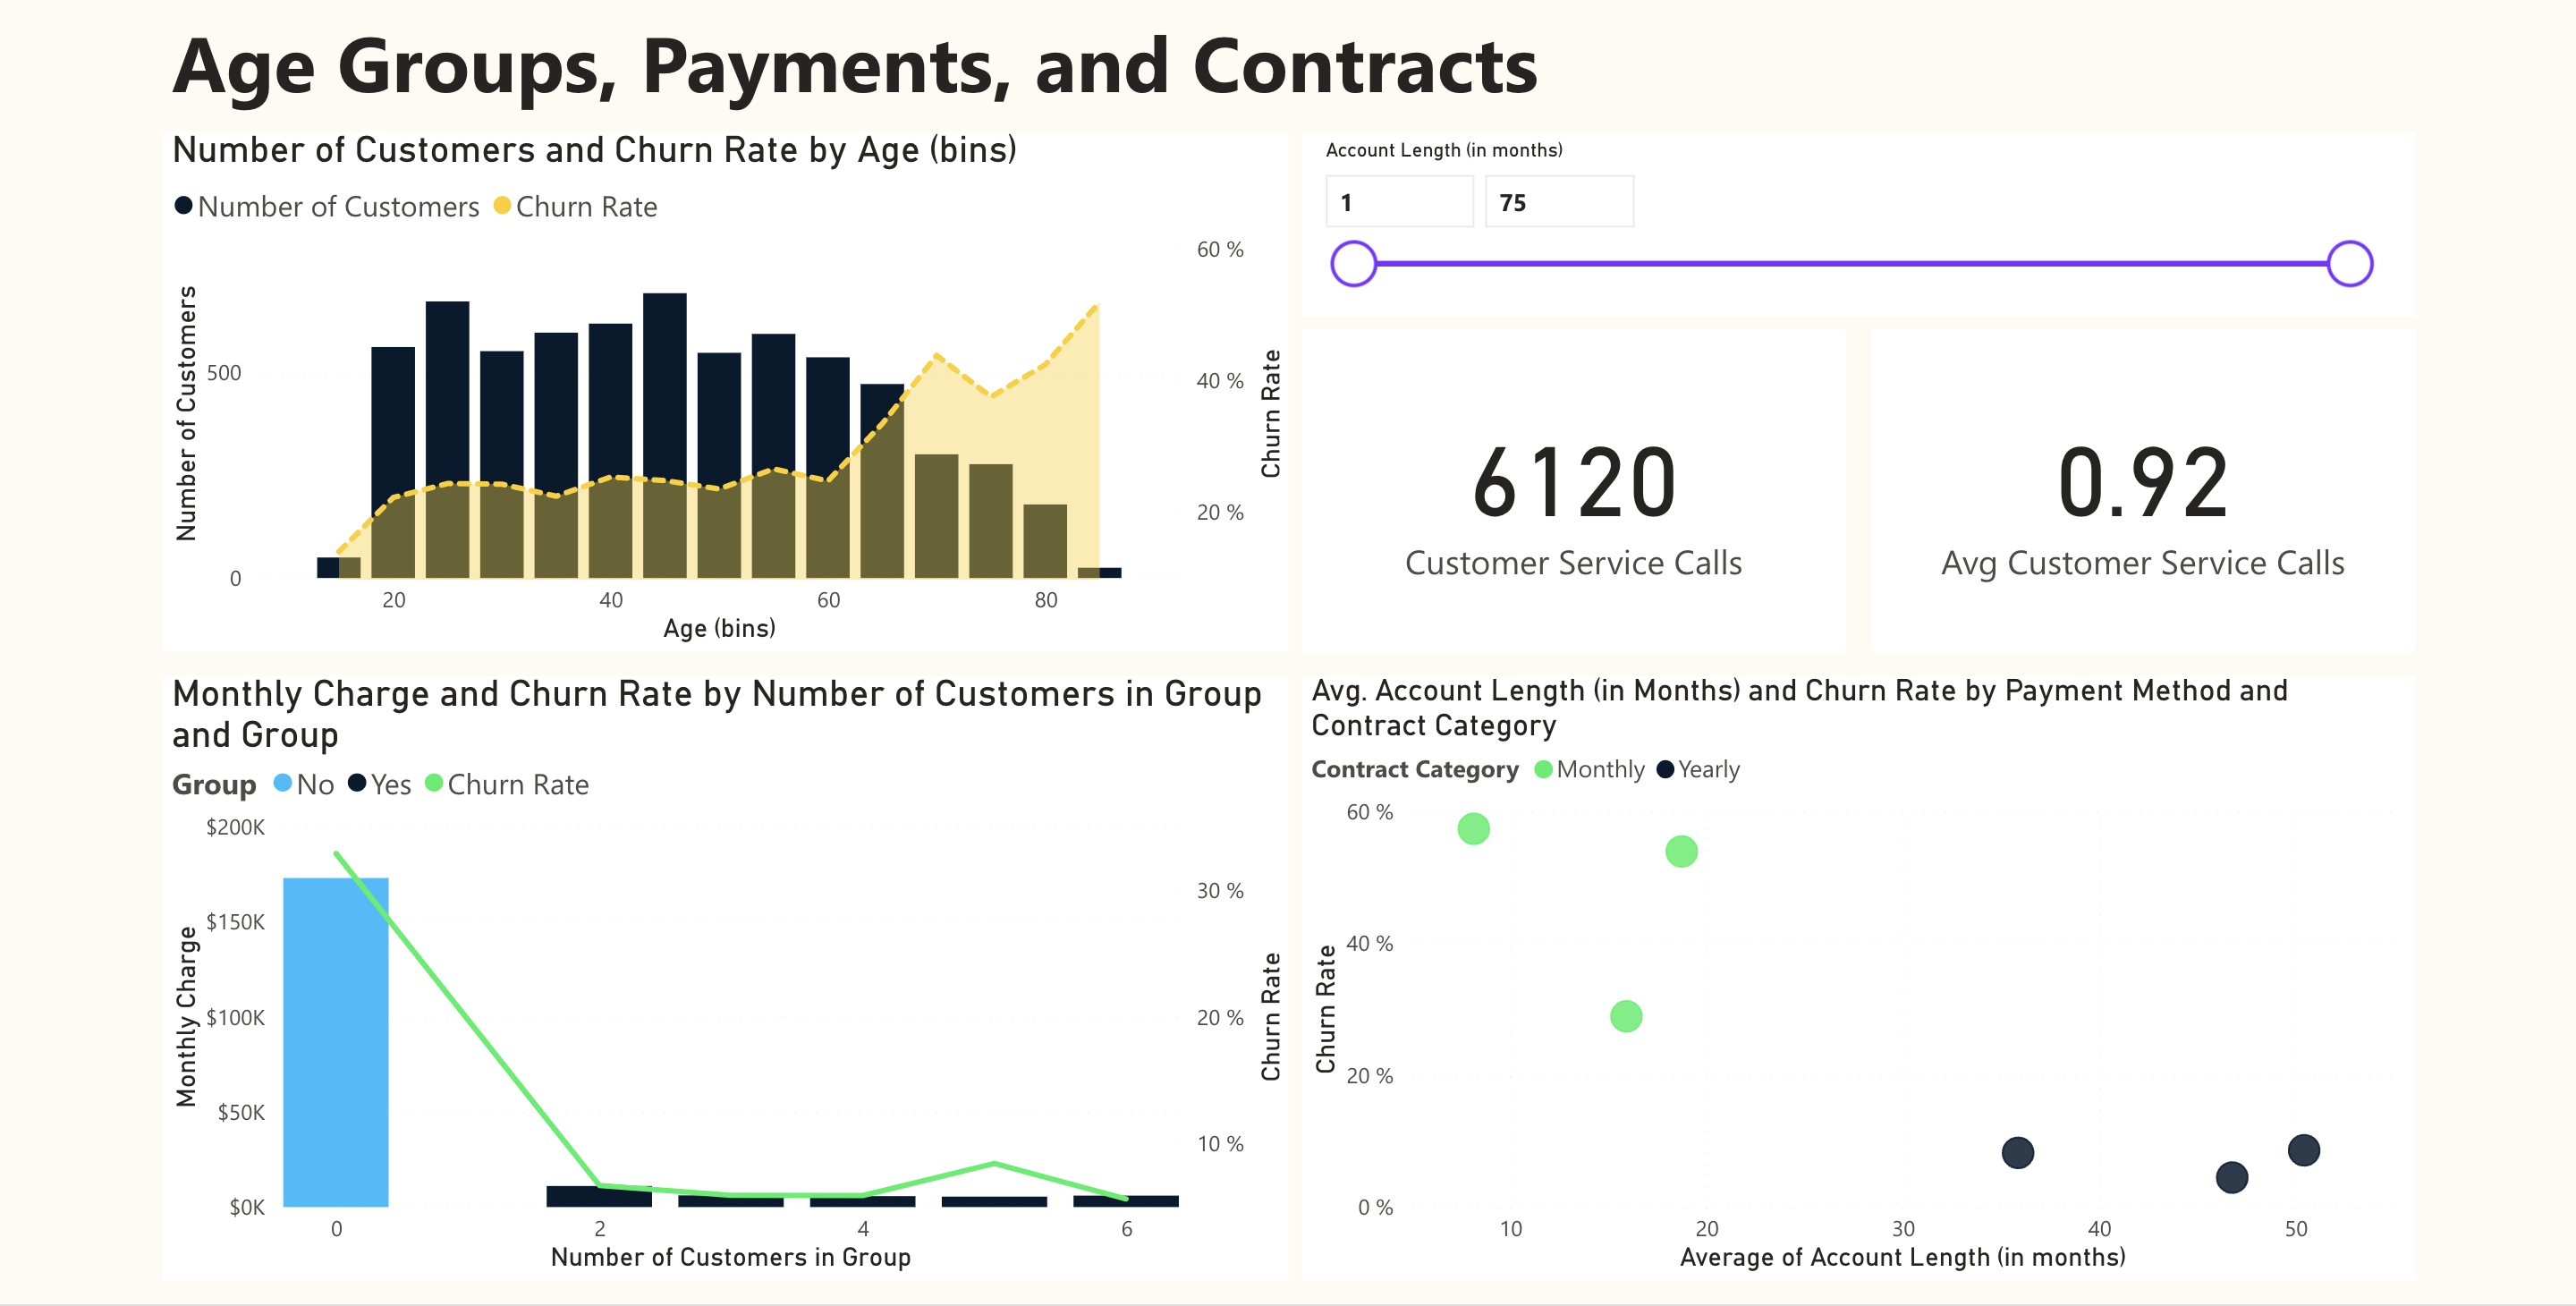
Tema diferente para cada página
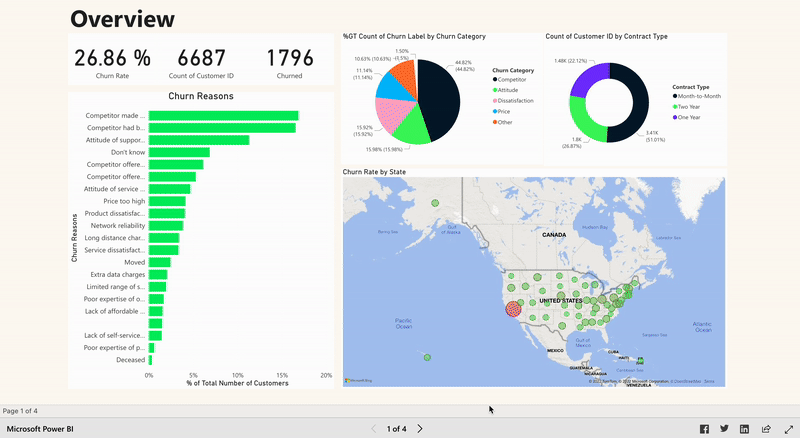
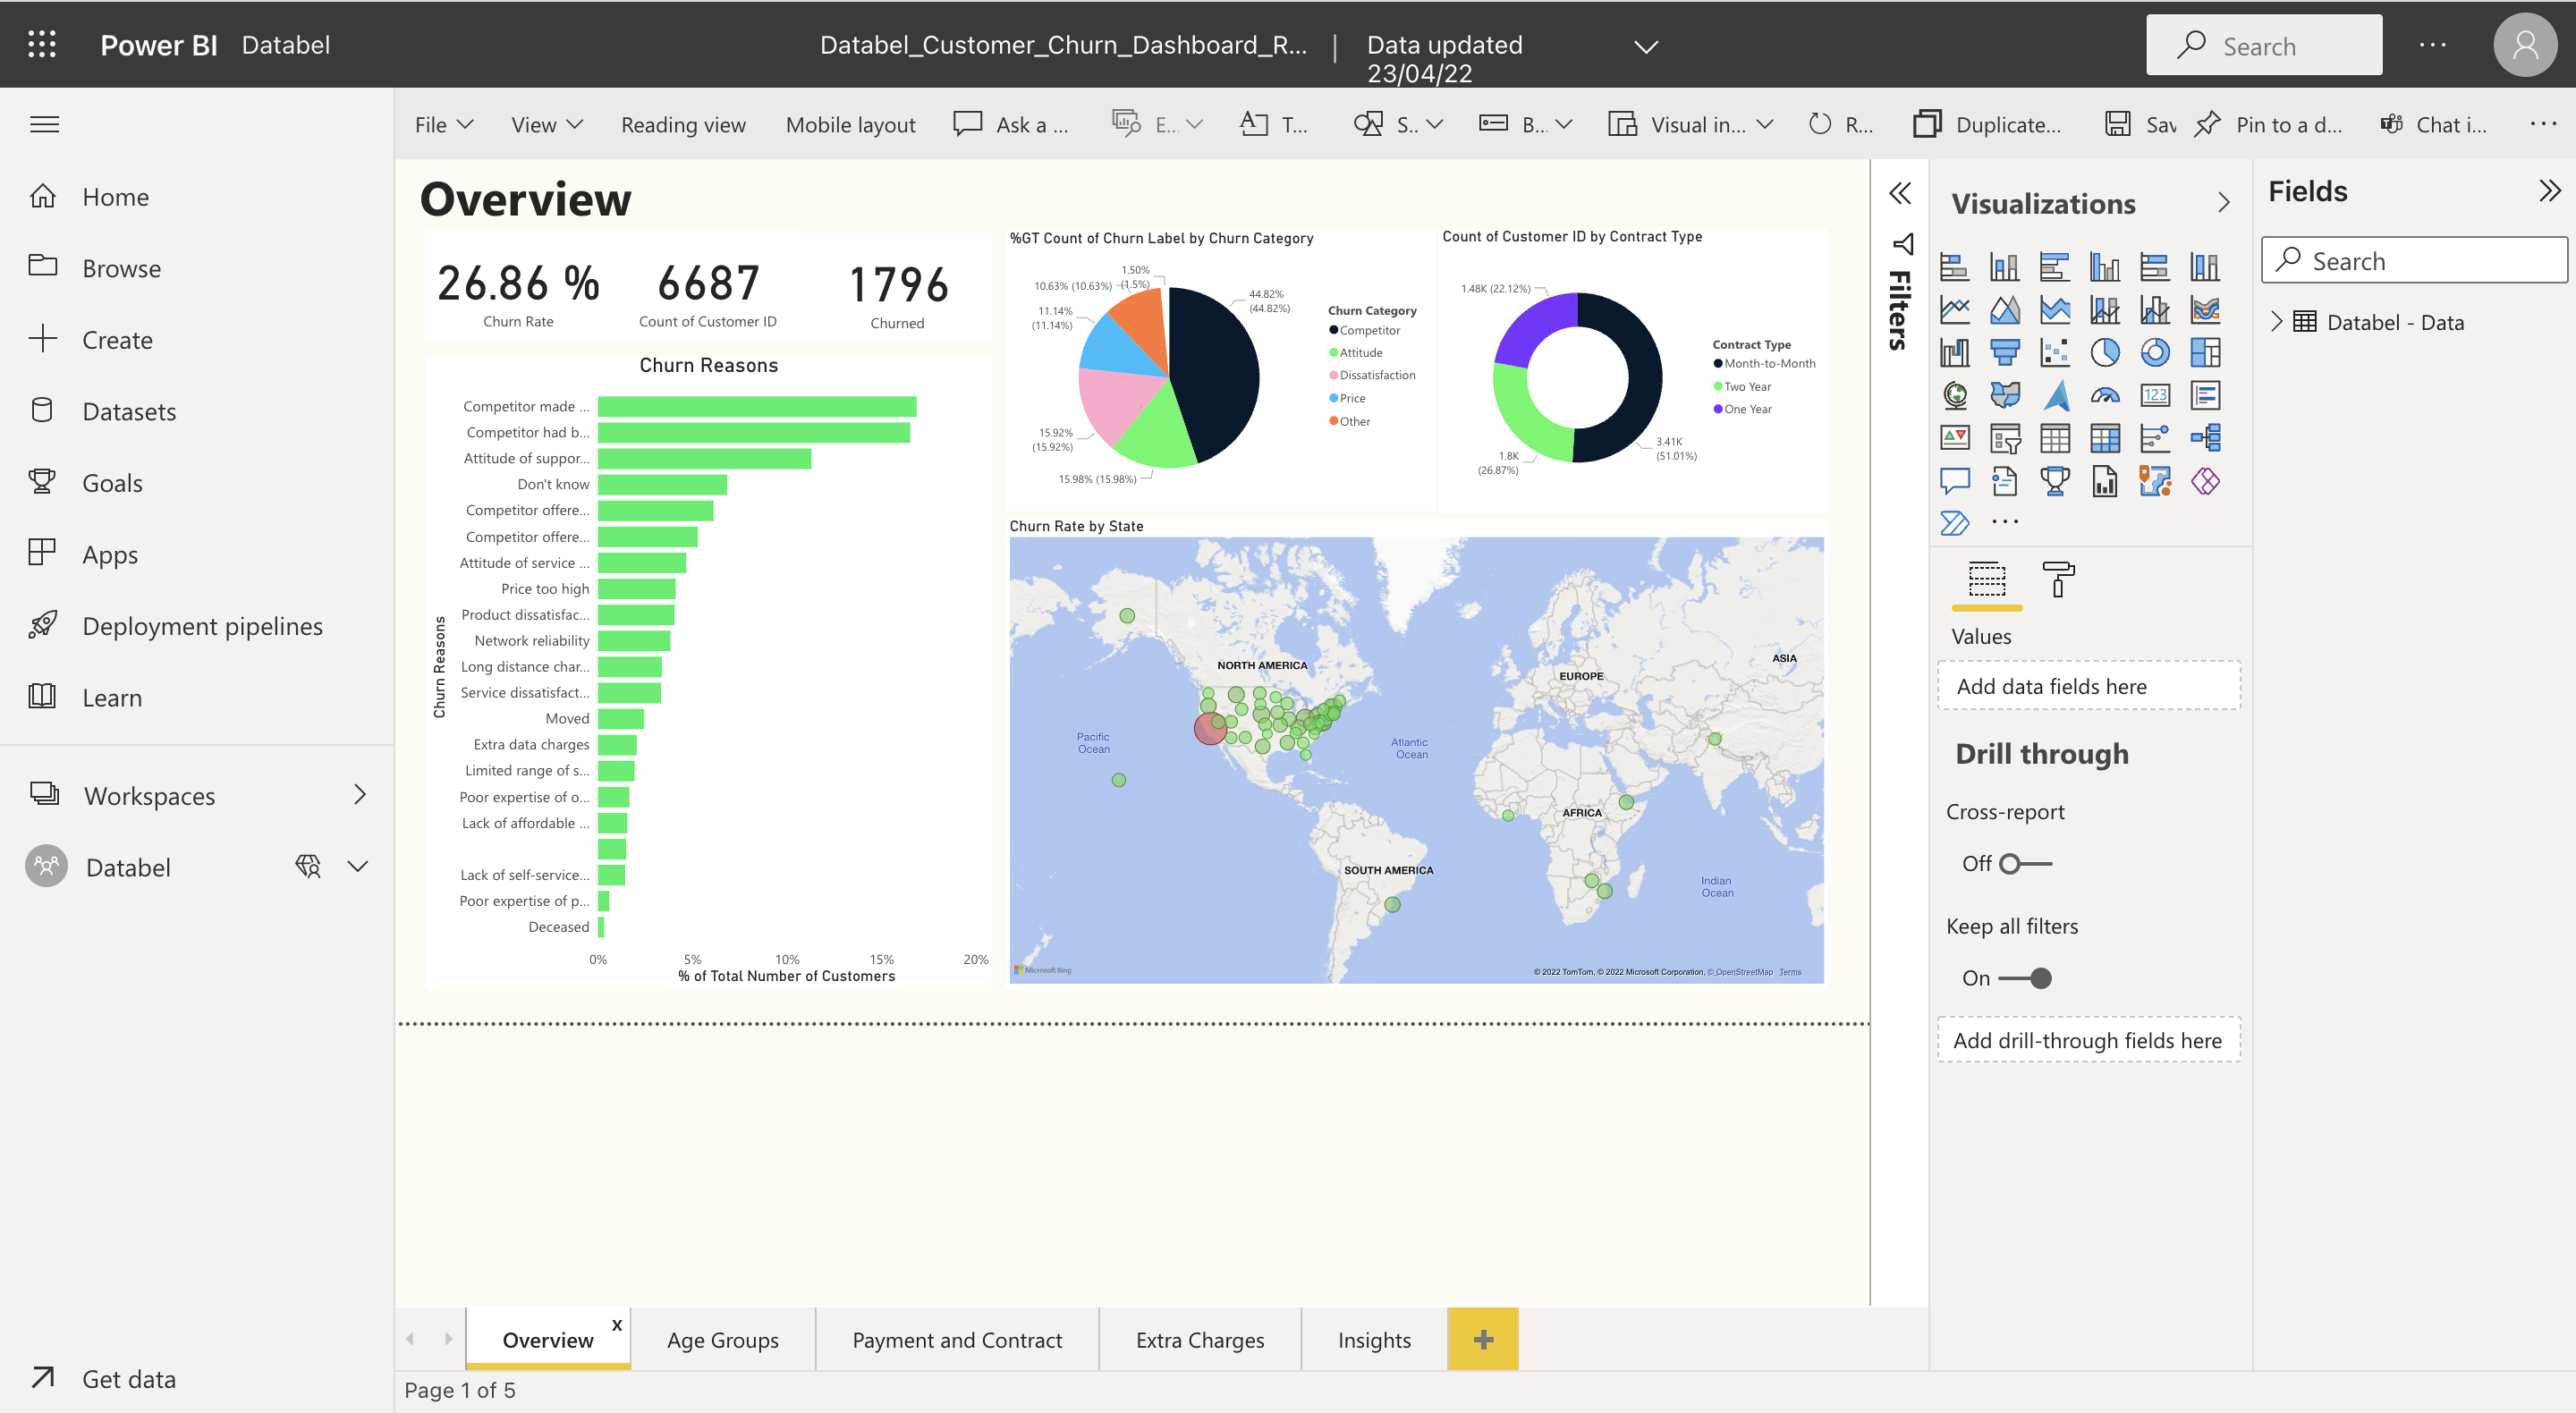
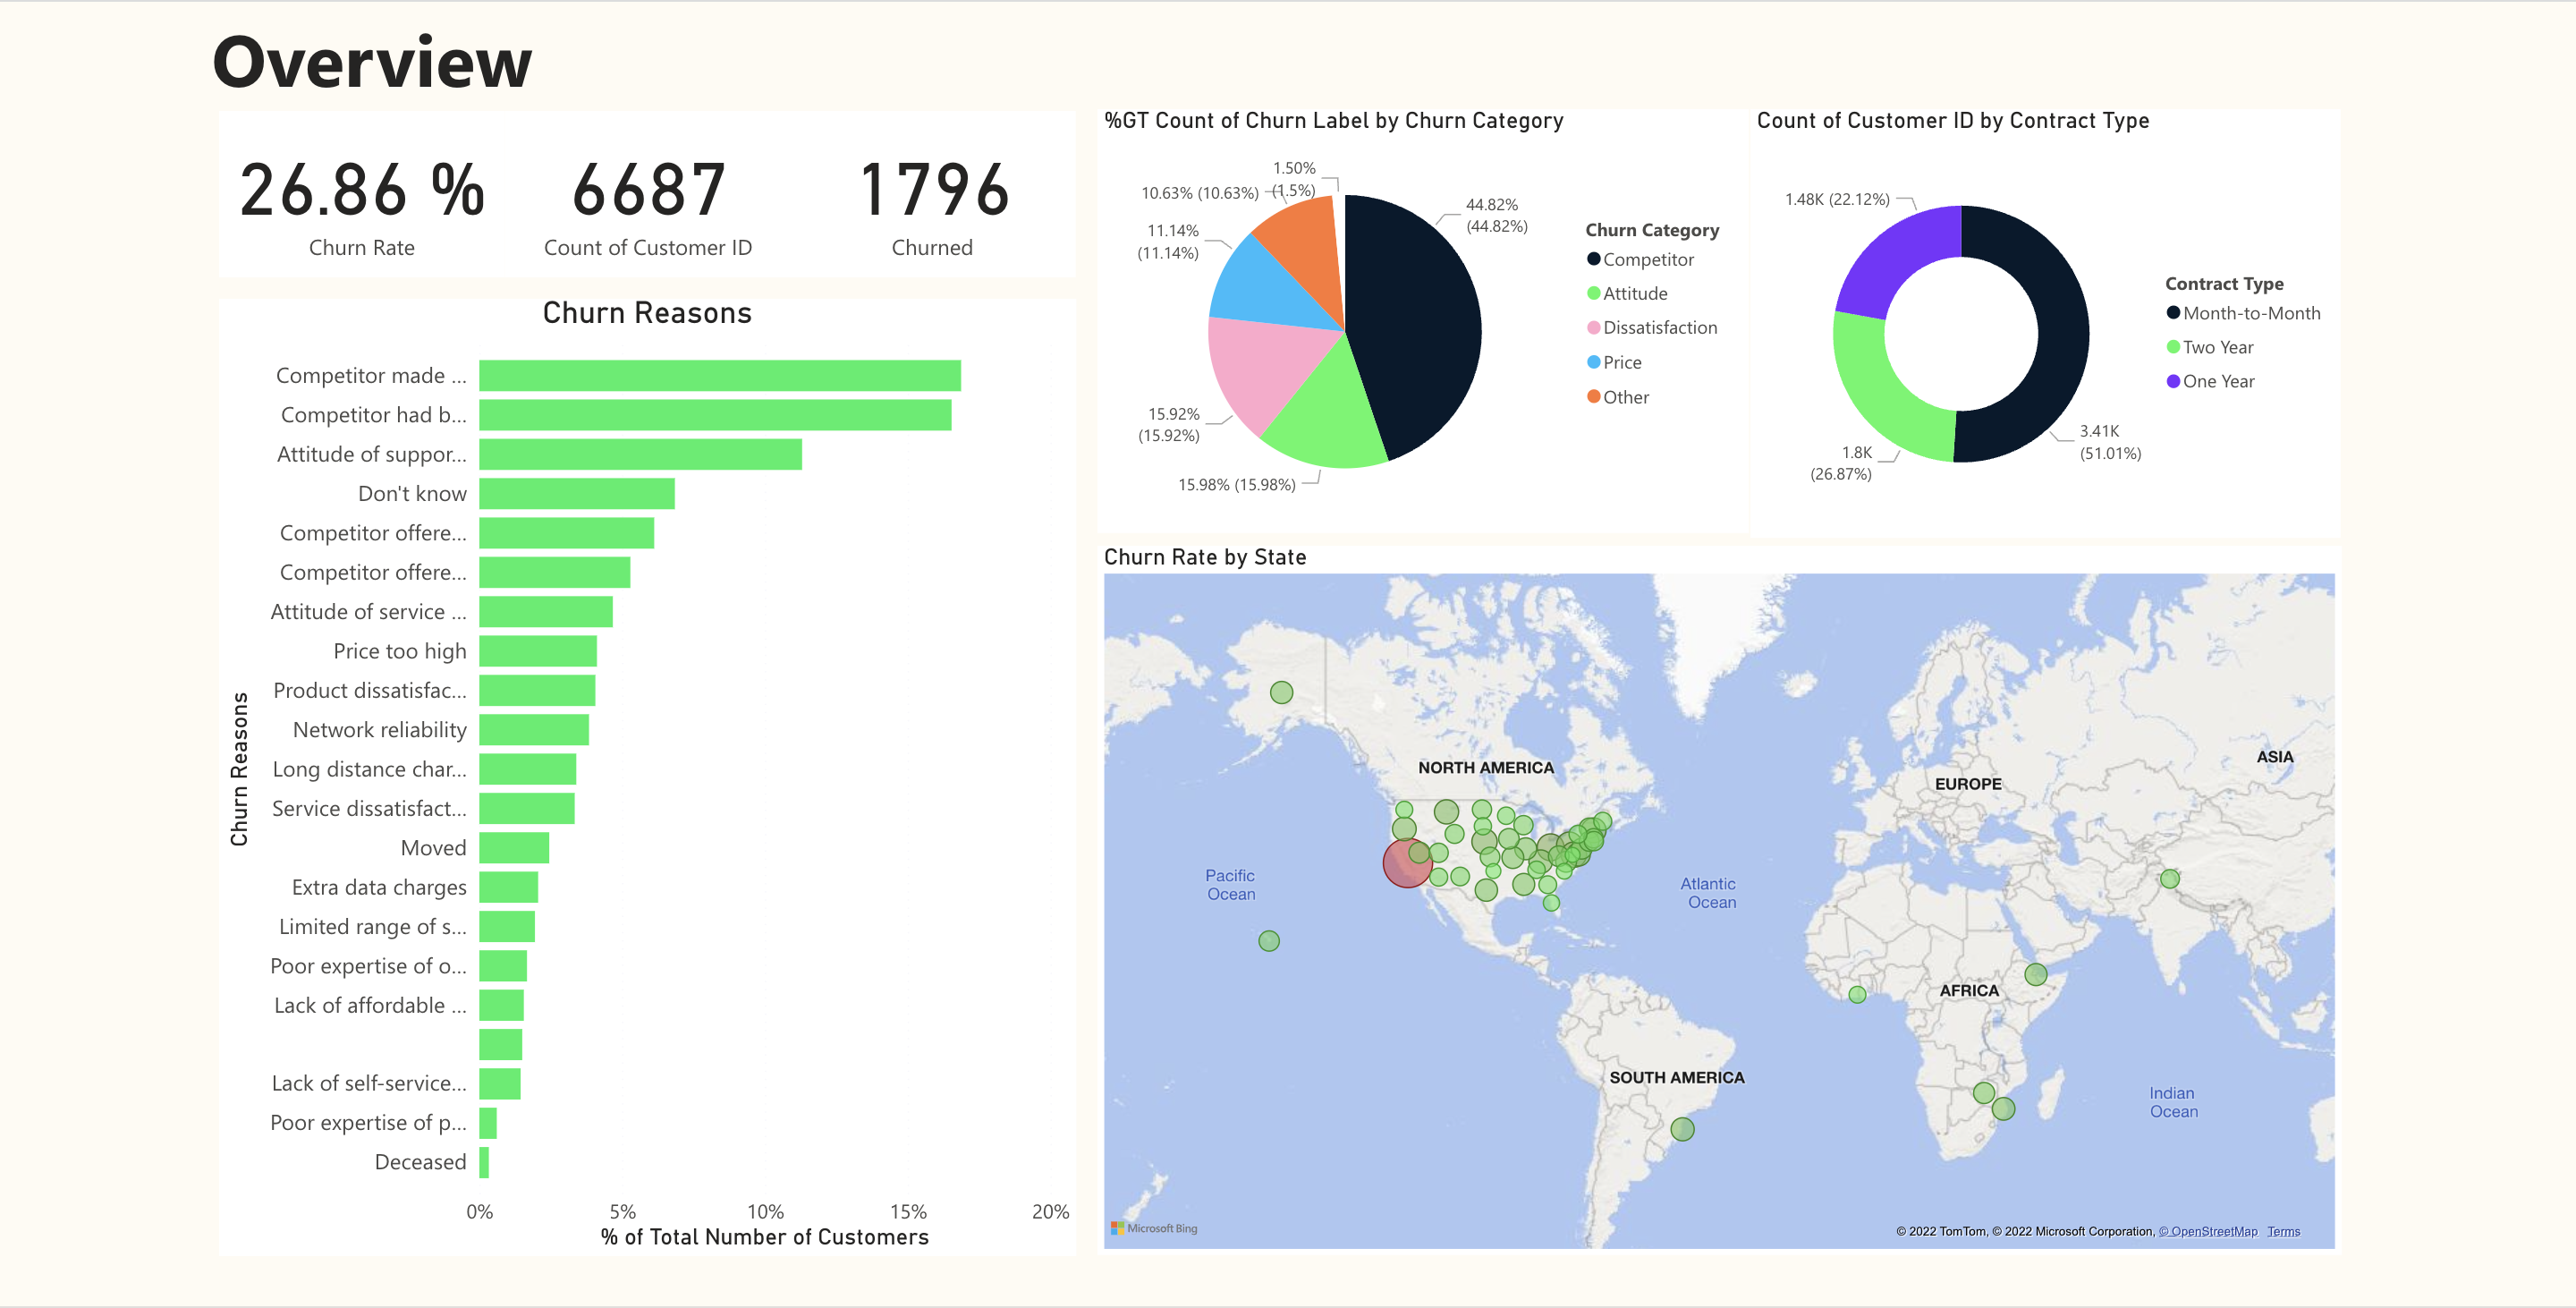
Visão geral de uma página do relatório
A interatividade torna um relatório mais eficaz
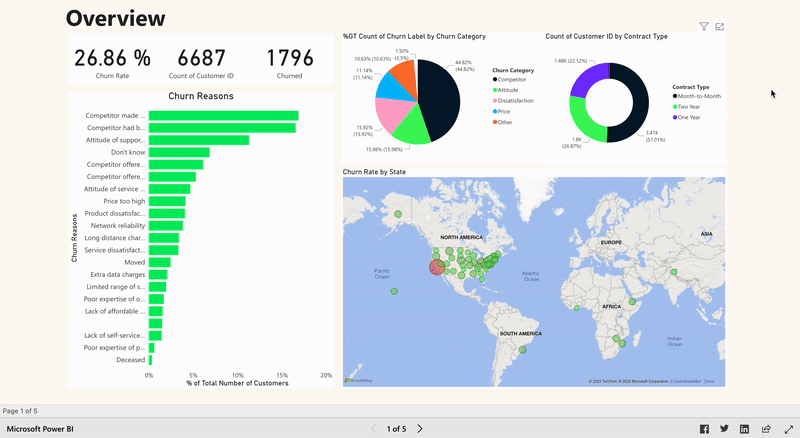
A interatividade torna um relatório mais eficaz

A interatividade torna um relatório mais eficaz