Análise da rotatividade de clientes no Power BI
Estudo de Caso: Analisando Churn de Clientes no Power BI

Iason Prassides
Content Developer, DataCamp
O que é um estudo de caso?

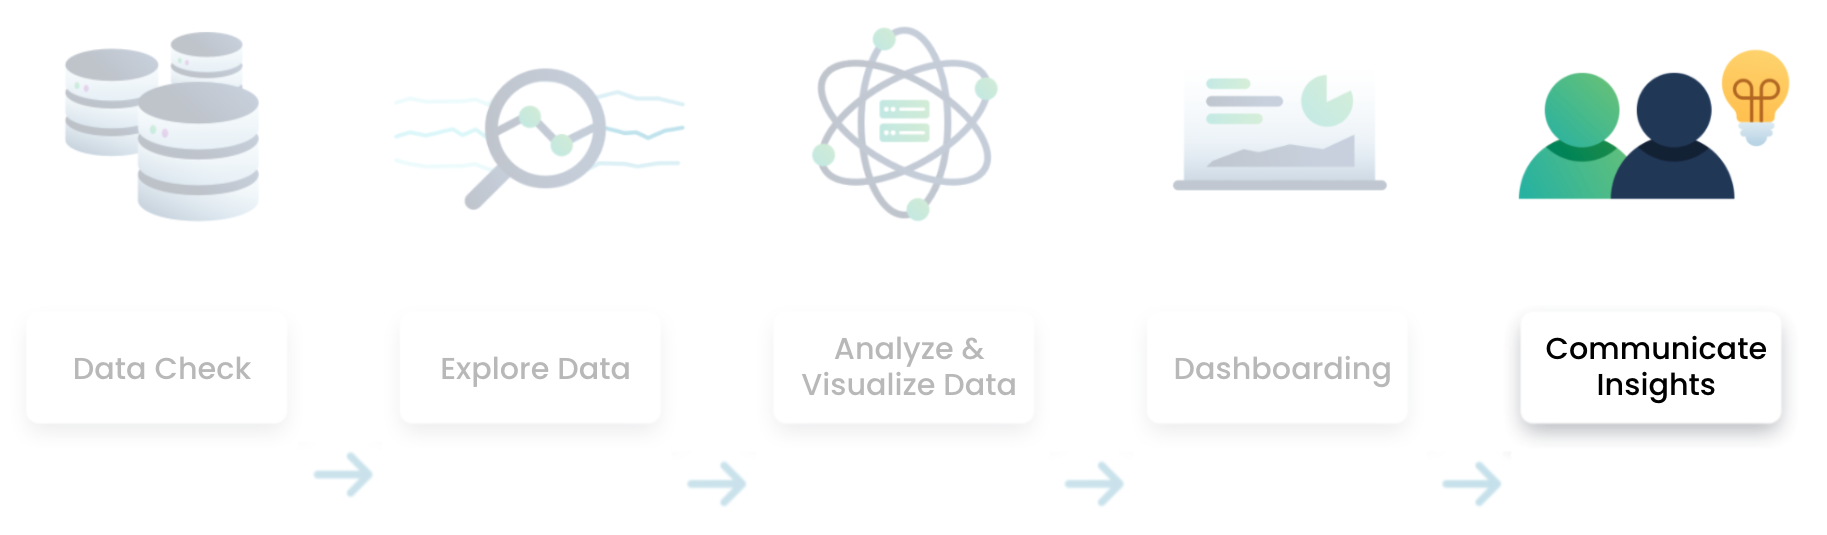
Fluxo de análise de dados no Power BI
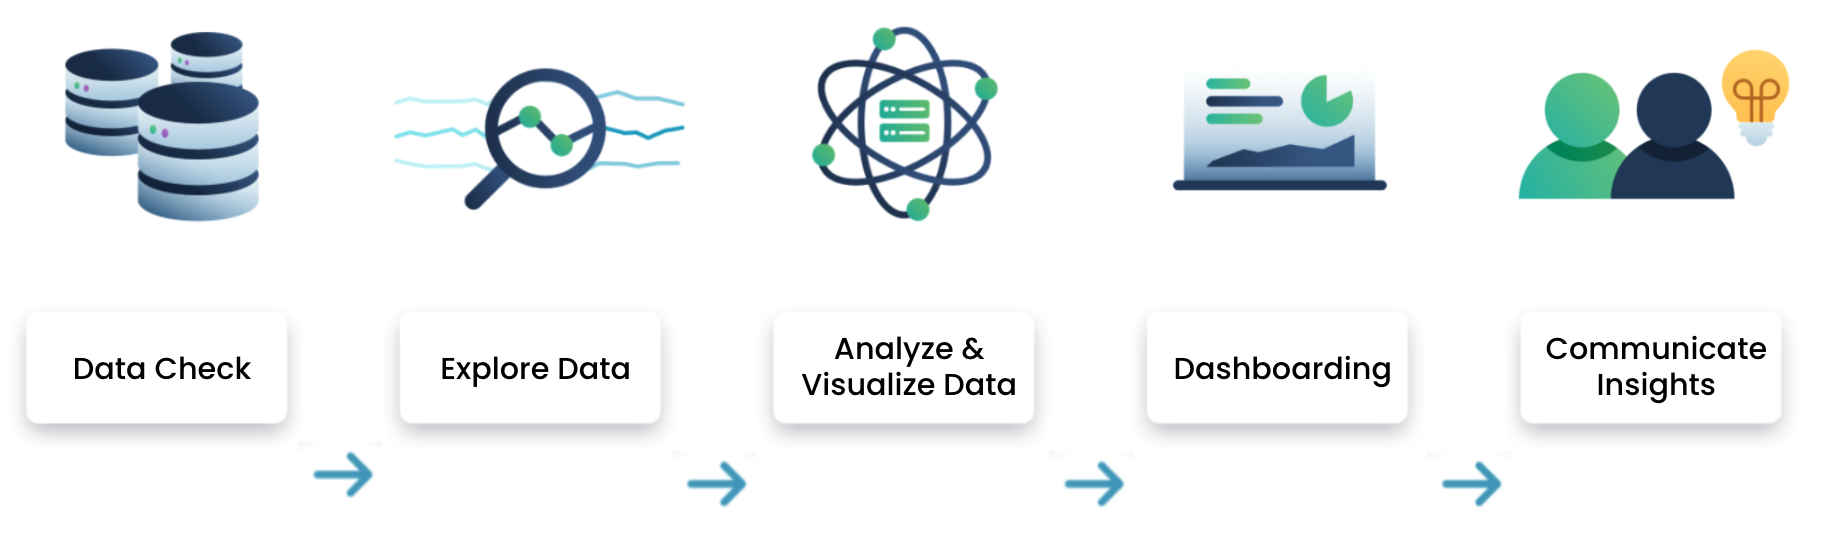
Fluxo de análise de dados no Power BI
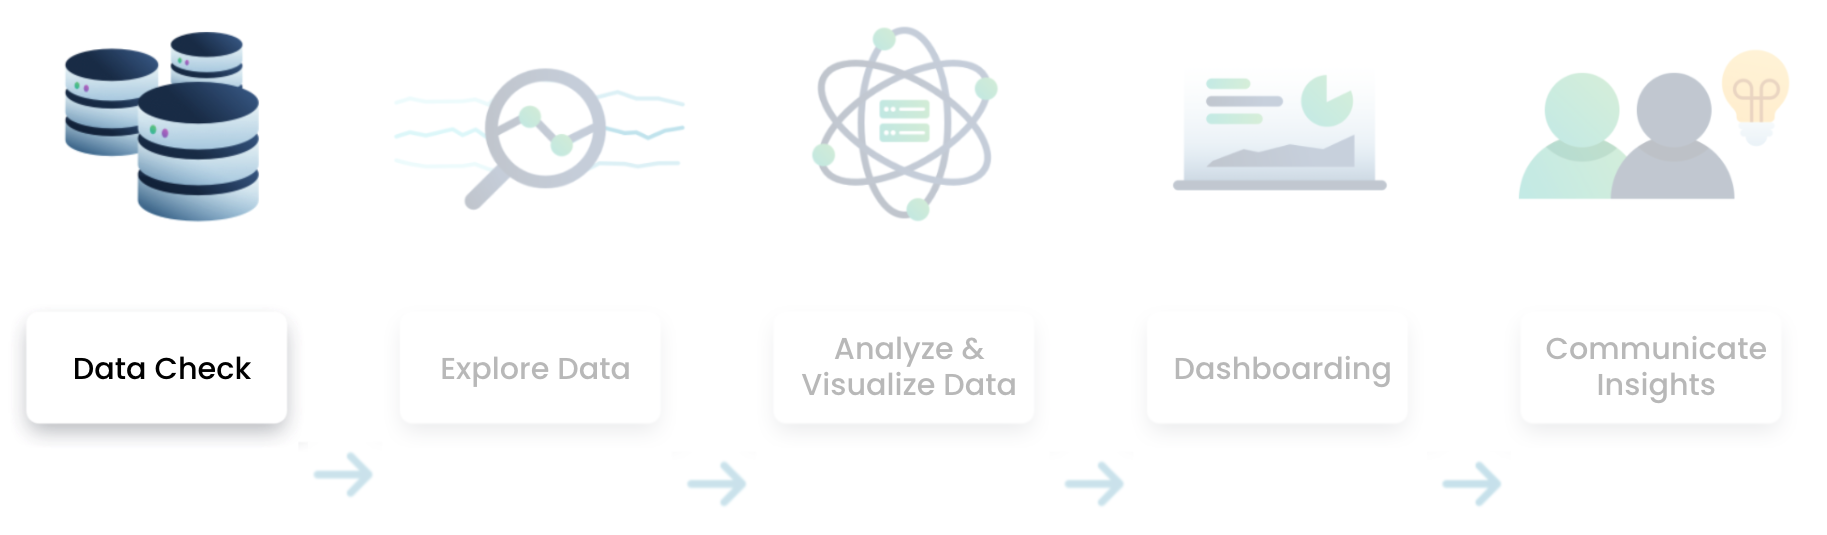
Fluxo de análise de dados no Power BI
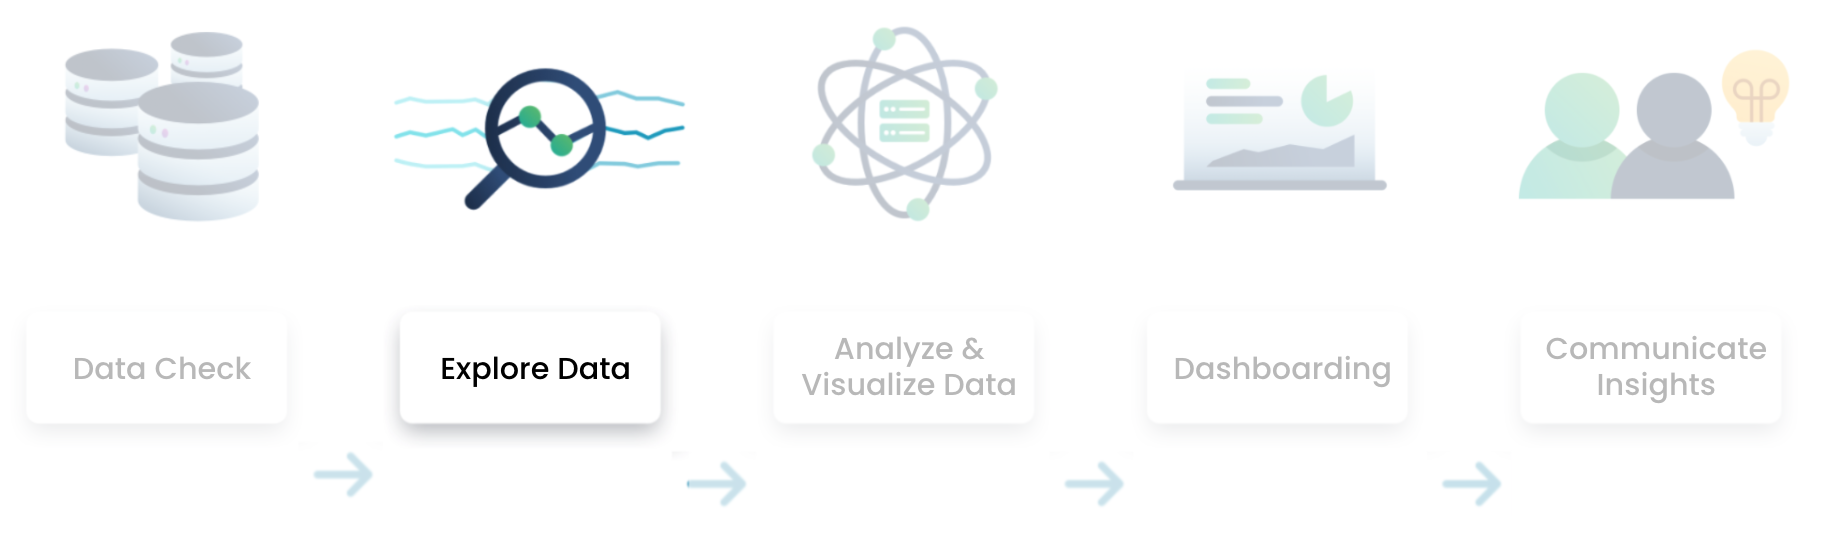
Fluxo de análise de dados no Power BI
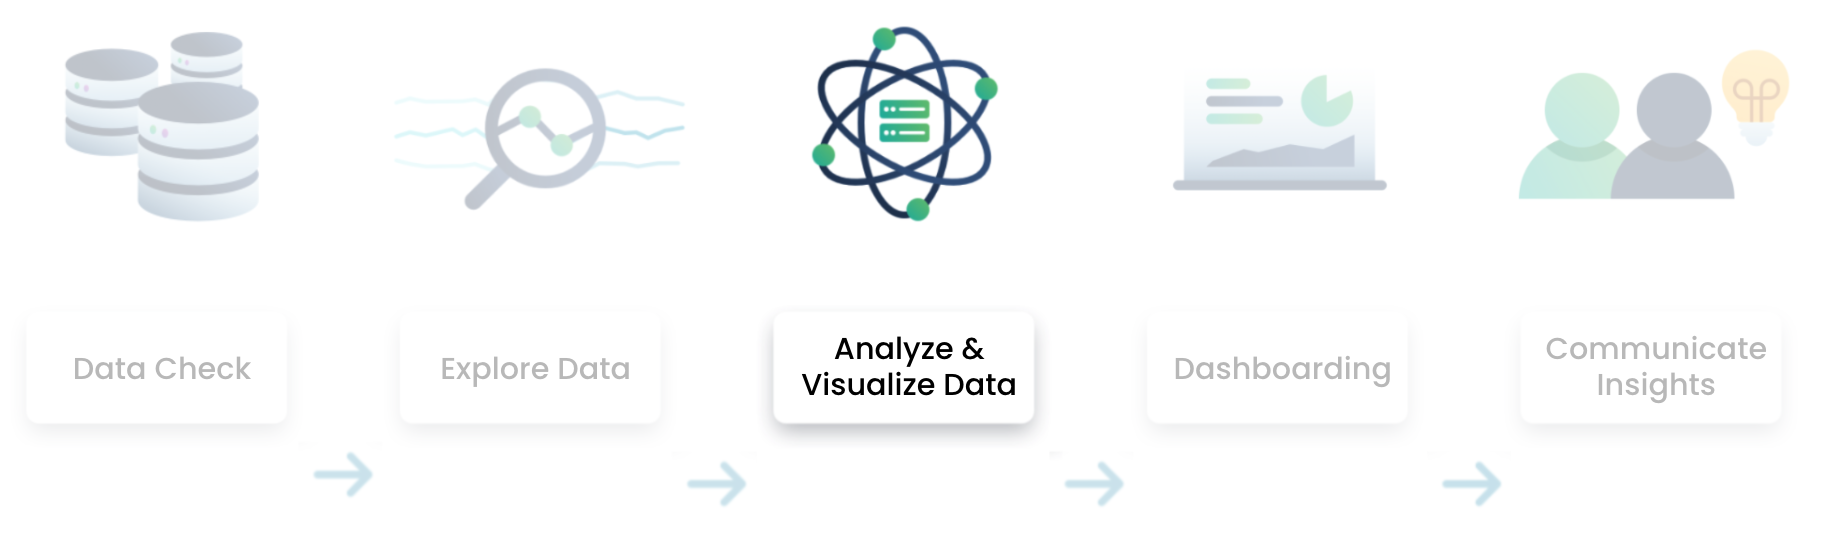
Fluxo de análise de dados no Power BI
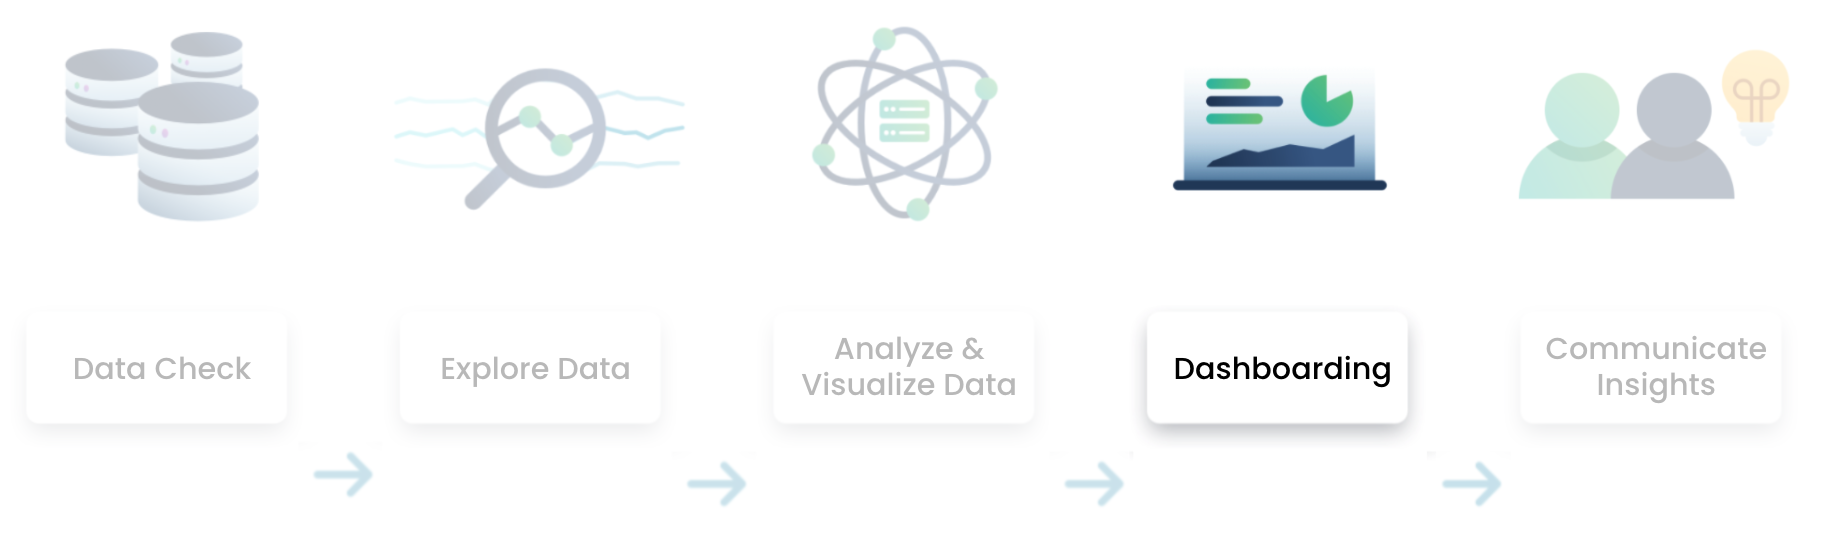
Fluxo de análise de dados no Power BI
O problema
$$

Definição de rotatividade

1 https://www.investopedia.com/terms/c/churnrate.asp
Os dados