Panorama geral
Estudo de Caso: Analisando Churn de Clientes no Power BI

Iason Prassides
Content Developer, DataCamp
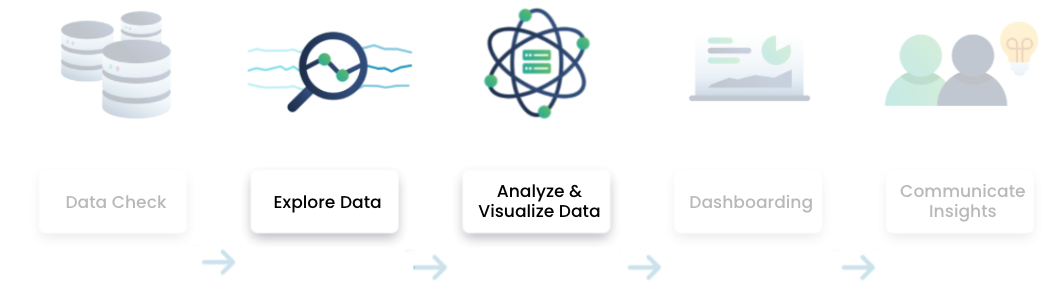
Fluxo de análise de dados
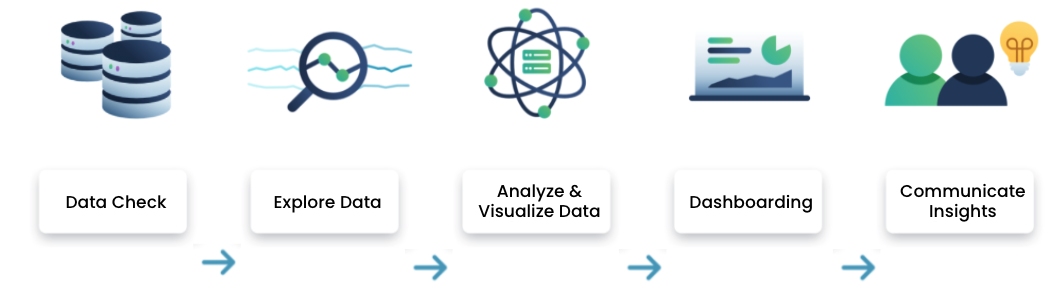
Fluxo de análise de dados
Conclusões até agora
- A taxa de rotatividade da Databel é de ~27%.
- Cerca de 45% dos motivos pelos quais os clientes deixam de ser clientes têm a ver com a concorrência.
- A taxa de rotatividade na Califórnia está superalta (>60%).

Tem muitas coisas que a gente ainda não sabe
- Início imediato da análise, sem elaboração de um plano.
- Muitas colunas (mais de 20 das 29) ainda não foram exploradas.