Modificação das estéticas
Introdução à visualização de dados com ggplot2

Rick Scavetta
Founder, Scavetta Academy
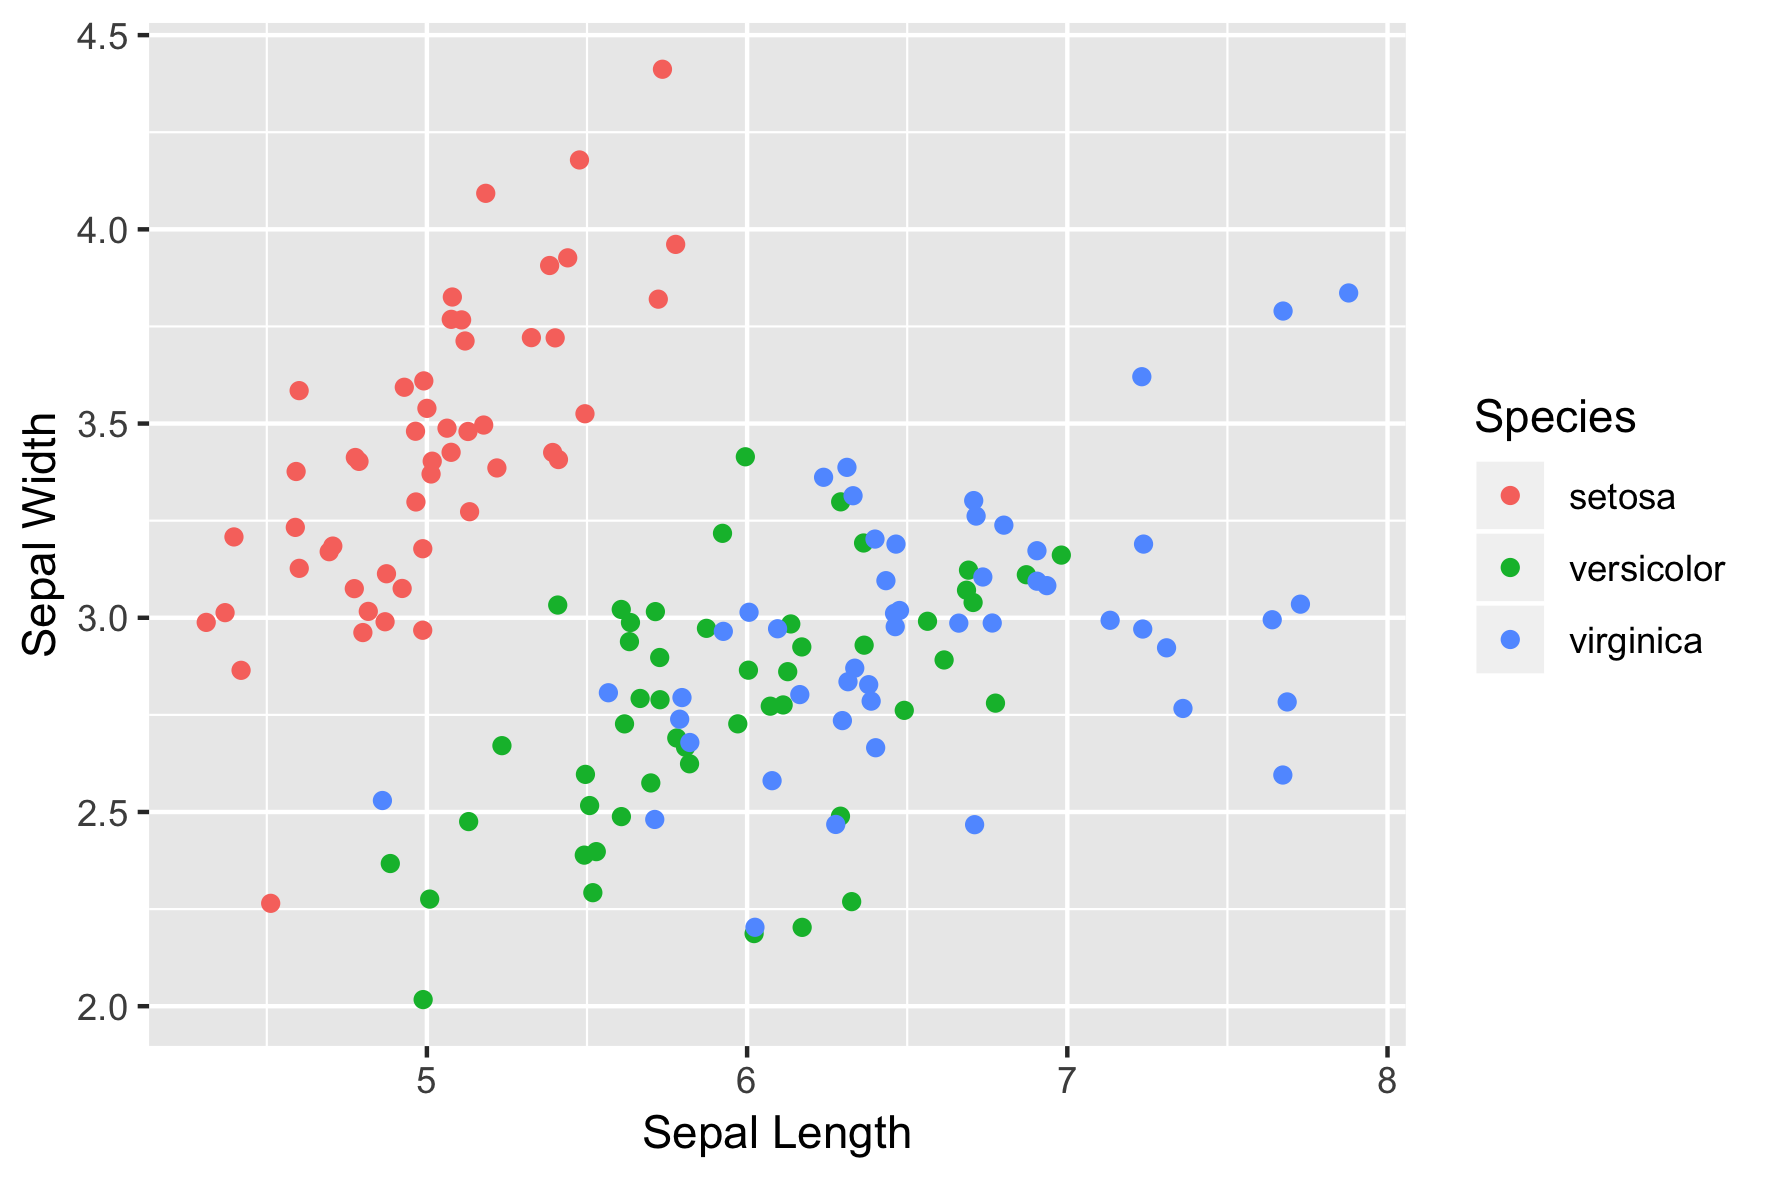
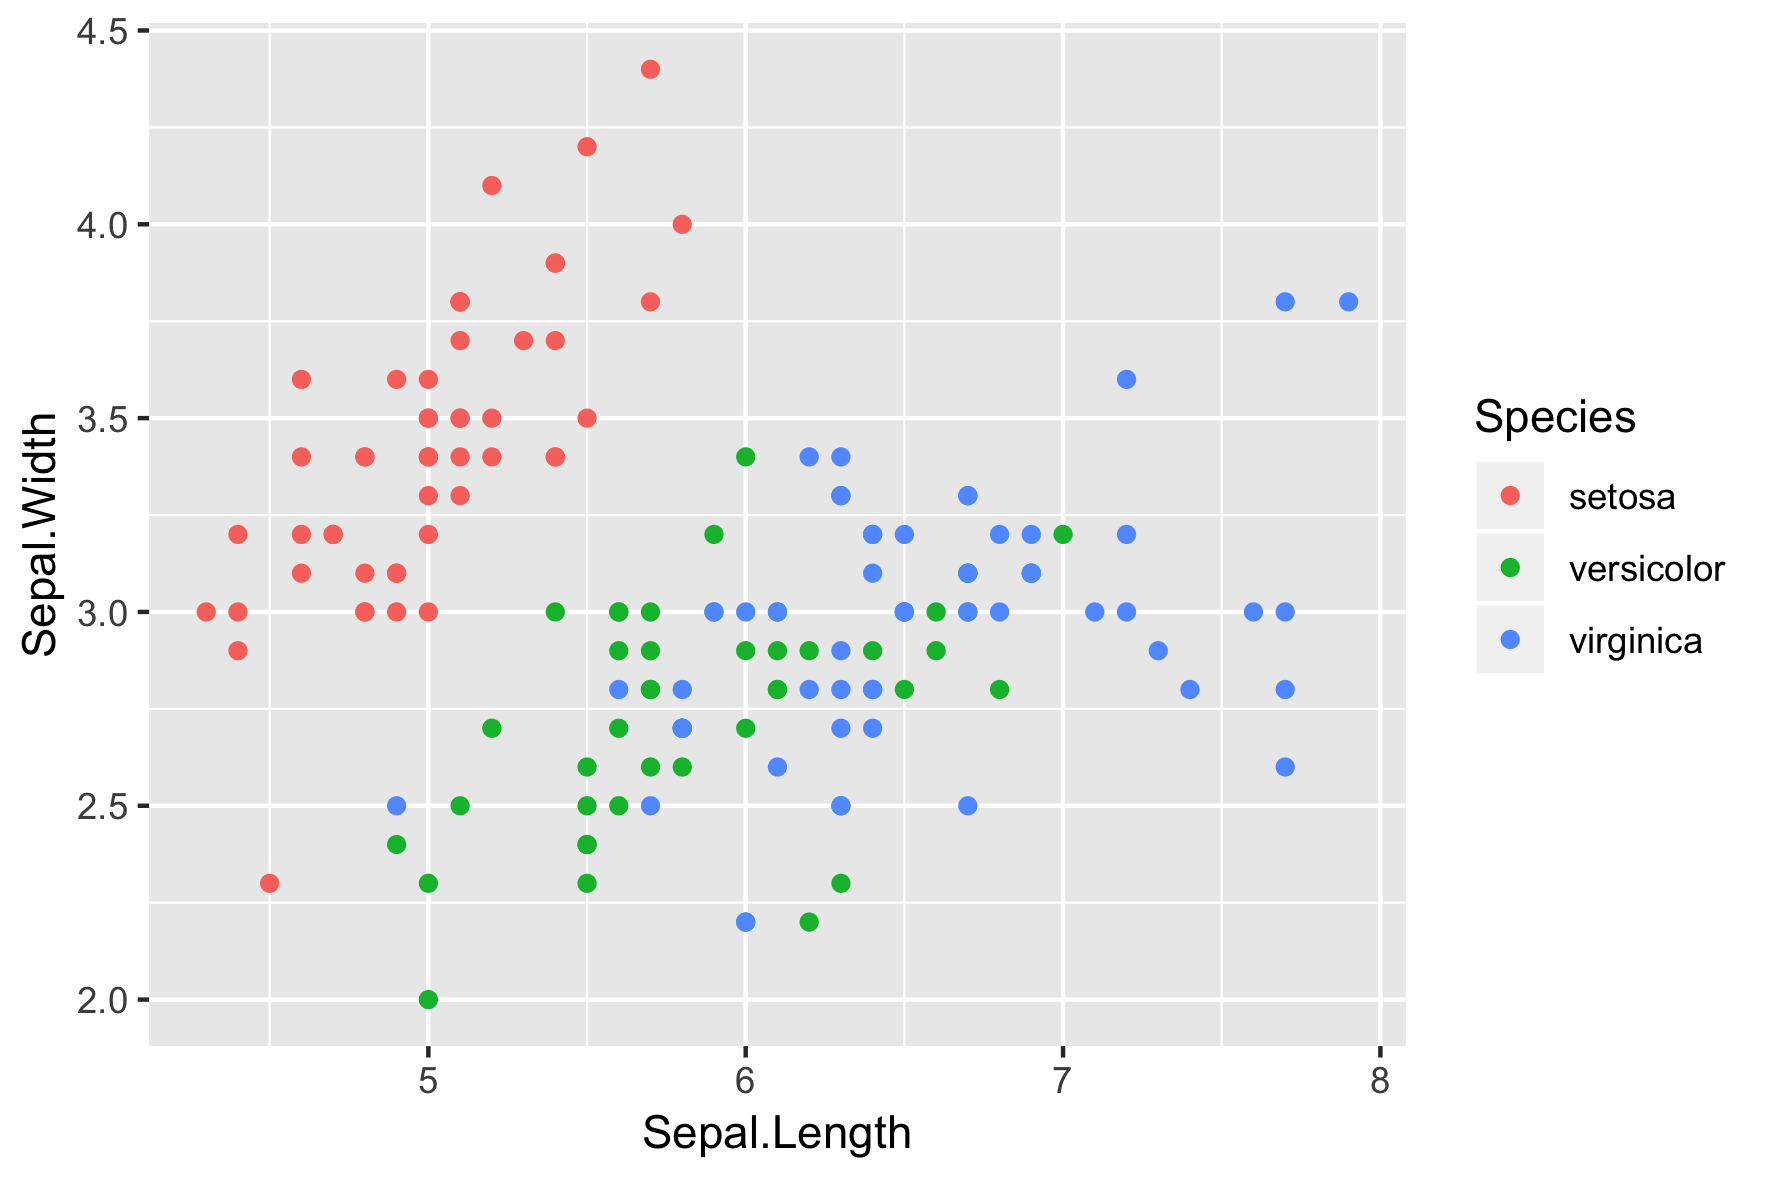
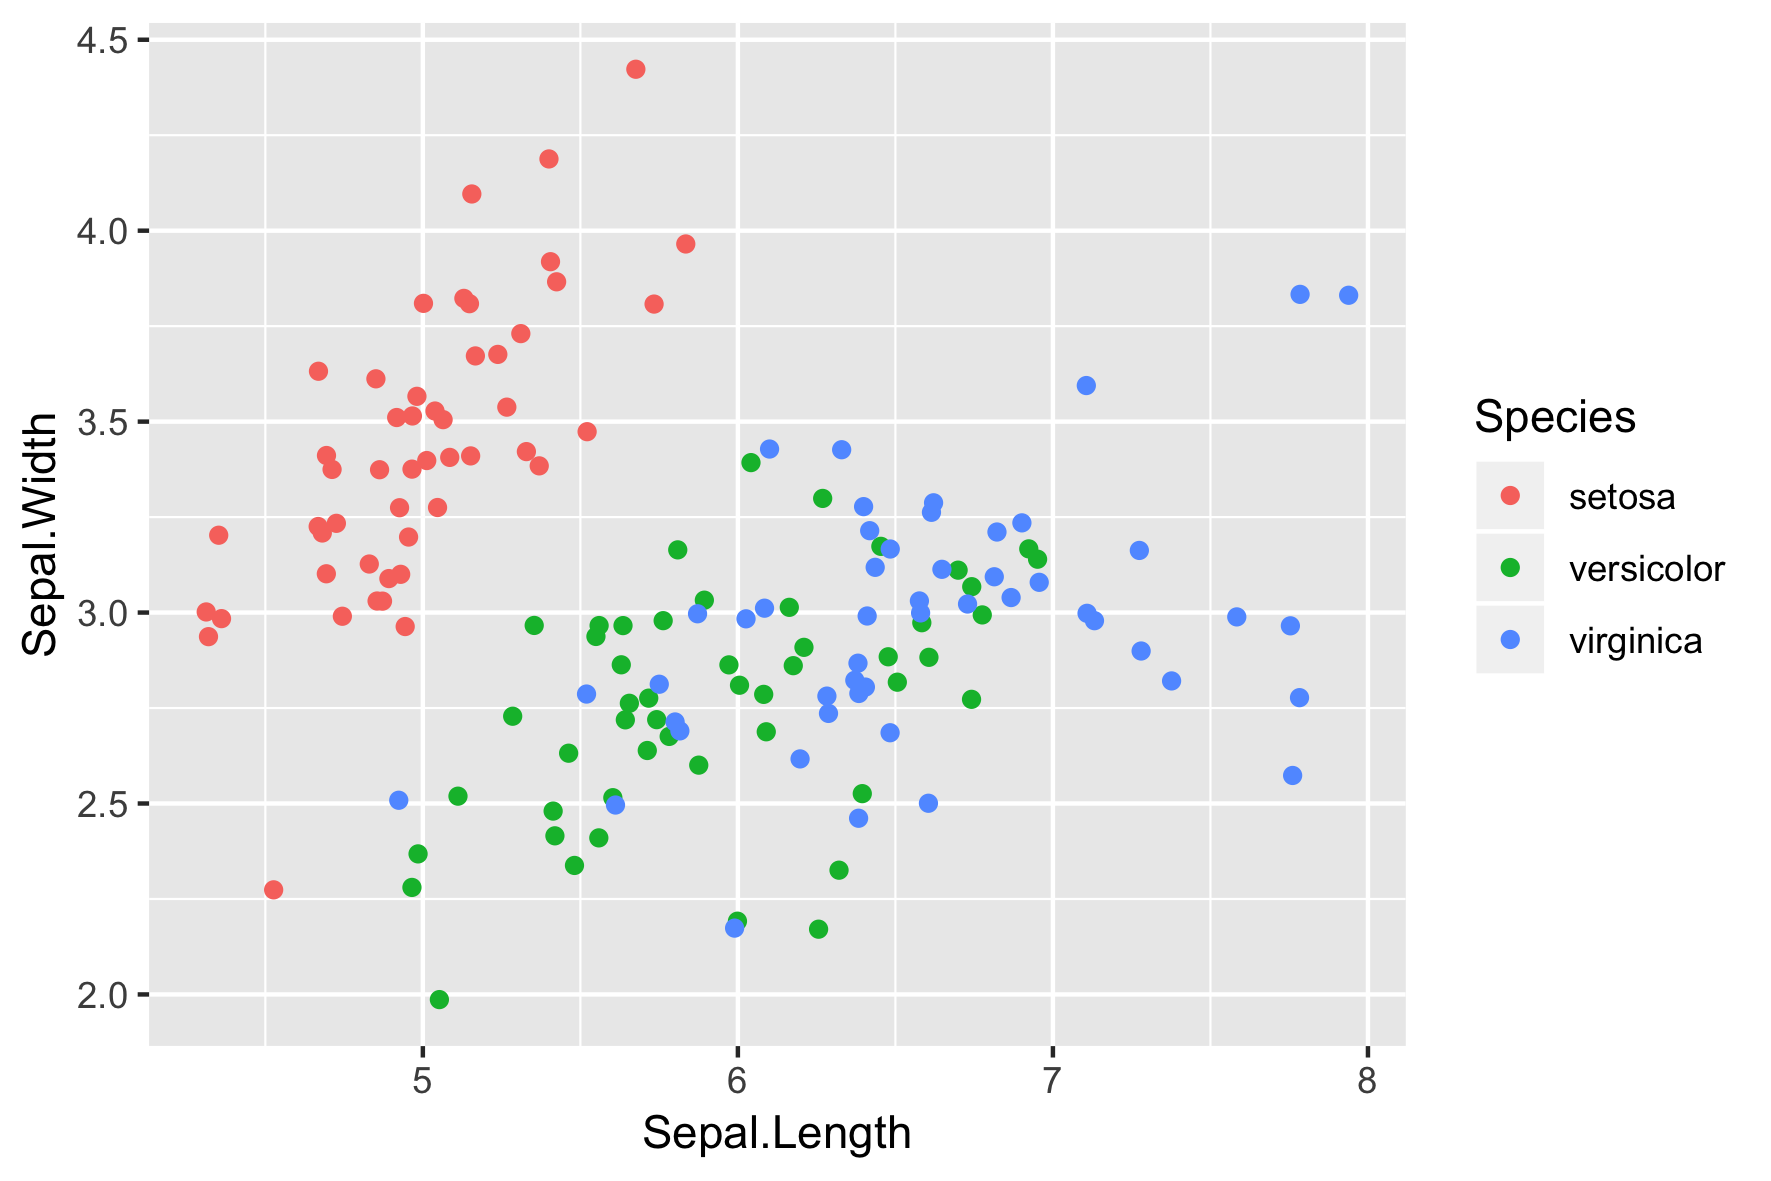
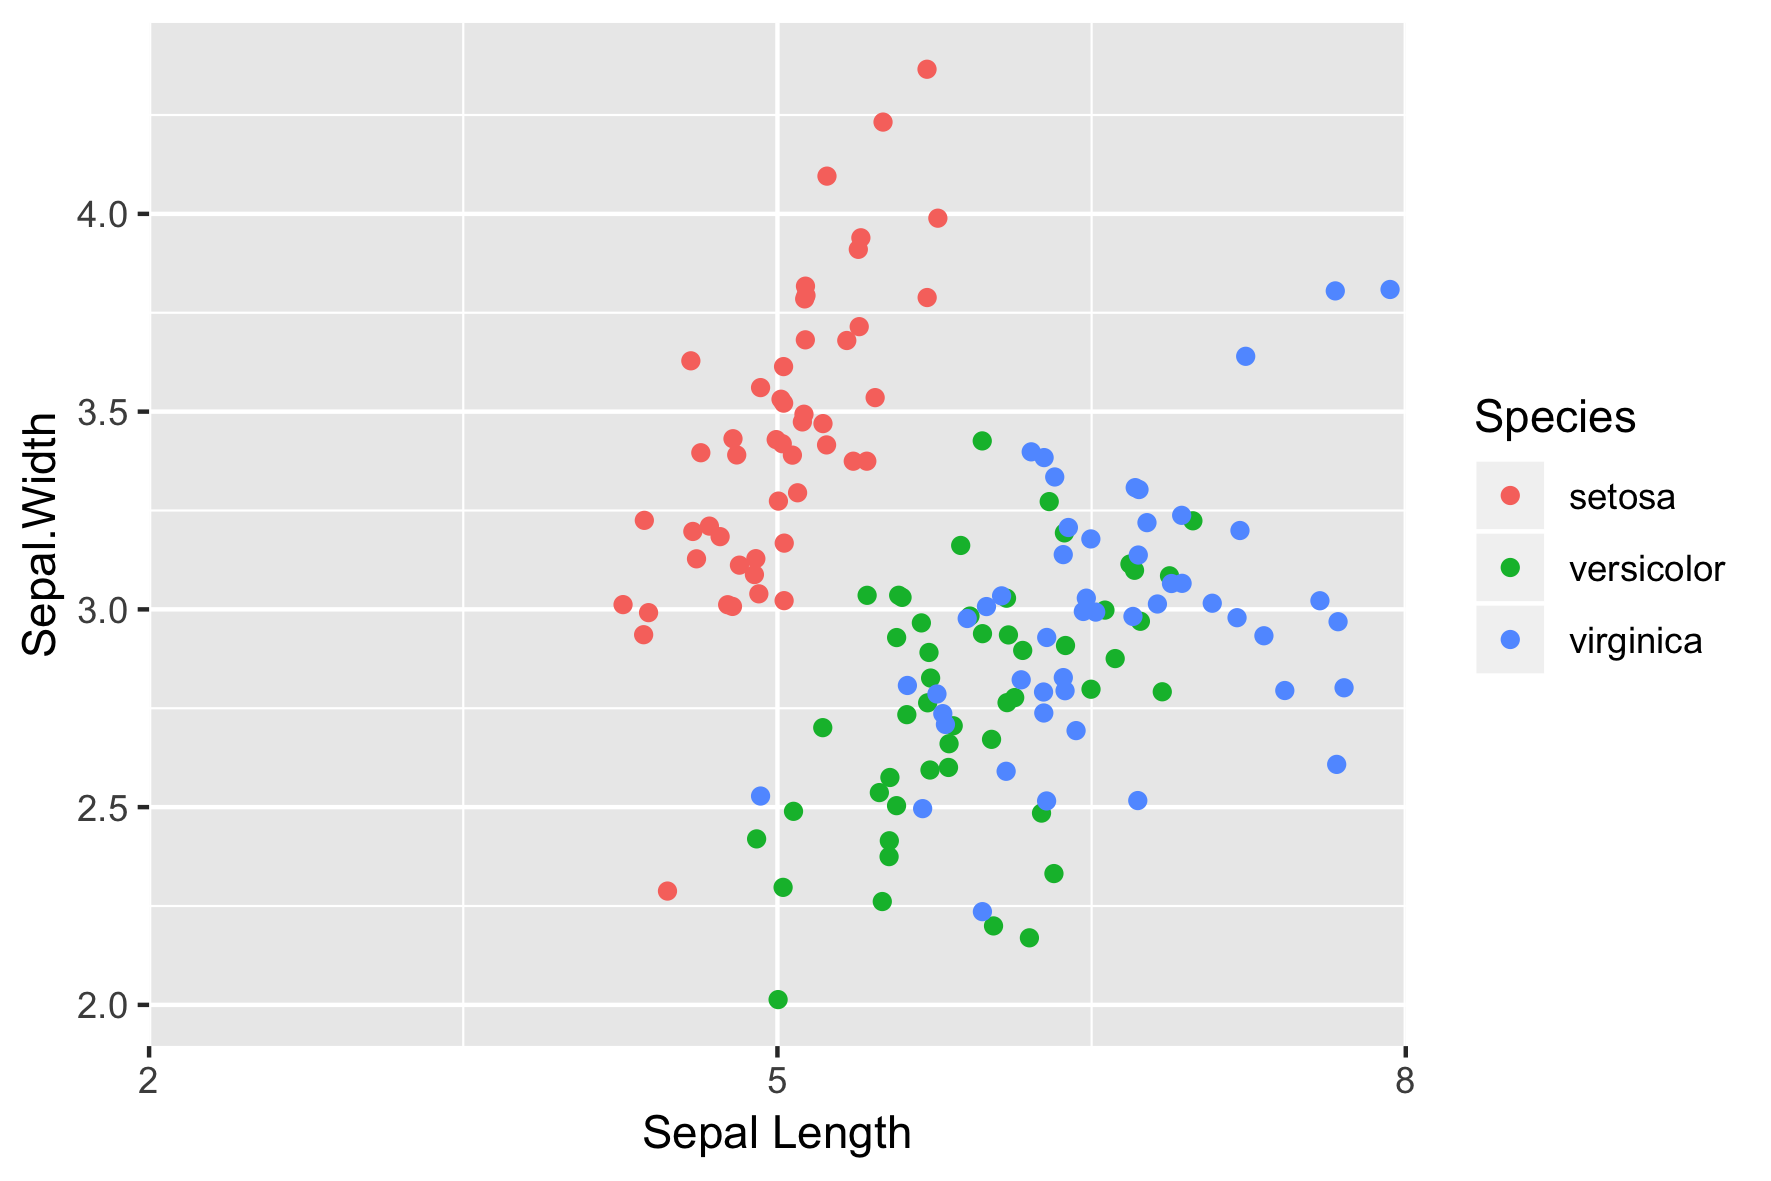
posição = "identidade" (padrão)

position = "identity" (default)
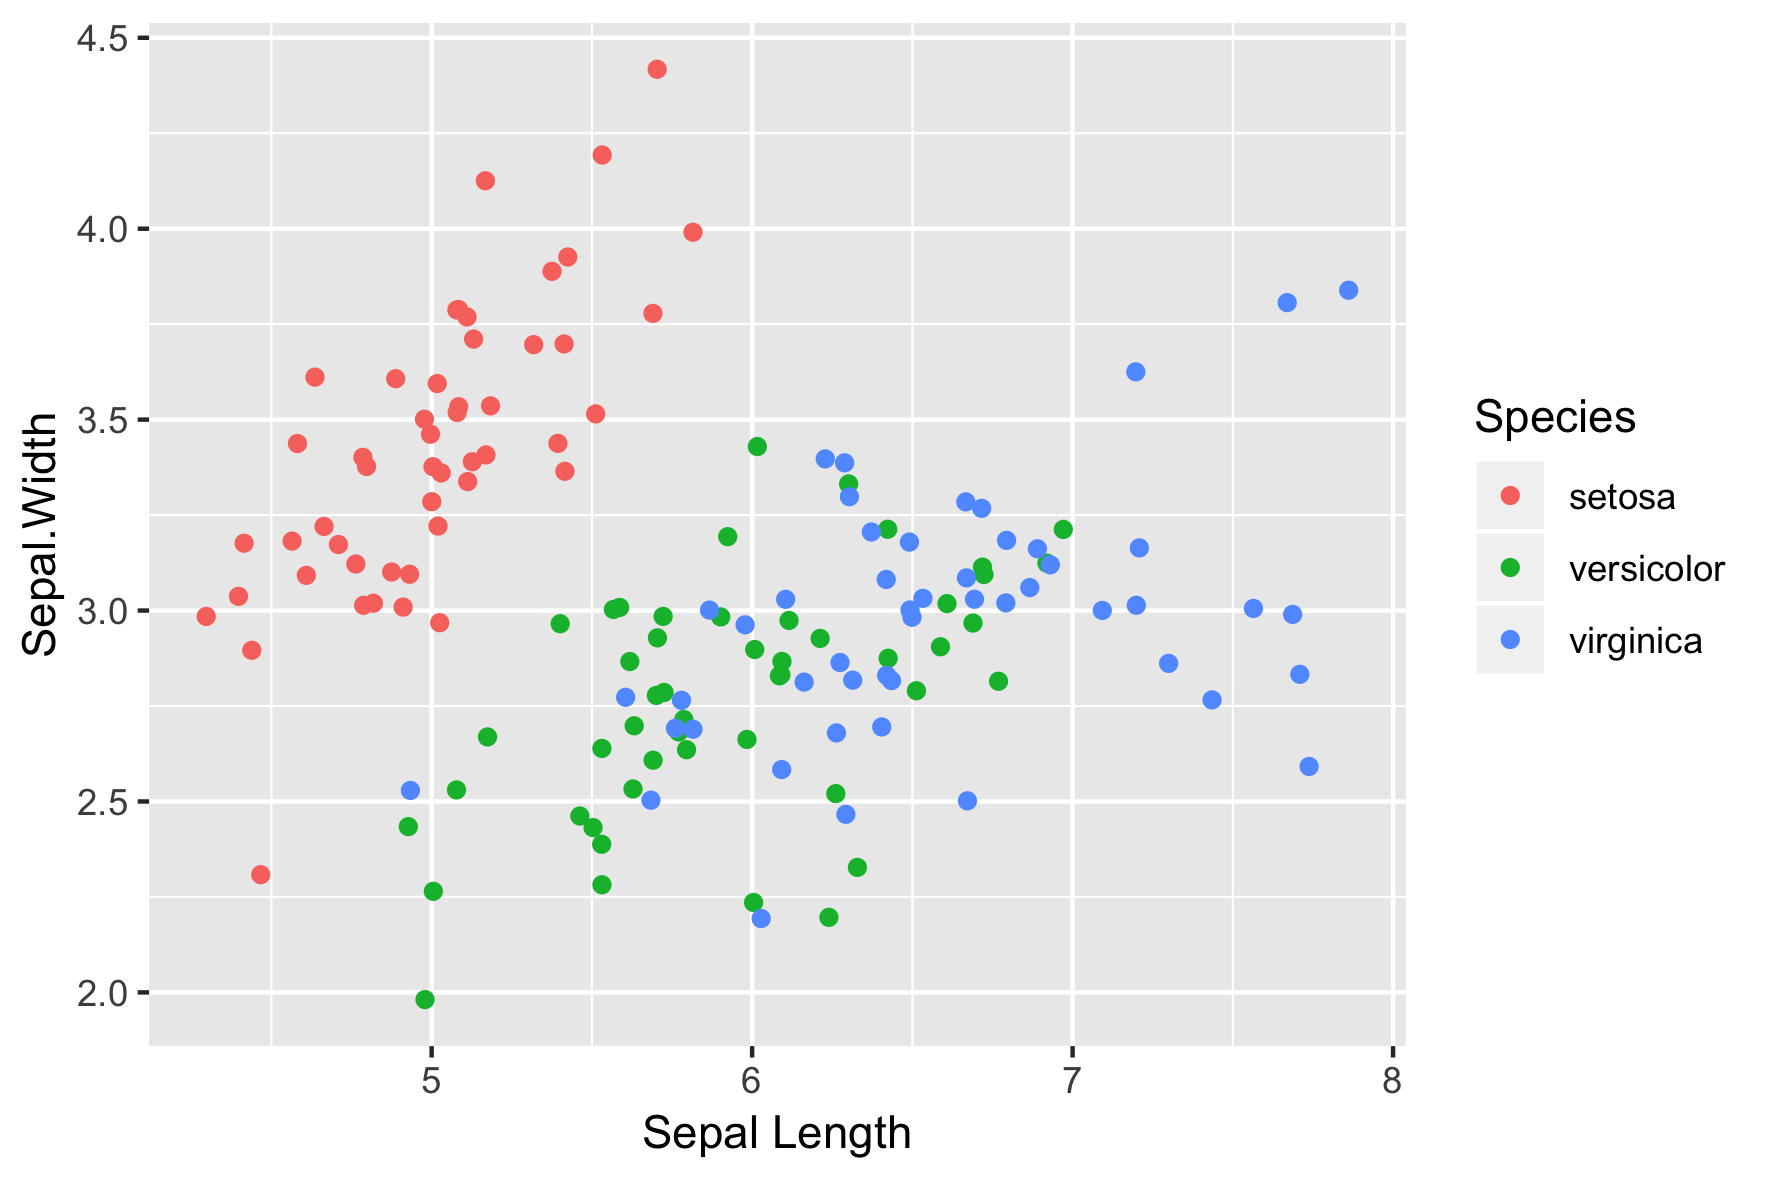
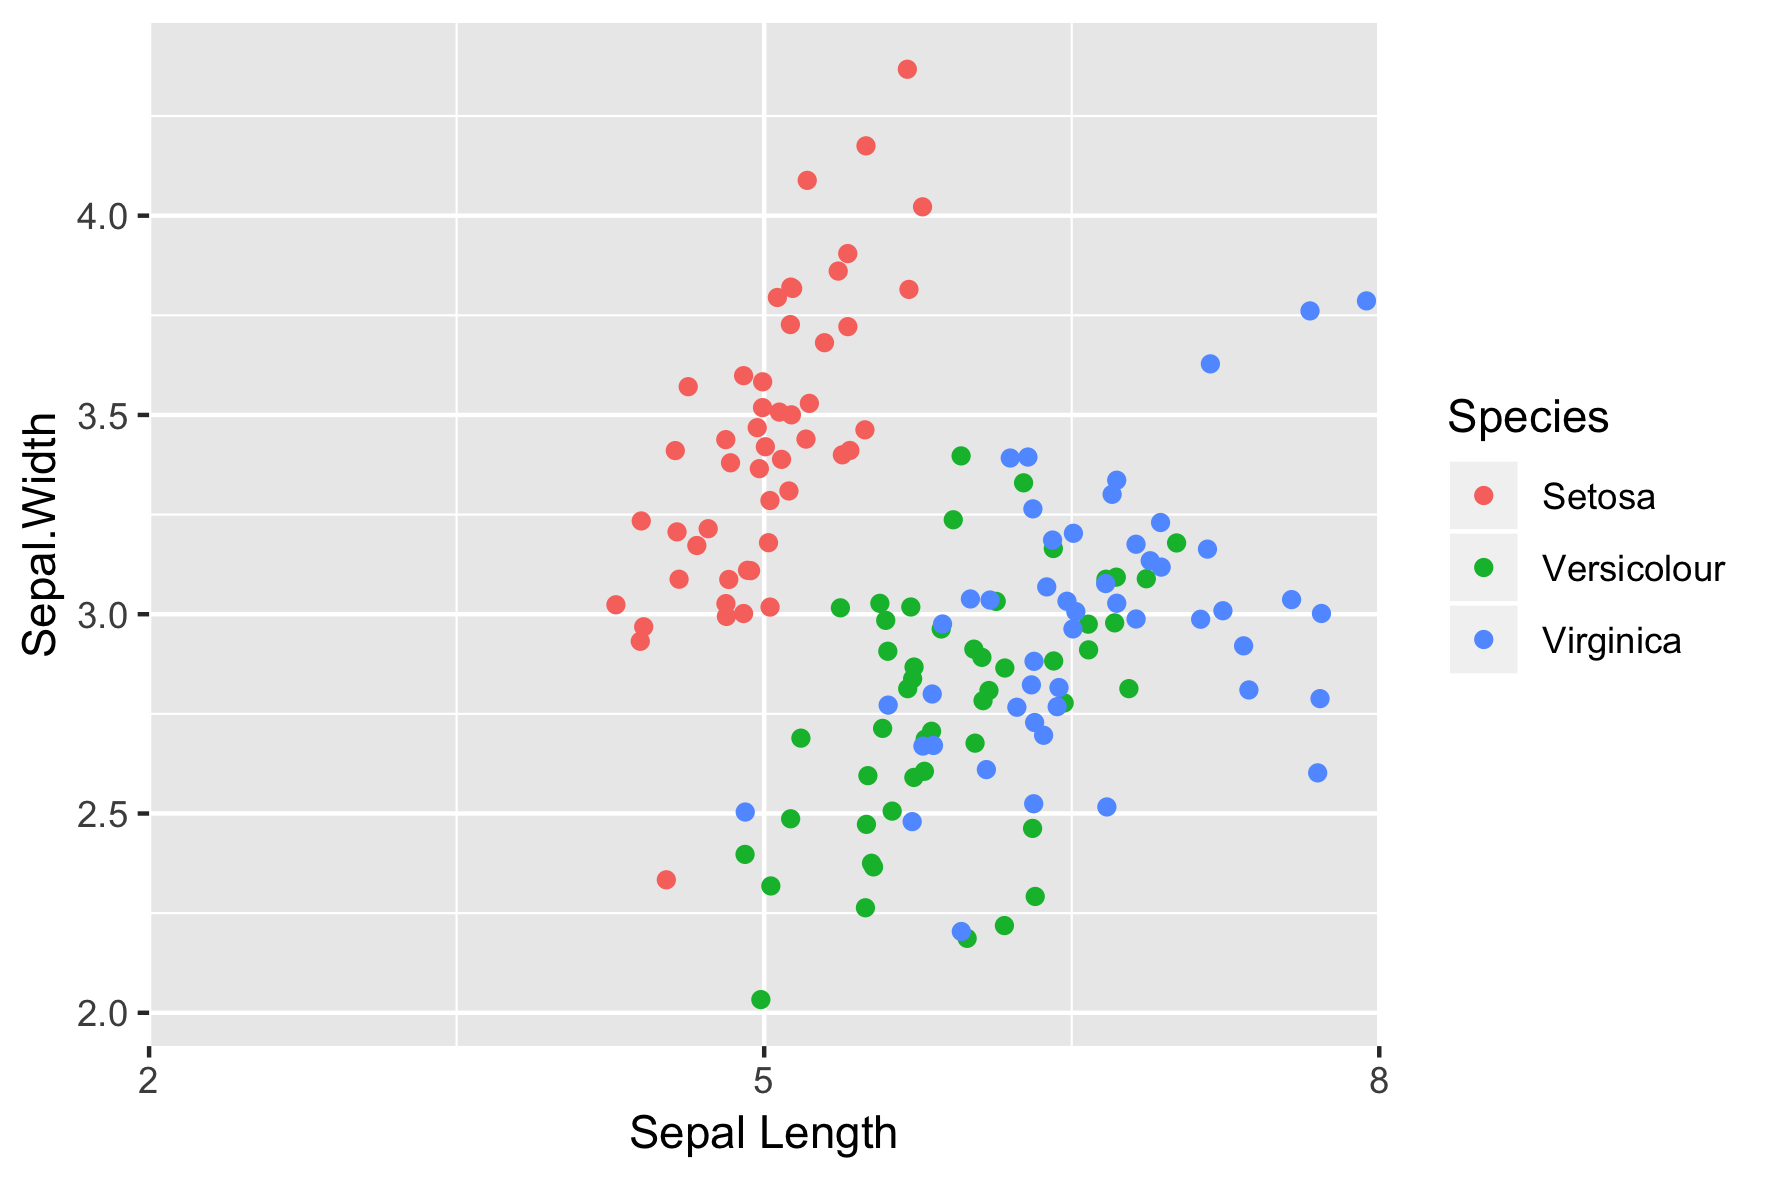
position = "jitter"
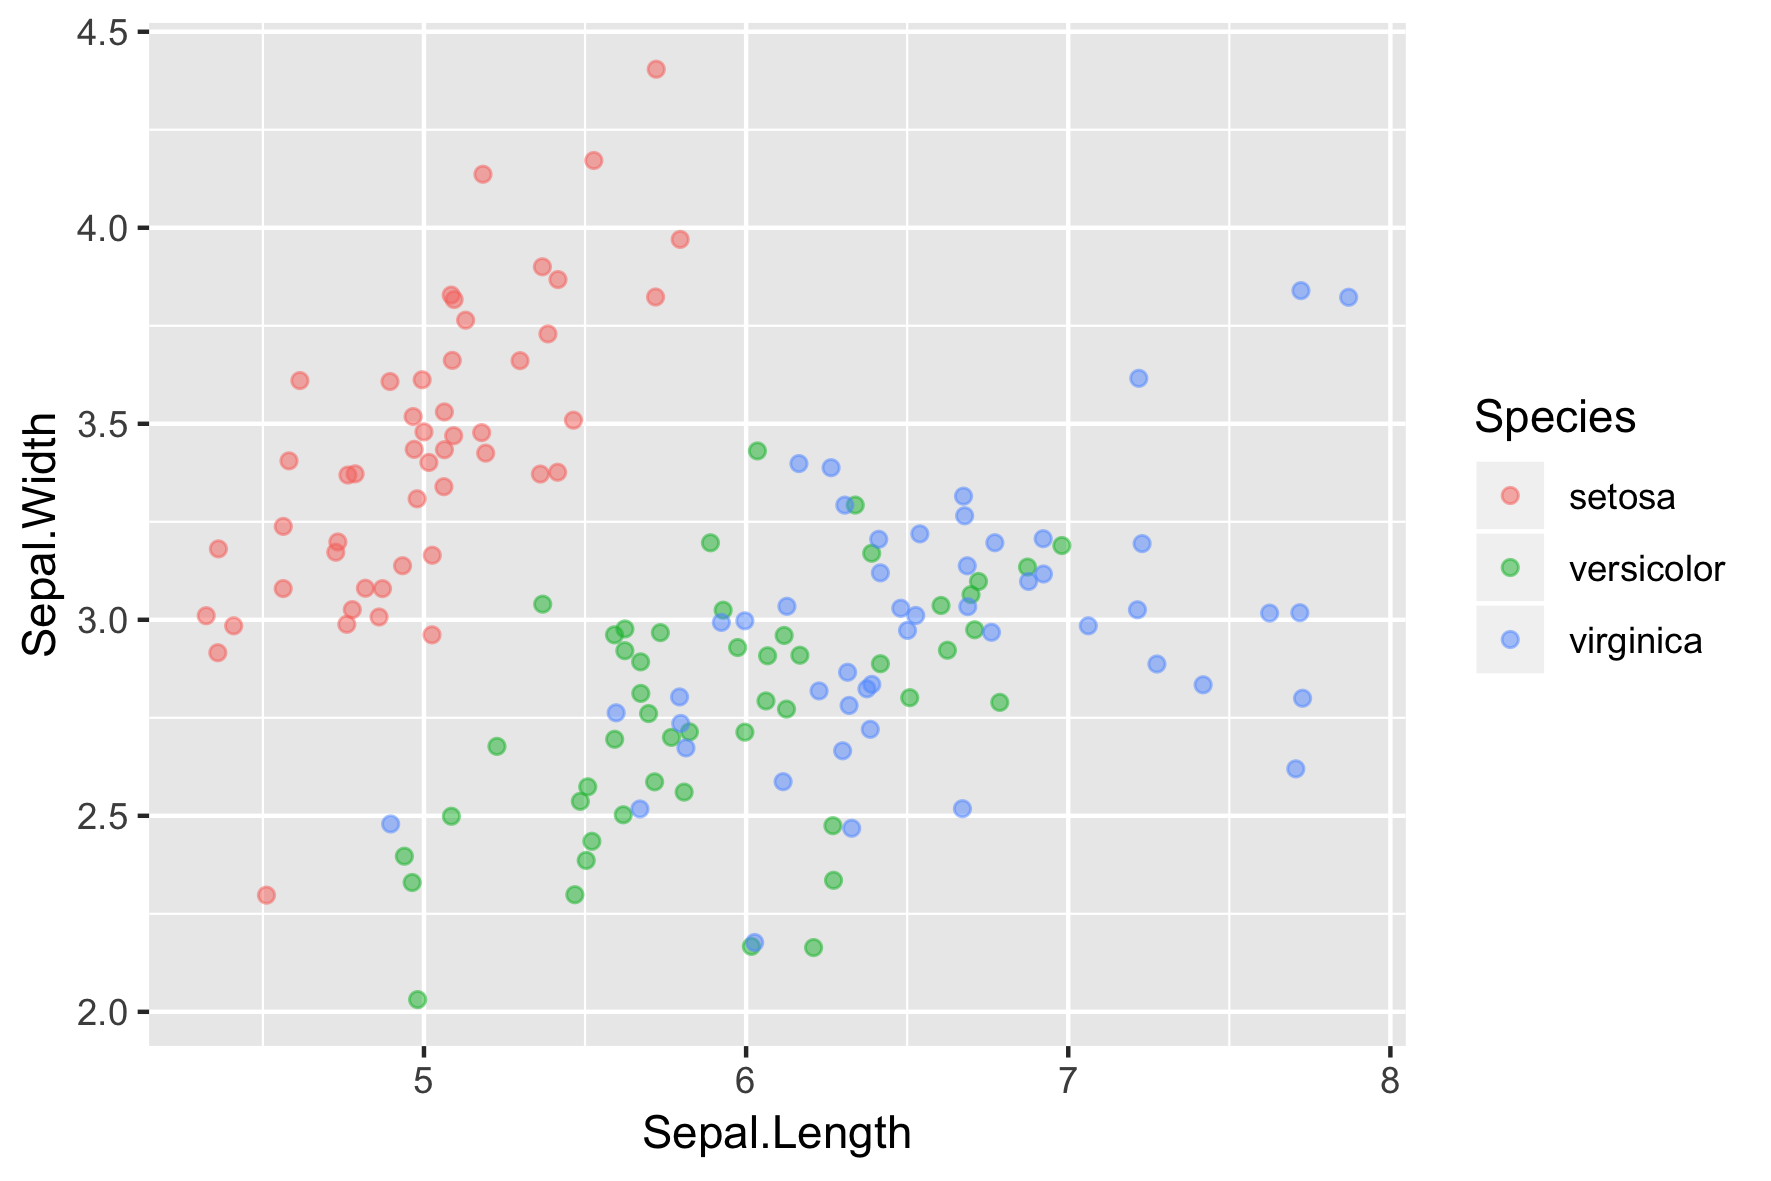
position_jitter()
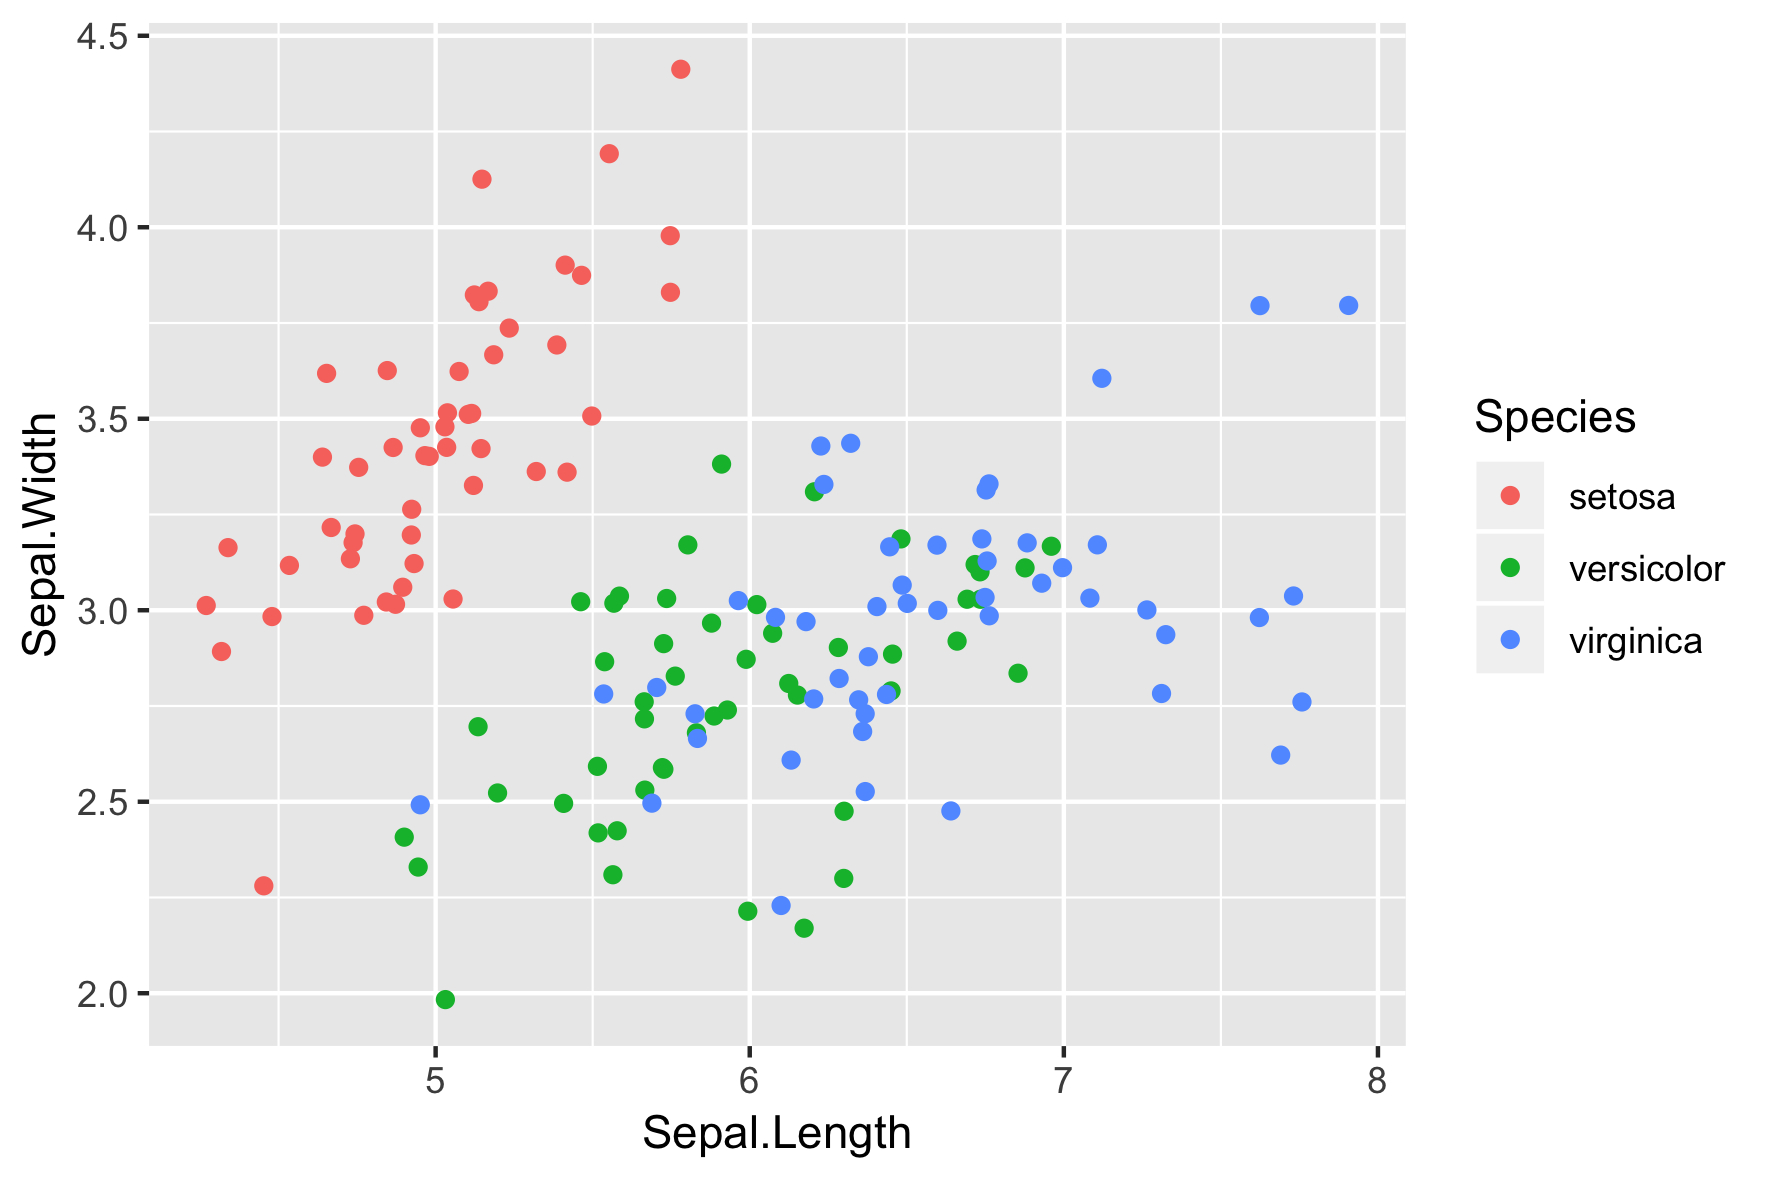
position_jitter()
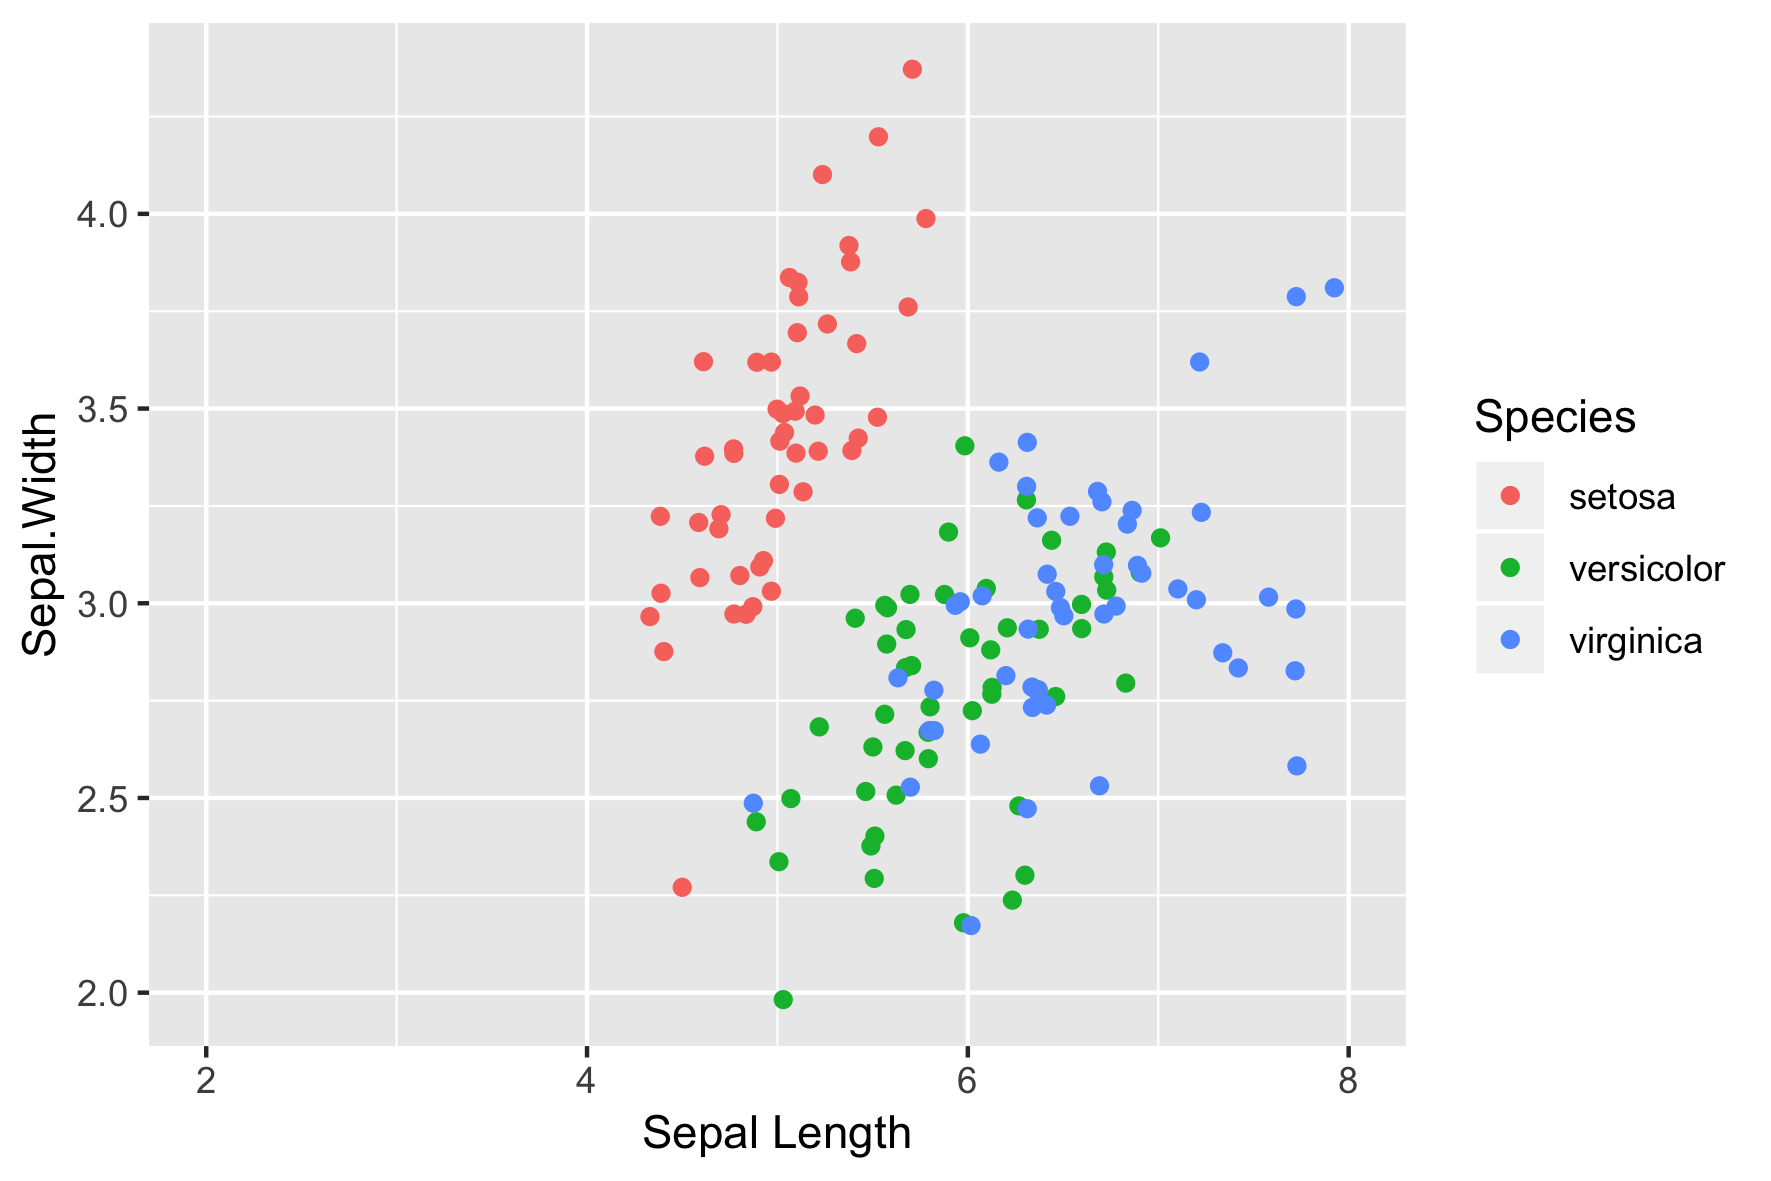
scale_*_*()
O argumento dos limites
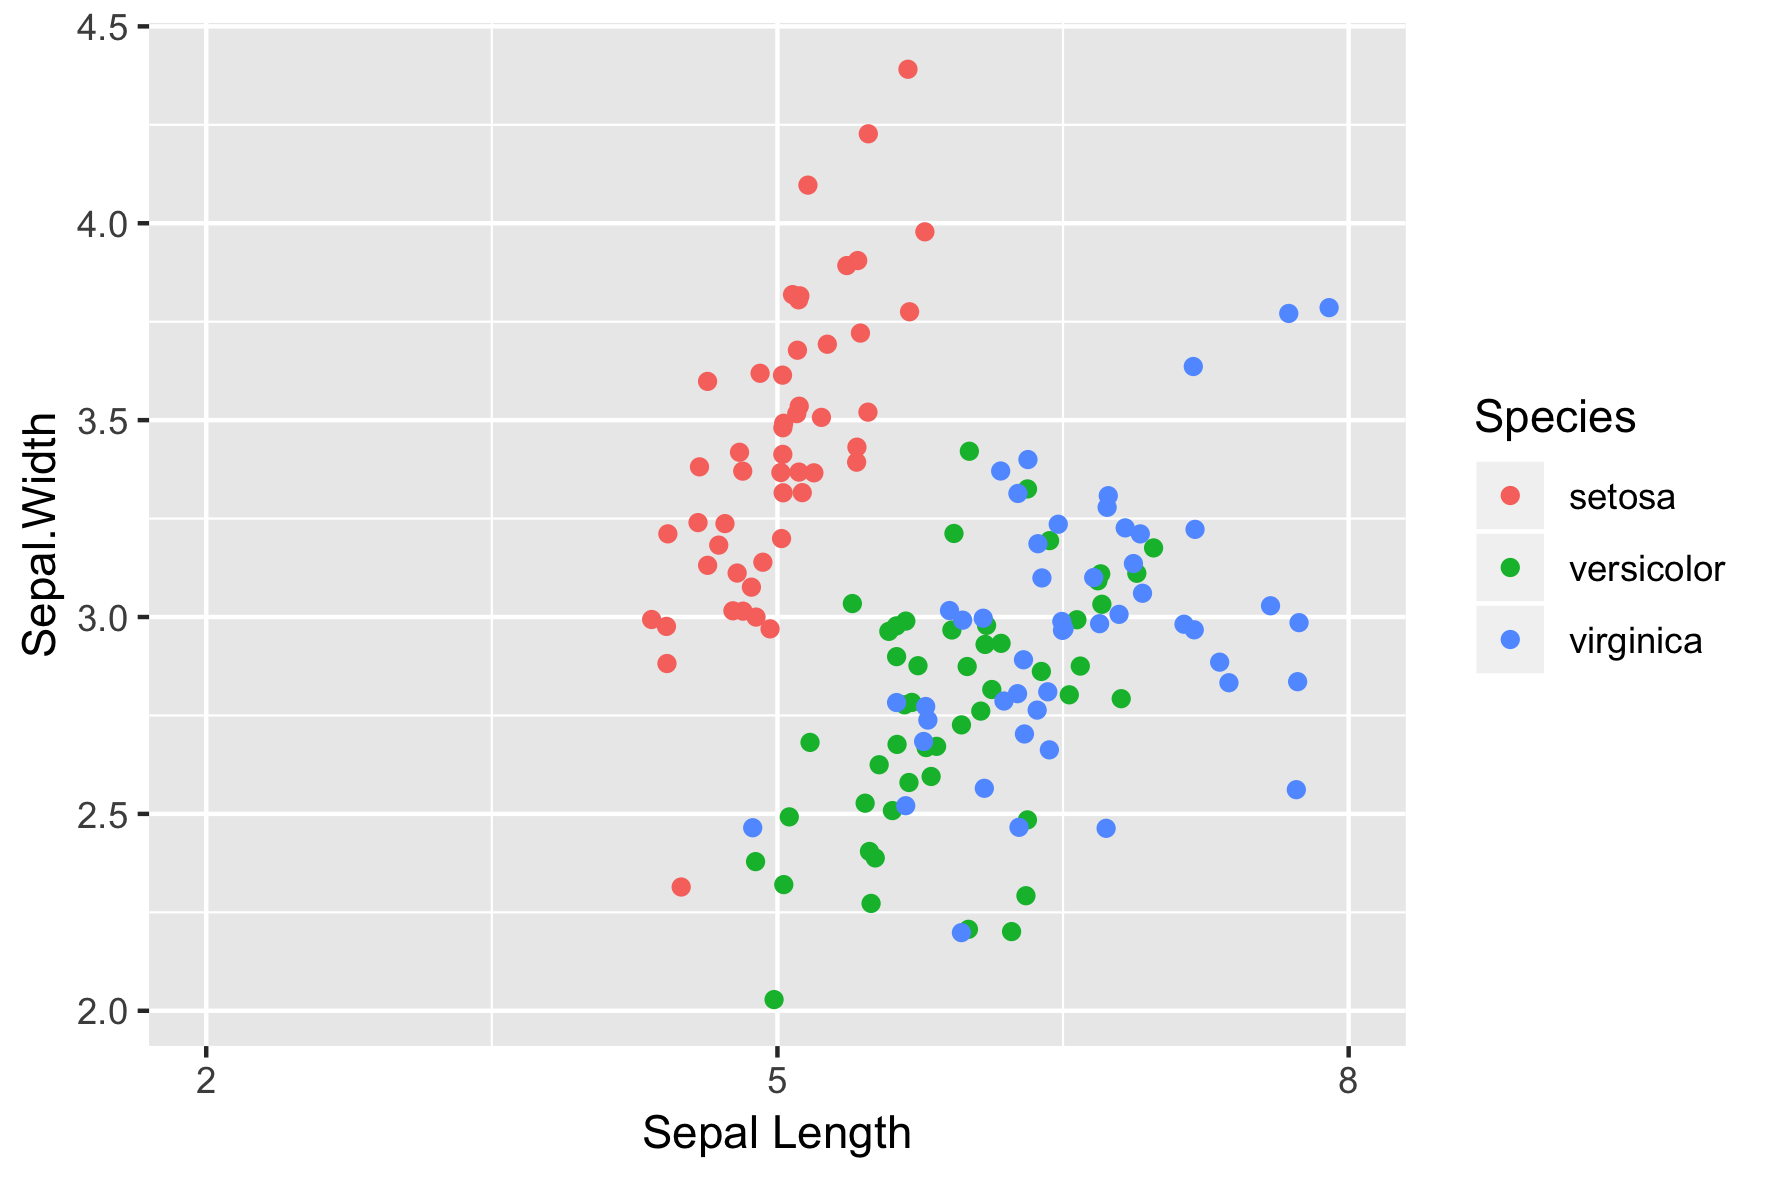
O argumento breaks
O argumento expand
O argumento labels
labs()