Práticas recomendadas de estéticas
Introdução à visualização de dados com ggplot2

Rick Scavetta
Founder, Scavetta Academy
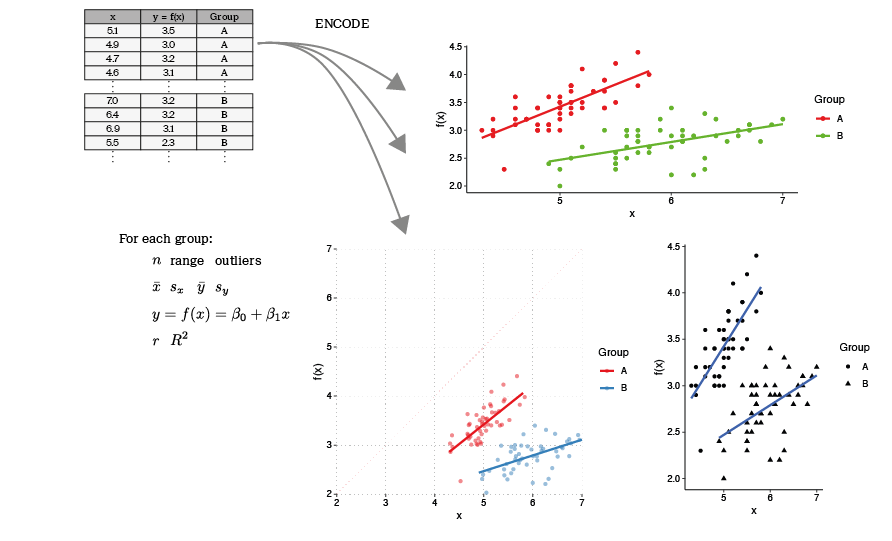
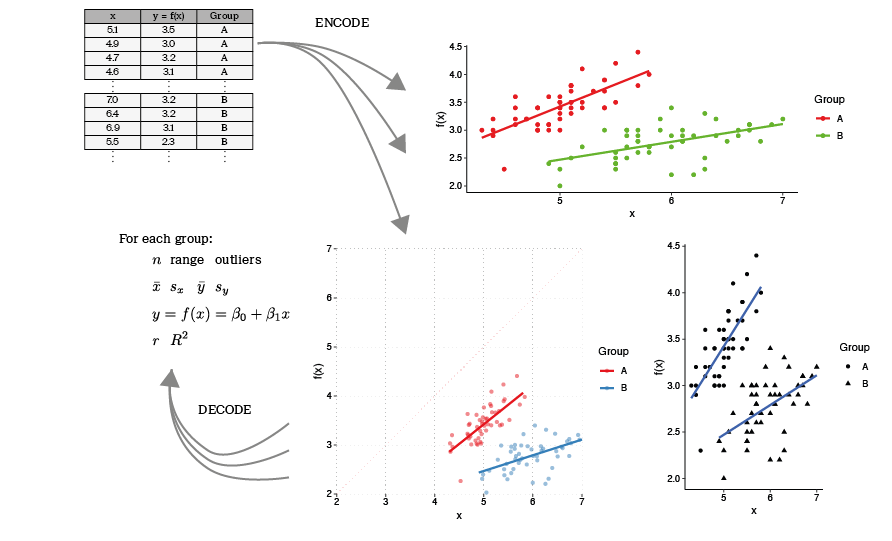
A forma segue a função
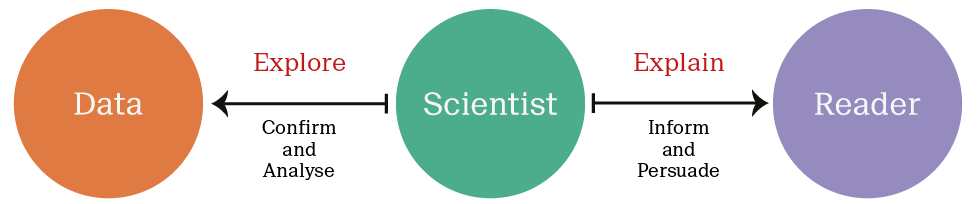
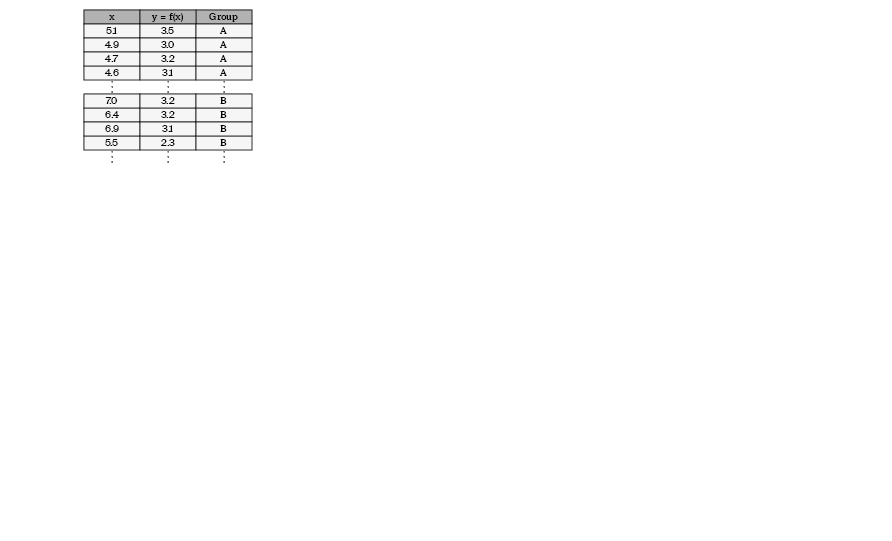

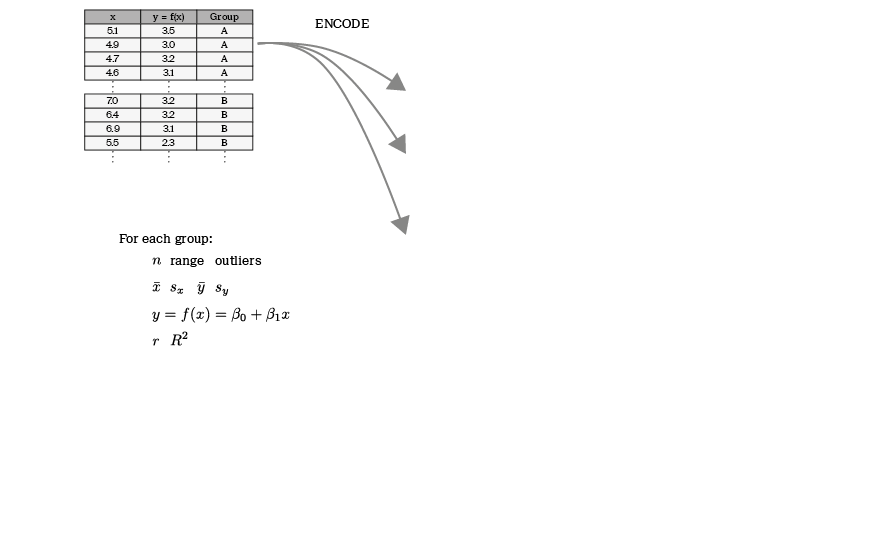
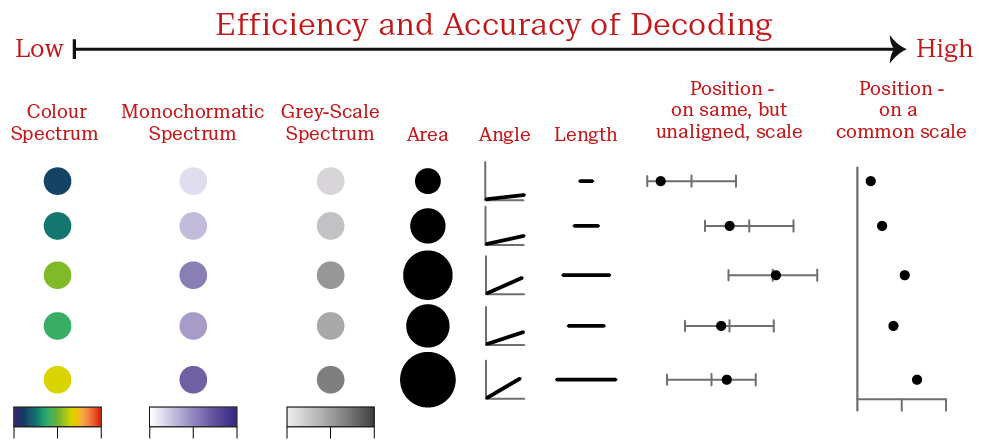
Extração de informações dos dados

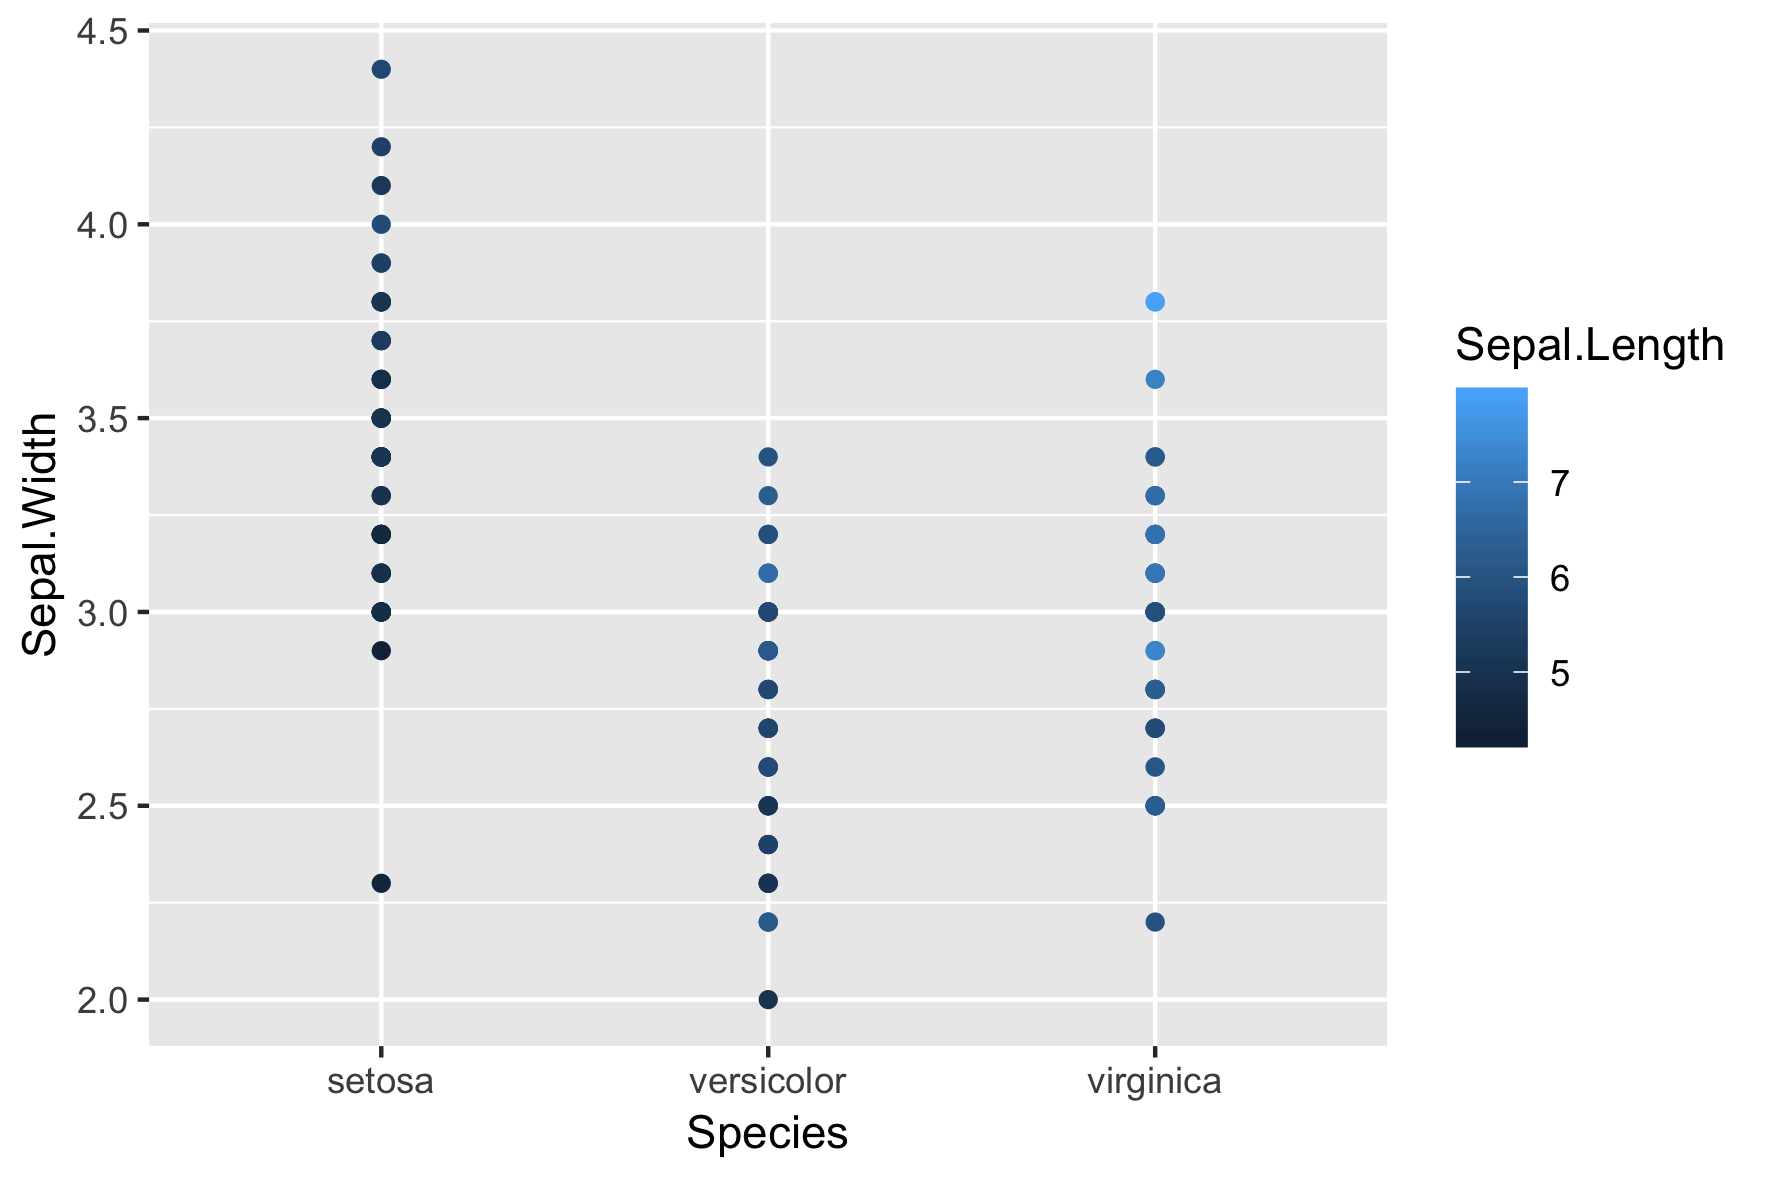
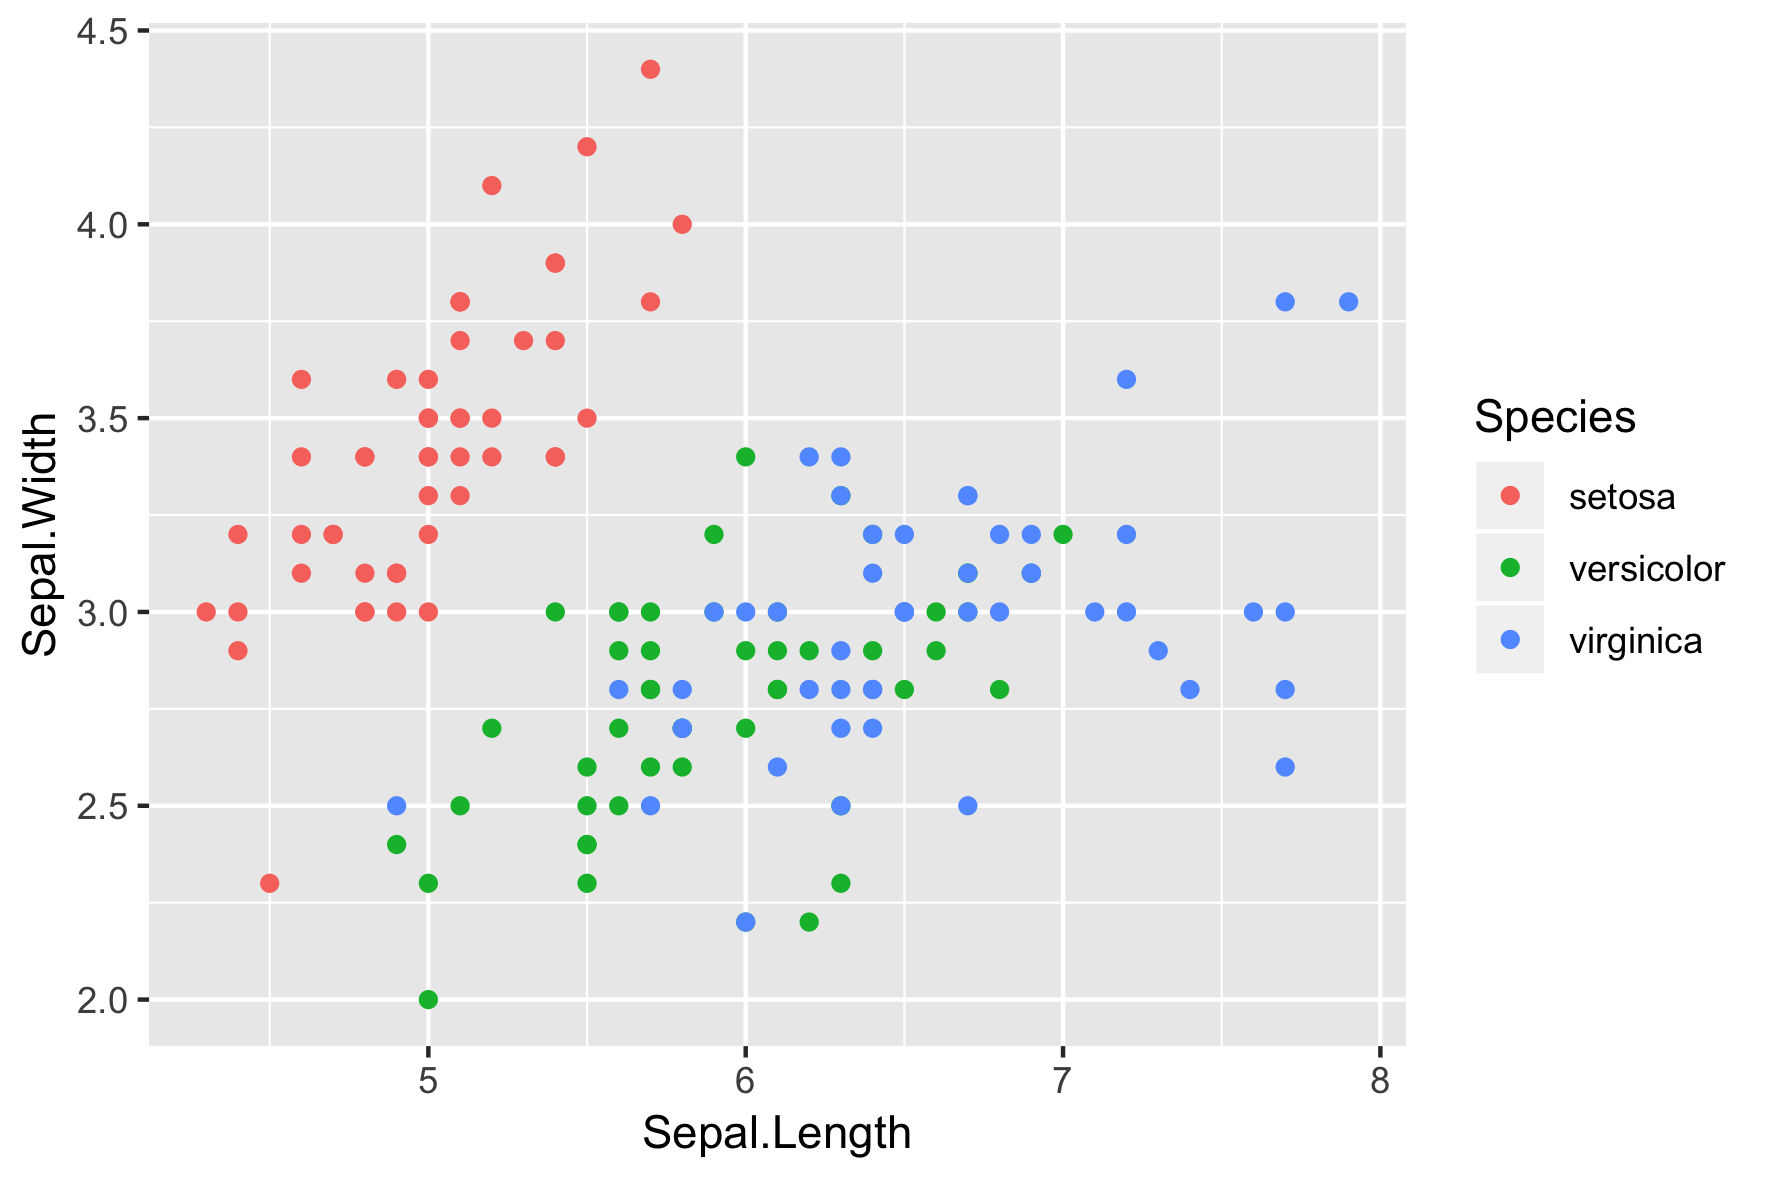
Estéticas - variáveis contínuas

Estéticas - variáveis contínuas
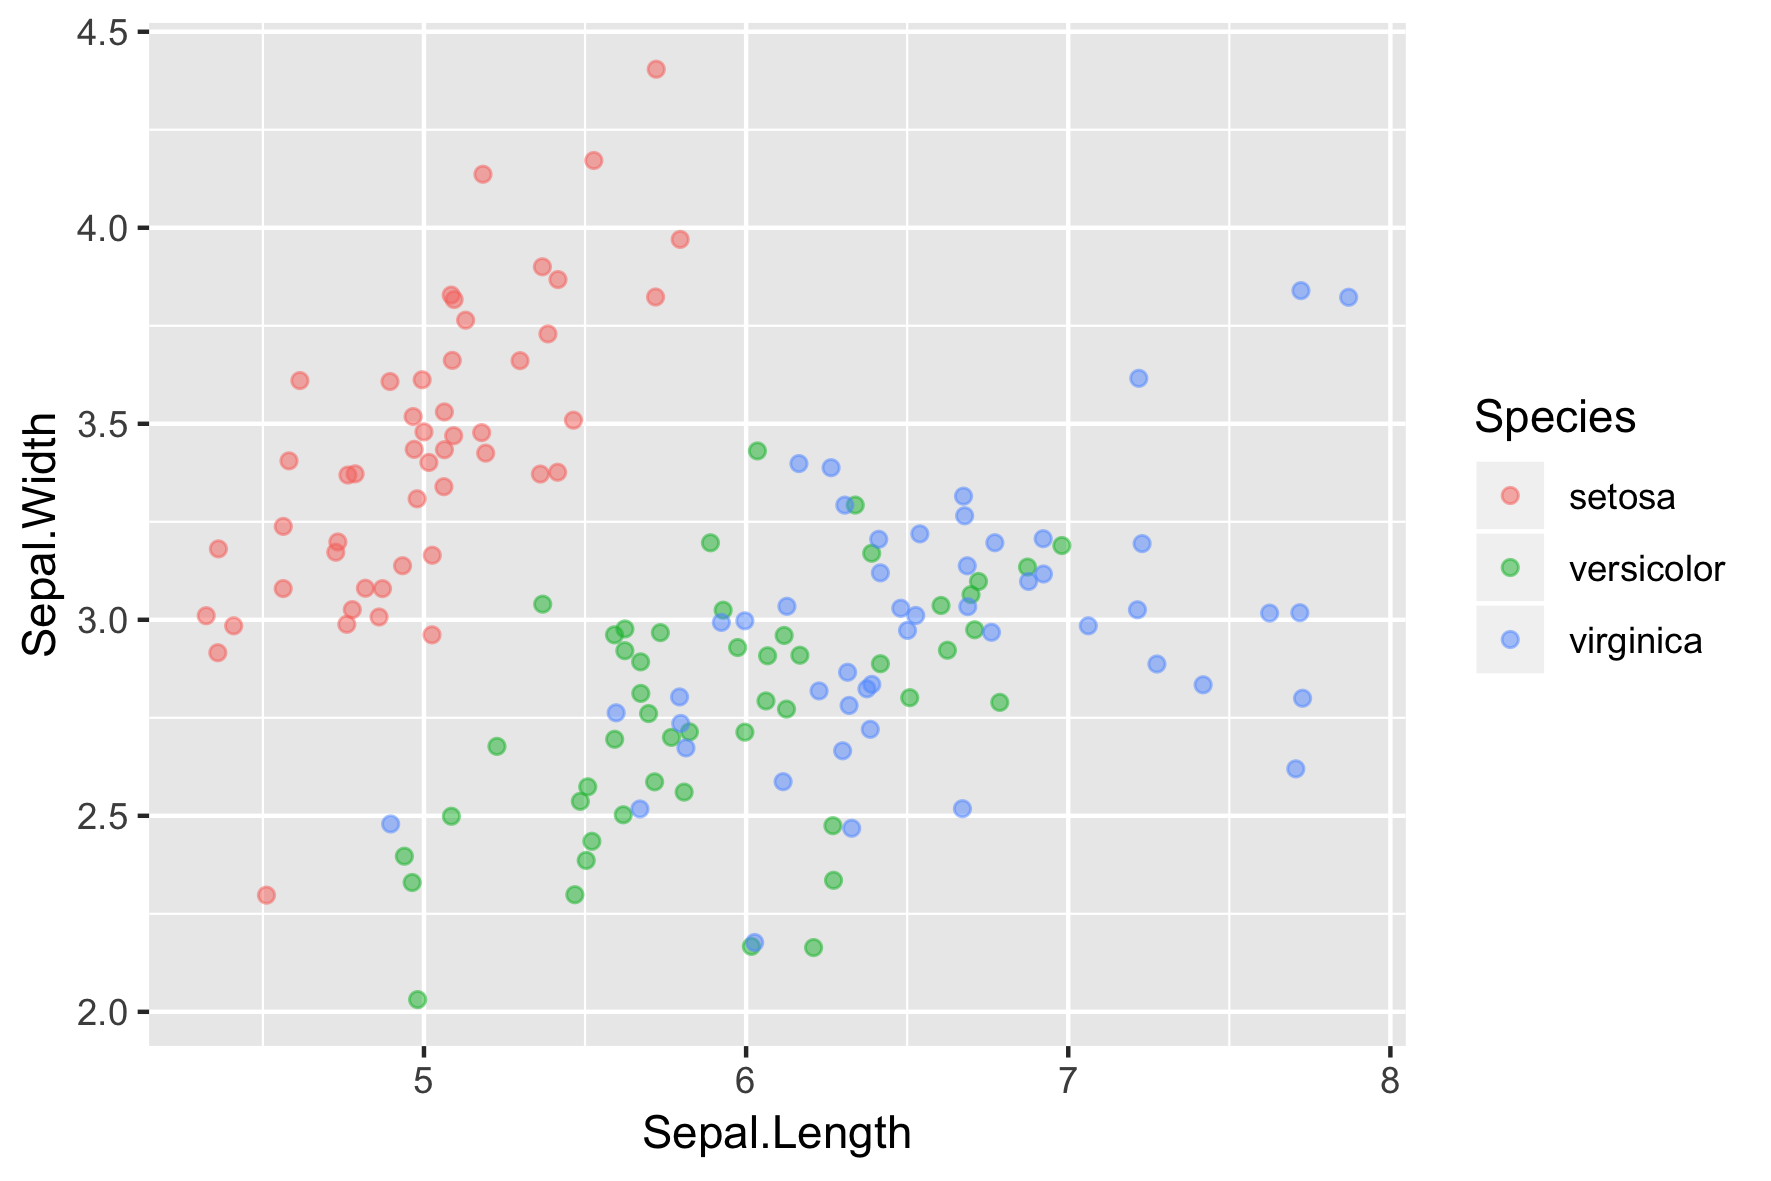
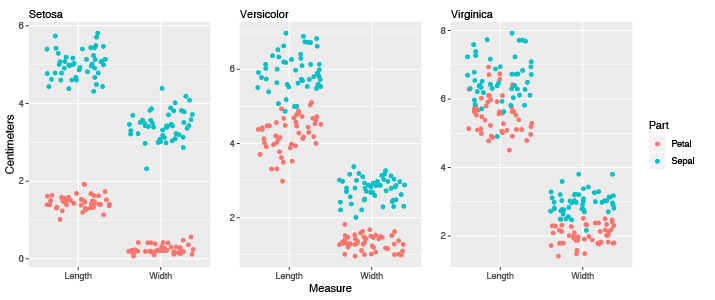
Três gráficos de dispersão de íris
Três gráficos de dispersão de íris, eixos y não alinhados
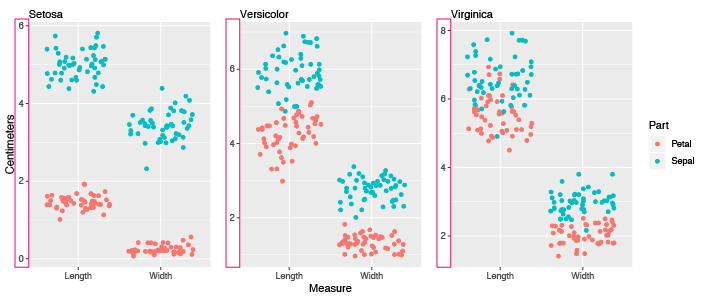
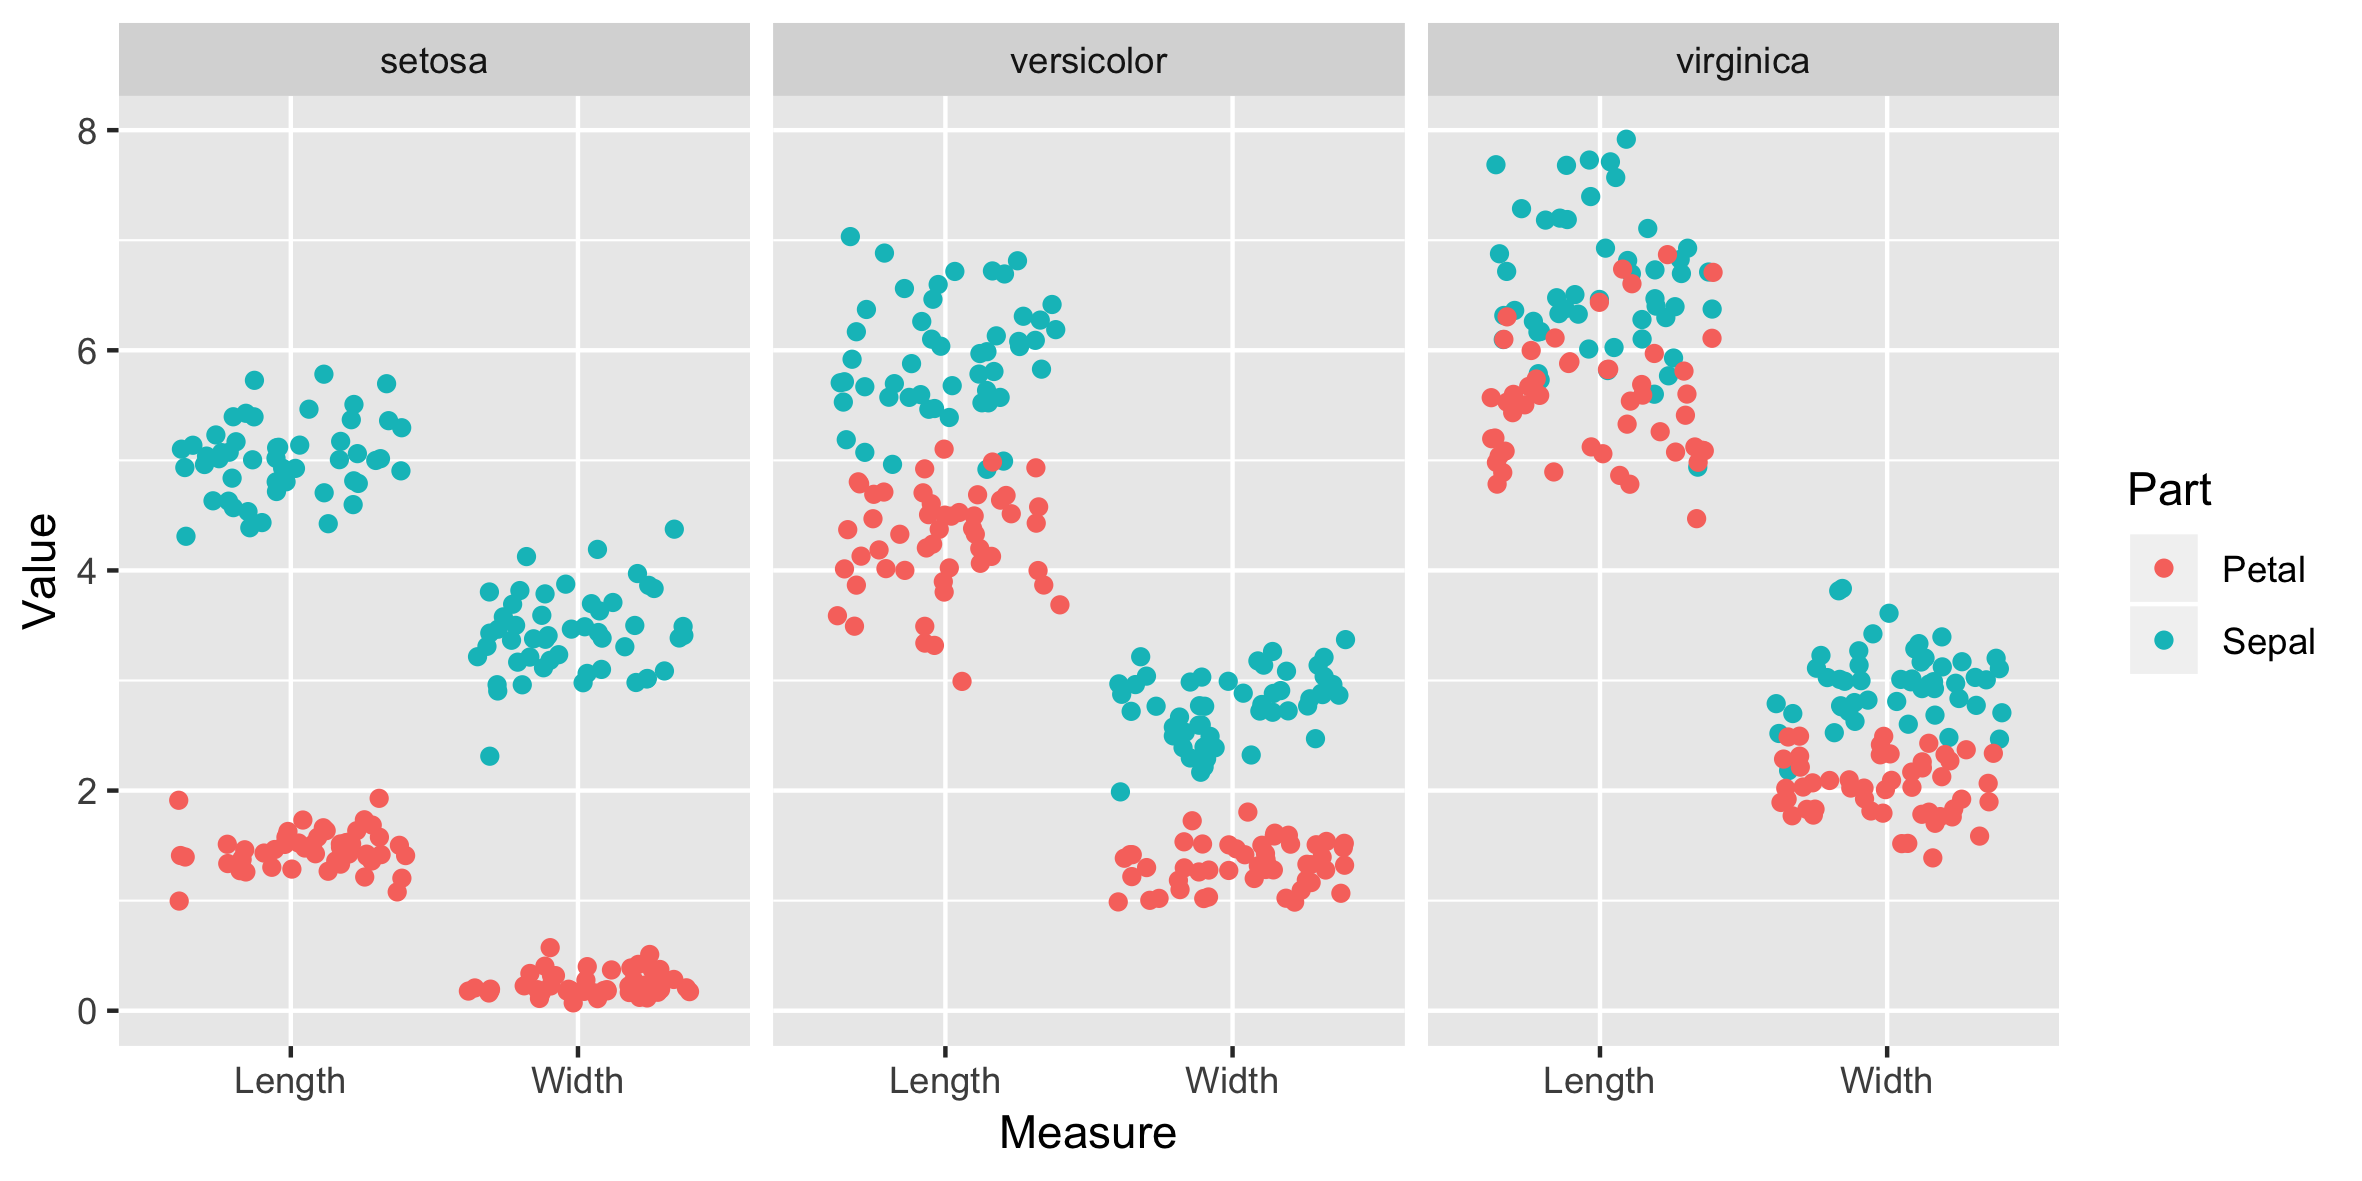
Gráfico de faceta única, eixo y comum
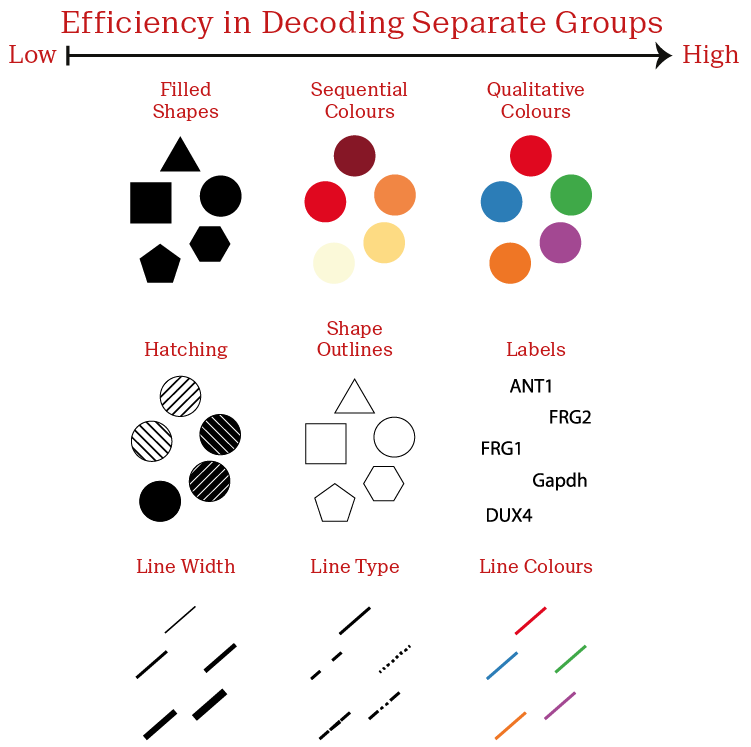
Estéticas - variáveis categóricas
Estéticas - variáveis categóricas