Histogramas
Introdução à visualização de dados com ggplot2

Rick Scavetta
Founder, Scavetta Academy
Tipos comuns de gráficos
| Tipo de gráfico | Possíveis geometrias |
|---|---|
| Gráficos de dispersão | pontos, dispersão, referência, suavidade, contagem |
| Gráficos de barras | histograma, barra, coluna, barra de erros |
| Gráficos de linhas | linha, caminho |
Histogramas
ggplot(iris, aes(x = Sepal.Width)) +
  geom_histogram()
- Um gráfico de valores em bins
- ou seja, uma função estatística
`stat_bin()` using `bins = 30`.
Pick better value with `binwidth`.
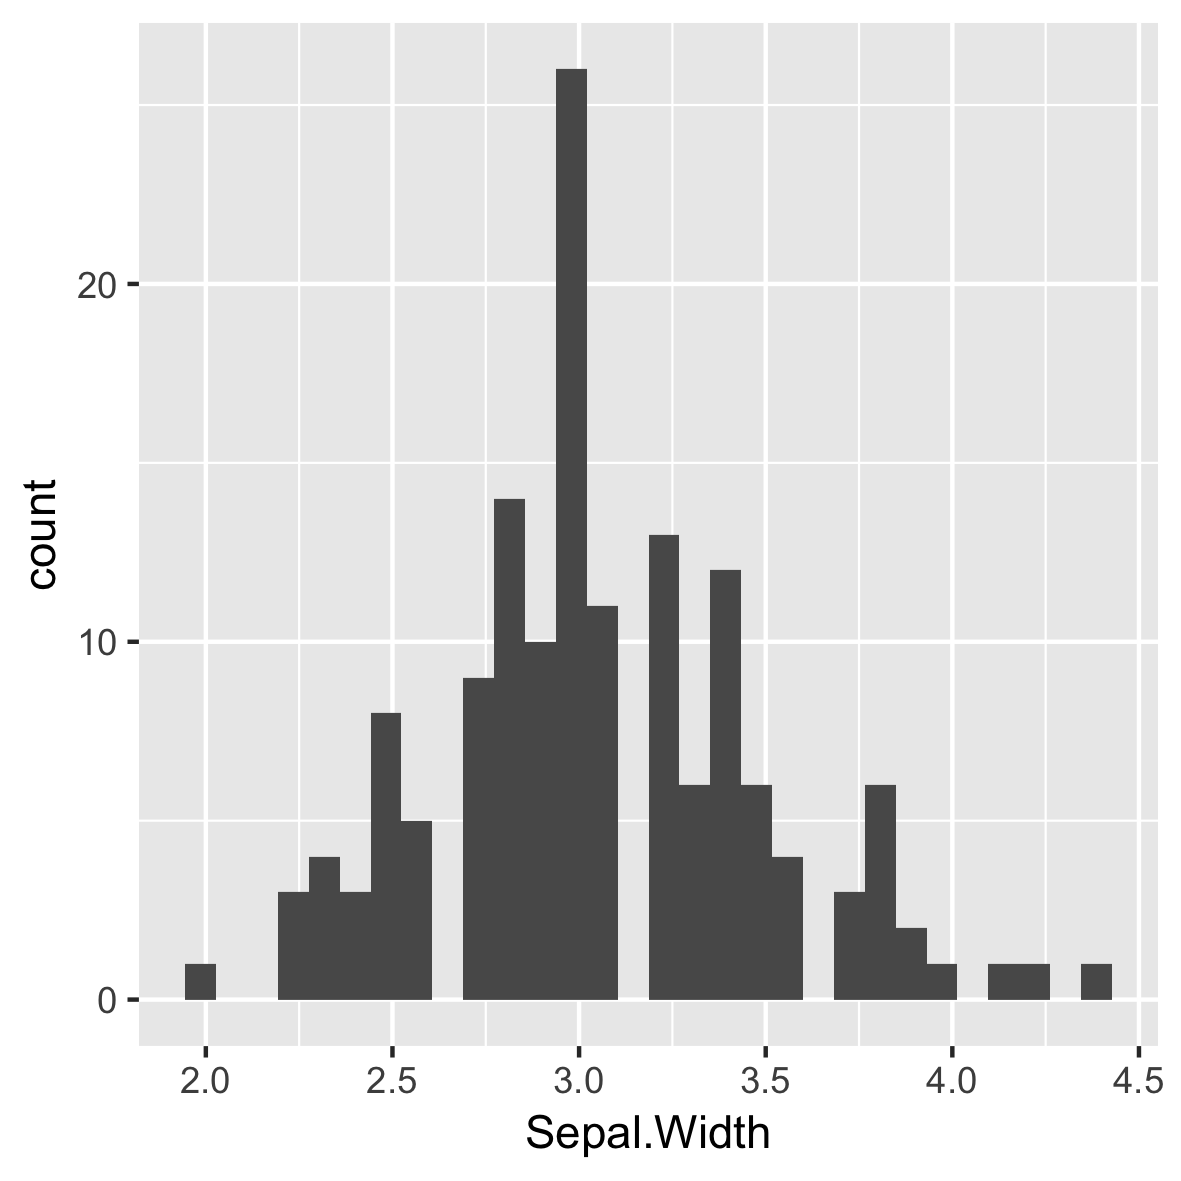
Padrão de 30 bins uniformes
ggplot(iris, aes(x = Sepal.Width)) +
  geom_histogram()
- Um gráfico de valores em bins
- ou seja, uma função estatística
# Default bin width:
diff(range(iris$Sepal.Width))/30
[1] 0.08

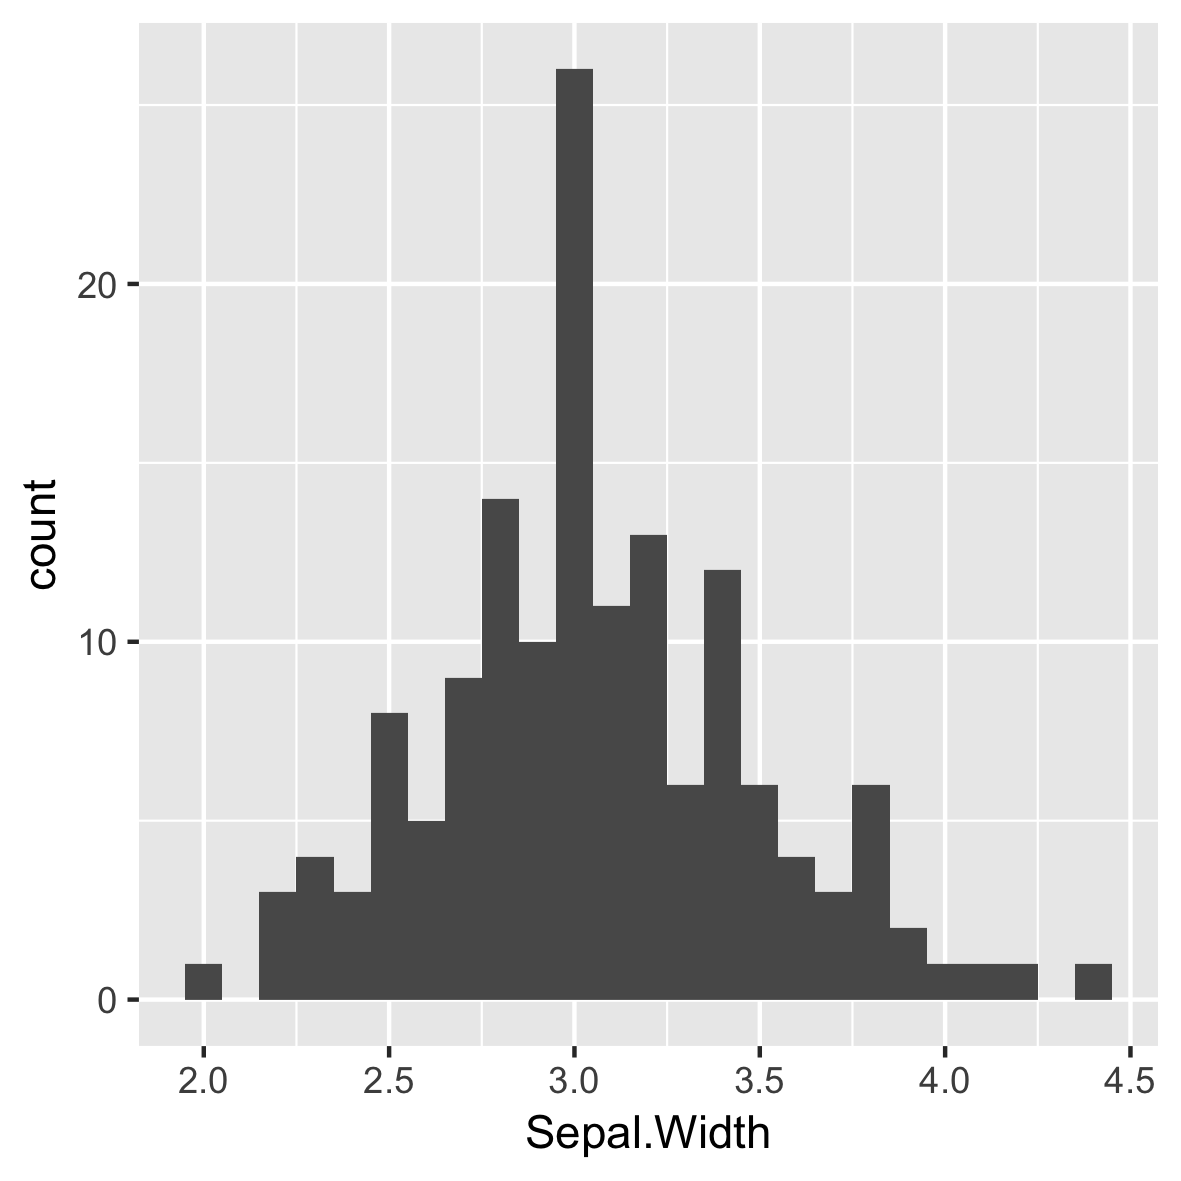
Larguras de bins intuitivas e significativas
ggplot(iris, aes(x = Sepal.Width)) +
  geom_histogram(binwidth = 0.1)
Sempre escolha larguras de bin adequadas para seus dados.
Sem espaços entre as barras.
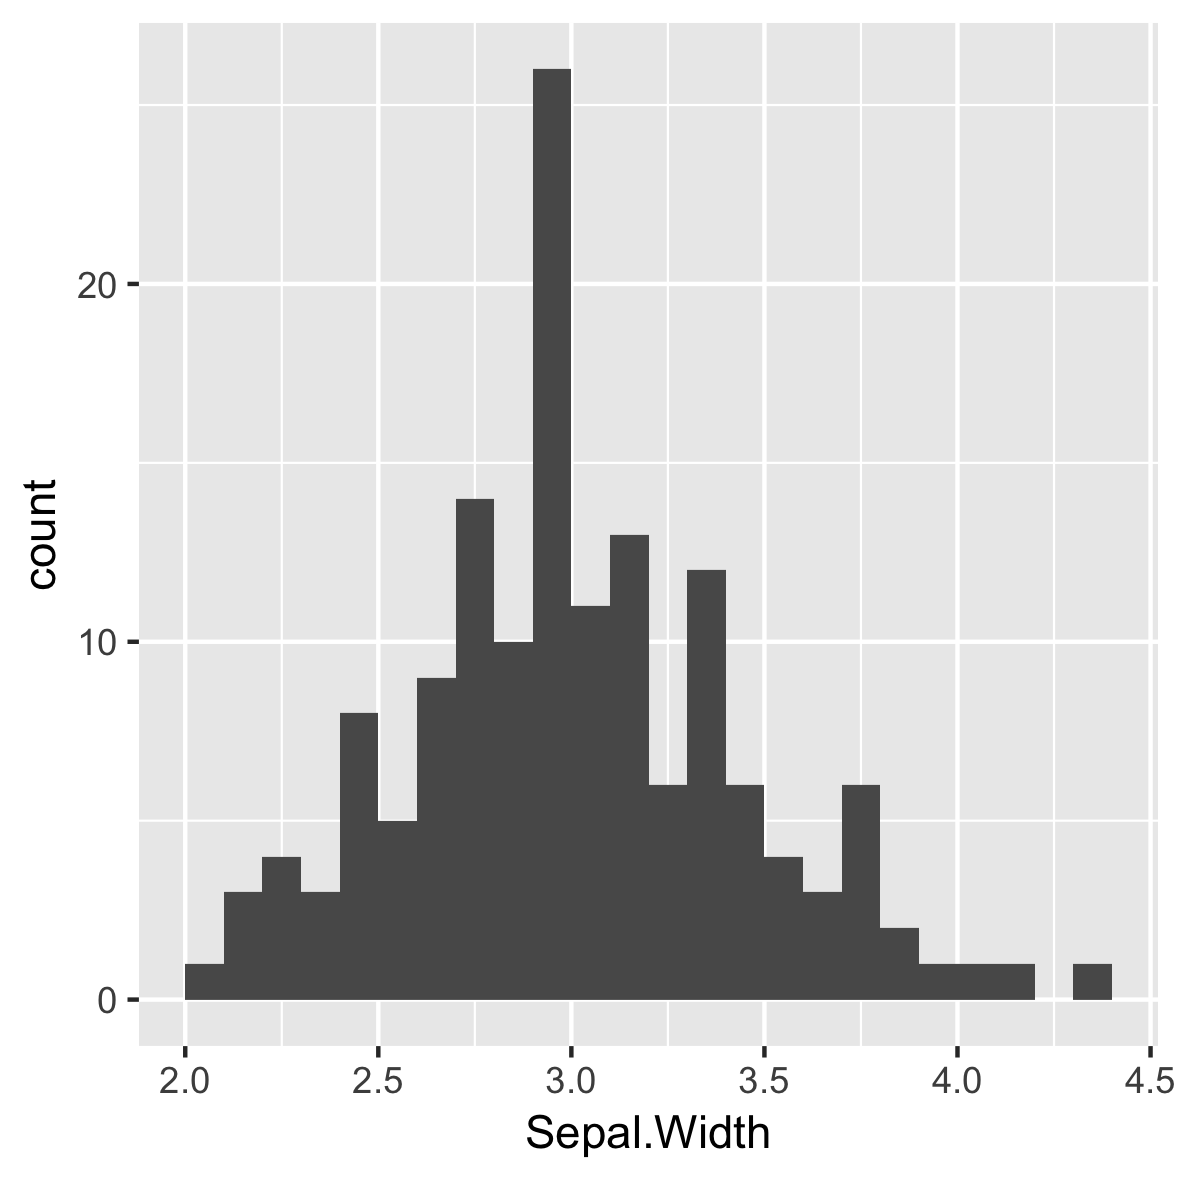
Reposicionar marcas de escala
ggplot(iris, aes(x = Sepal.Width)) +
  geom_histogram(binwidth = 0.1,
                 center = 0.05)
Sempre escolha larguras de bin adequadas para seus dados.
Sem espaços entre as barras.
Os rótulos do eixo X estão entre as barras.
Espécies diferentes
ggplot(iris, aes(x = Sepal.Width,
                 fill = Species)) +
  geom_histogram(binwidth = .1,
                 center = 0.05)
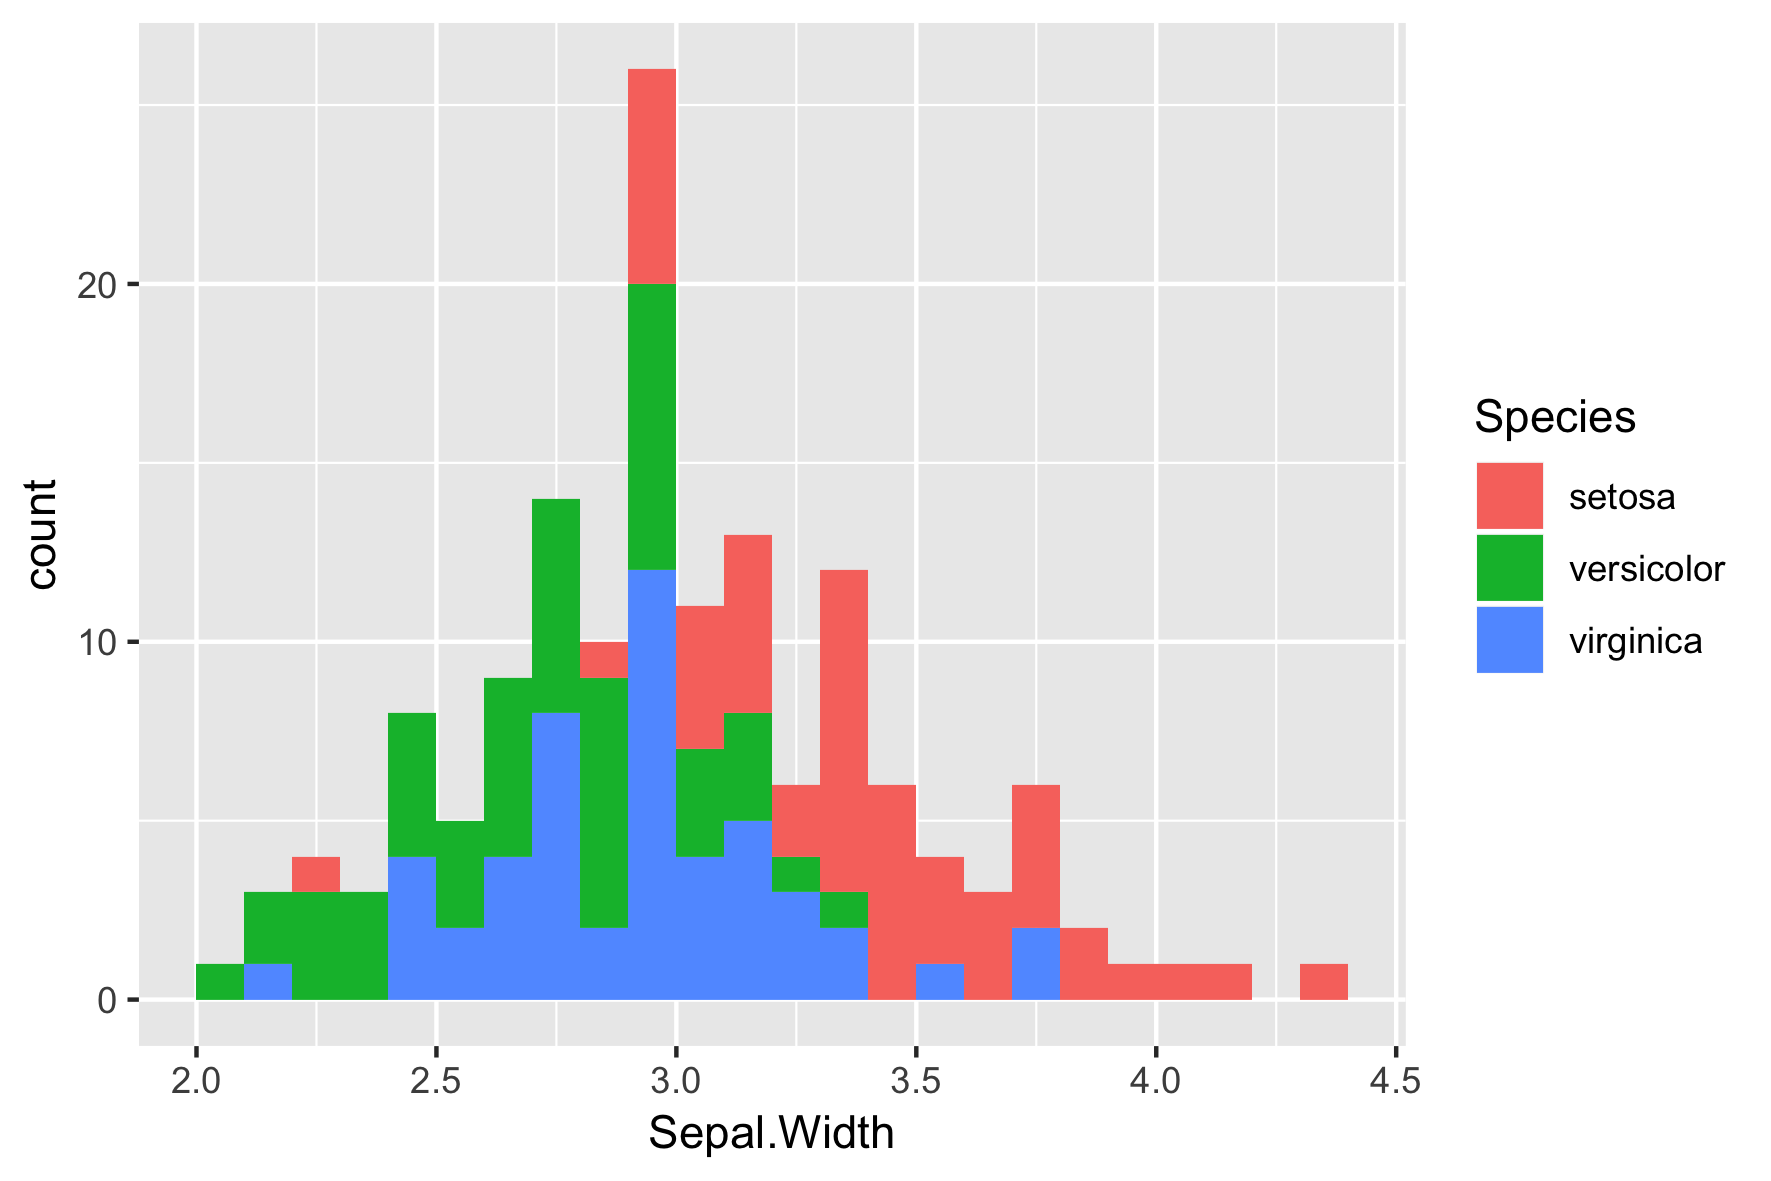
A posição padrão é "stack"
ggplot(iris, aes(x = Sepal.Width,
                 fill = Species)) +
  geom_histogram(binwidth = .1,
                 center = 0.05,
                 position = "stack")

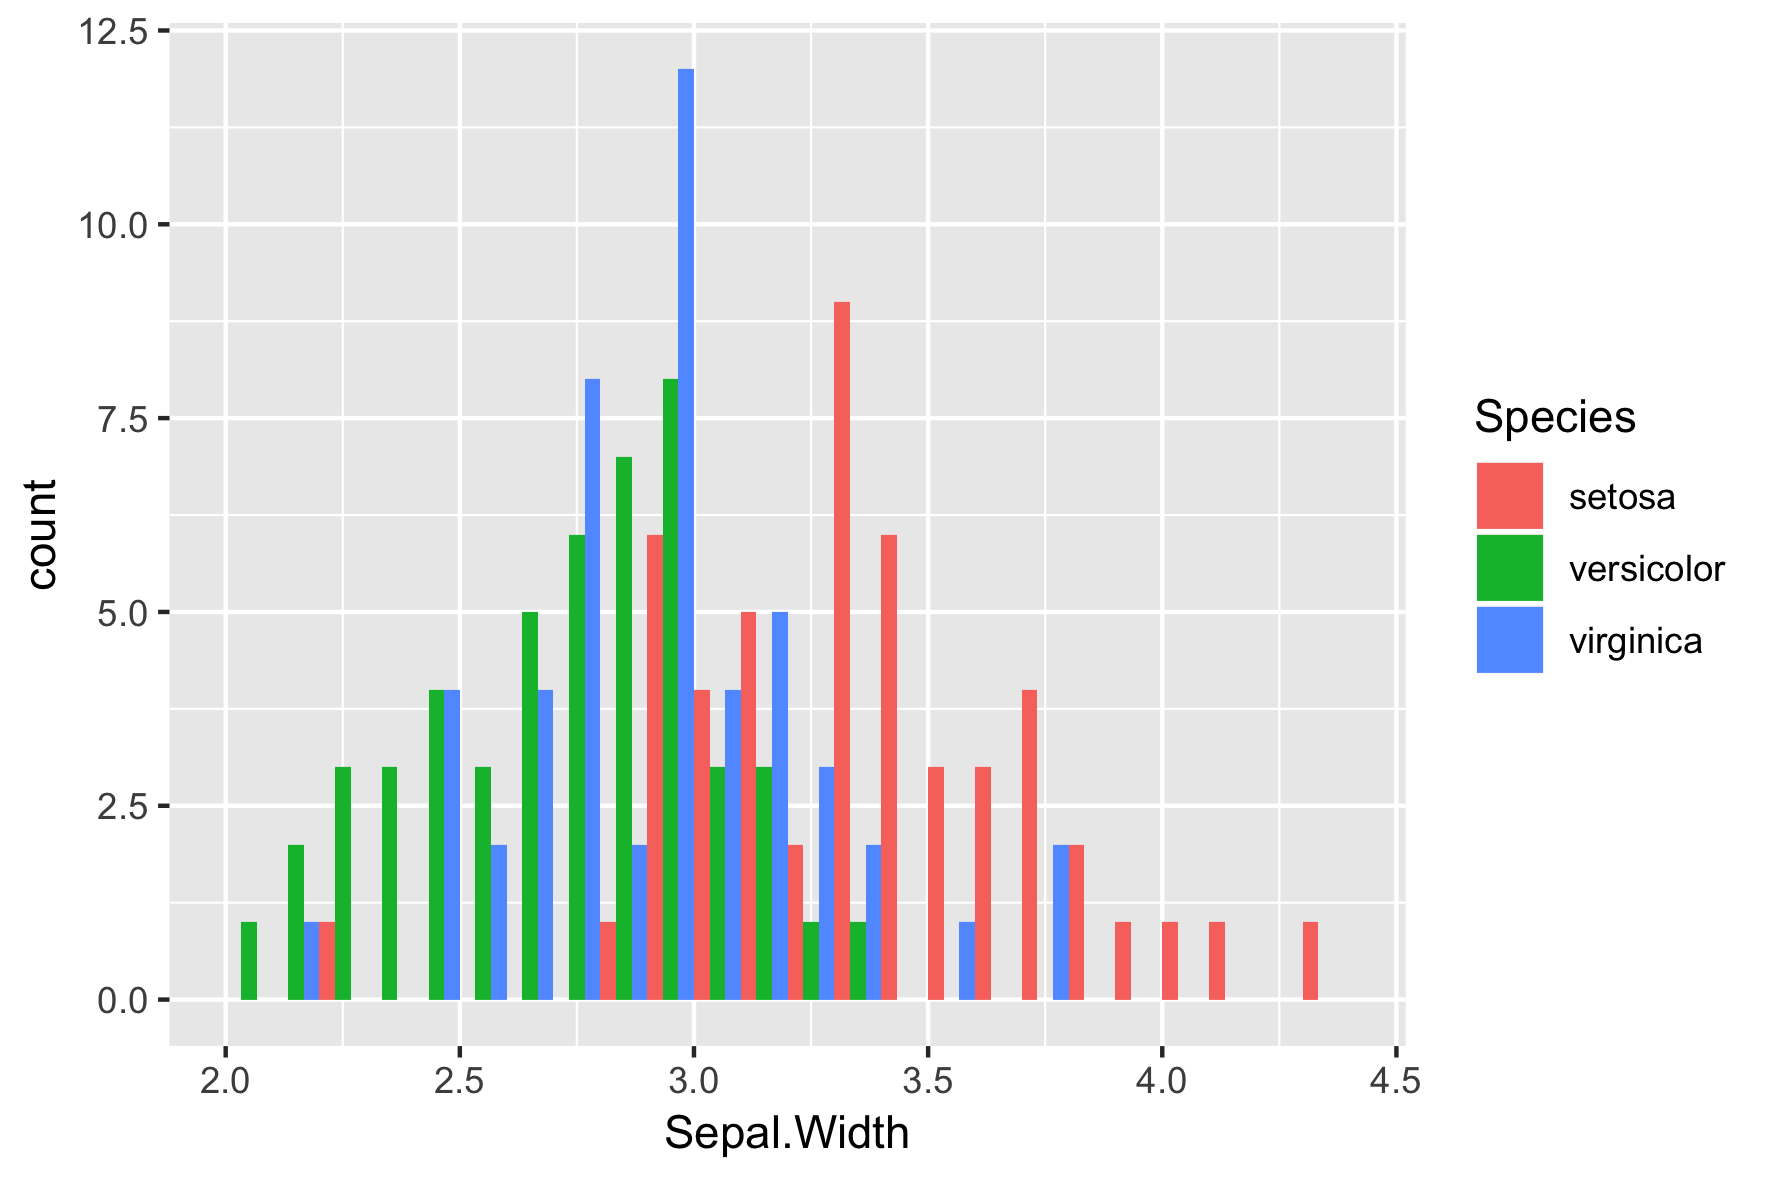
position = "dodge"
ggplot(iris, aes(x = Sepal.Width,
                 fill = Species)) +
  geom_histogram(binwidth = .1,
                 center = 0.05,
                 position = "dodge")
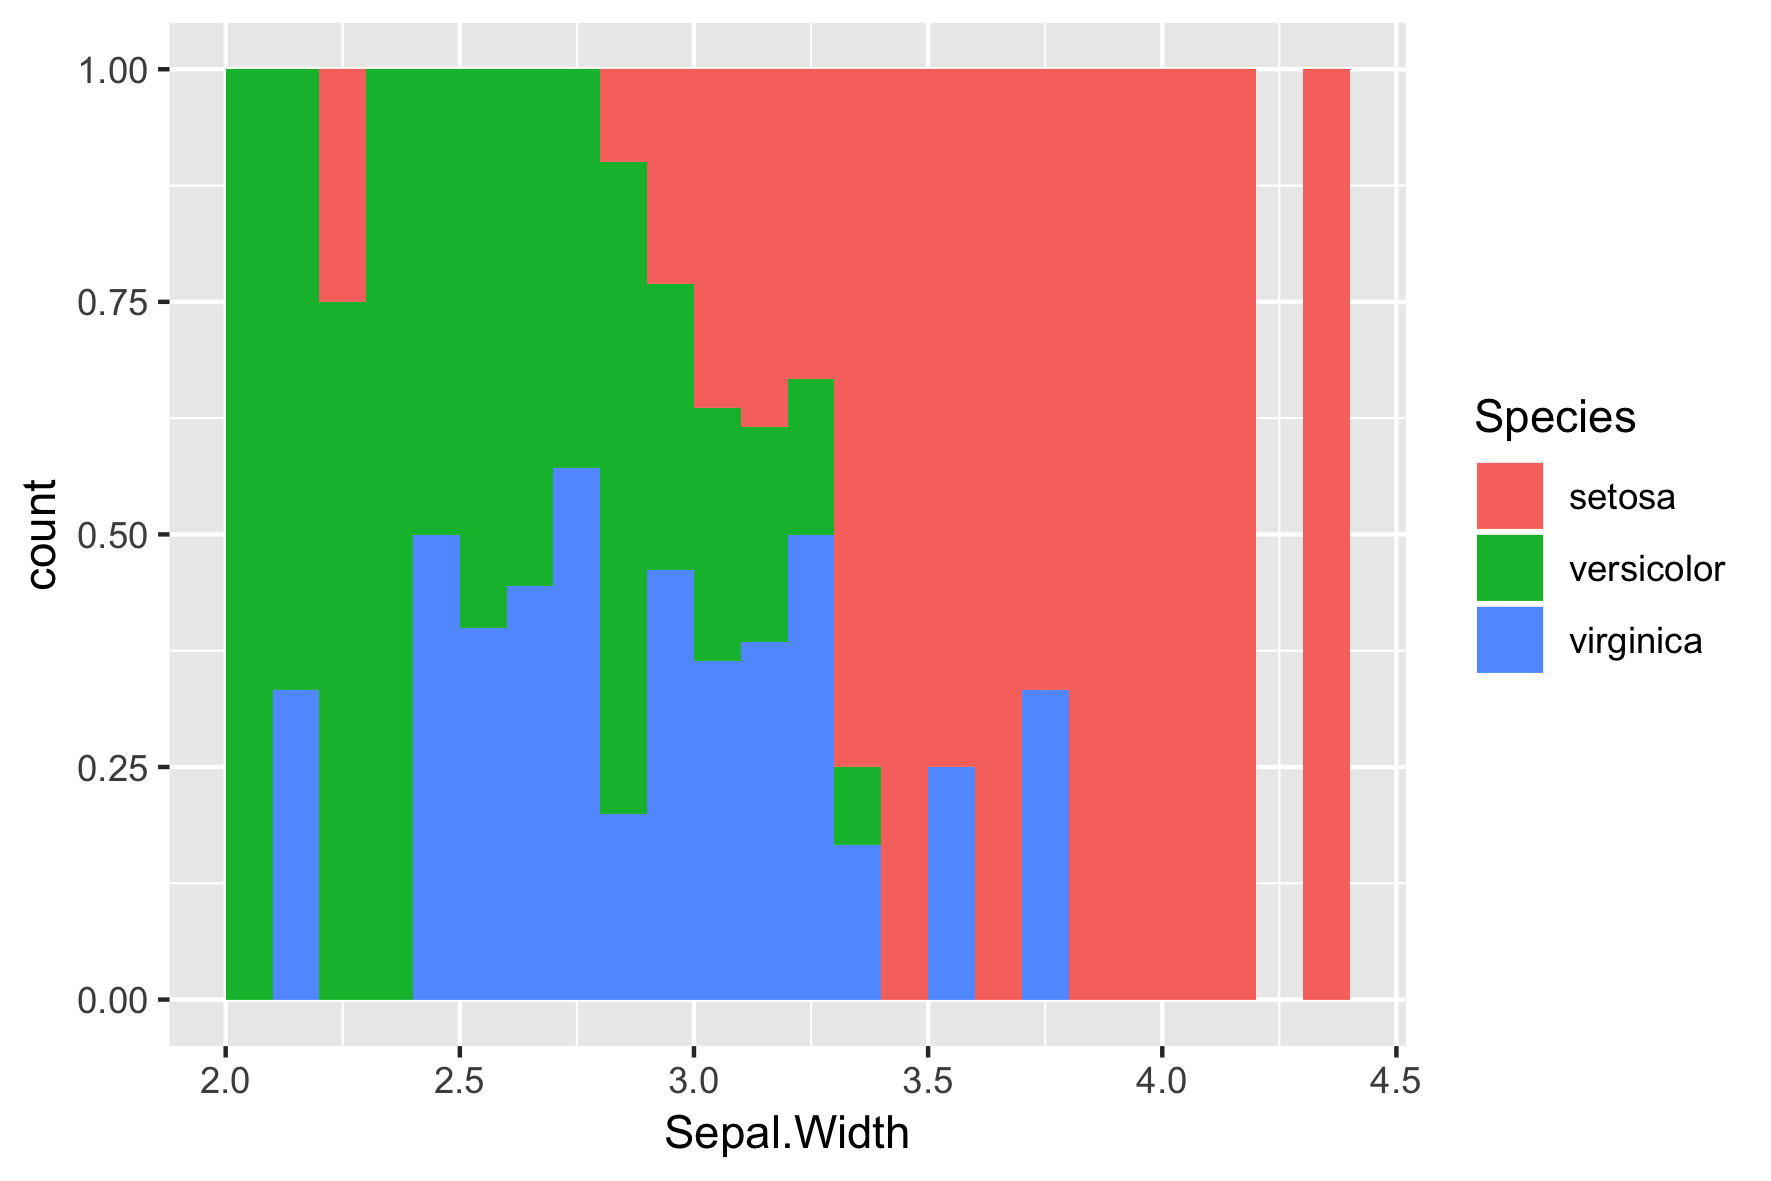
position = "fill"
ggplot(iris, aes(x = Sepal.Width,
                 fill = Species)) +
  geom_histogram(binwidth = .1,
                 center = 0.05,
                 position = "fill")
Slide final
Introdução à visualização de dados com ggplot2

