Camadas do ggplot2
Introdução à visualização de dados com ggplot2

Rick Scavetta
Founder, Scavetta Academy
Dados
Conjunto de dados de íris
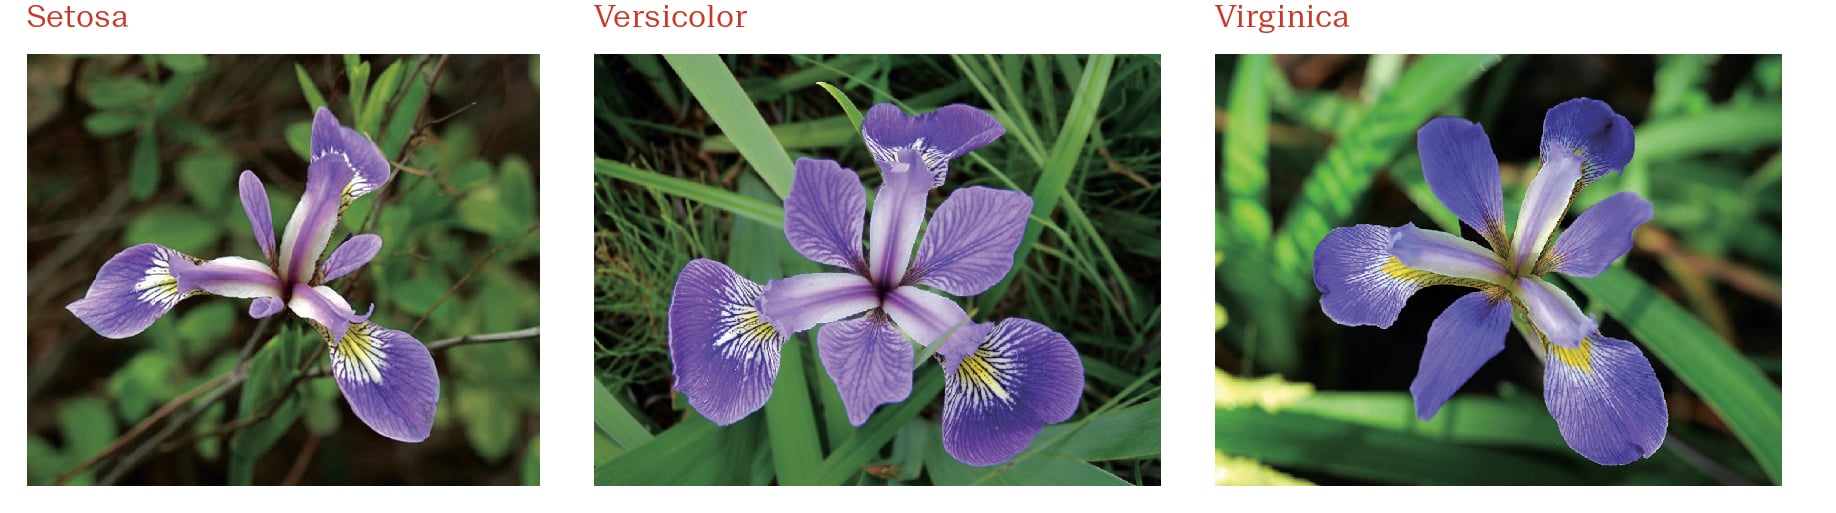
1 Fisher, R. A. (1936) The use of multiple measurements in taxonomic problems. Annals of Eugenics, 7, Parte II, 179-188. 2 Anderson, Edgar (1935). The irises of the Gaspe Peninsula, Bulletin of the American Iris Society, 59, 2-5.
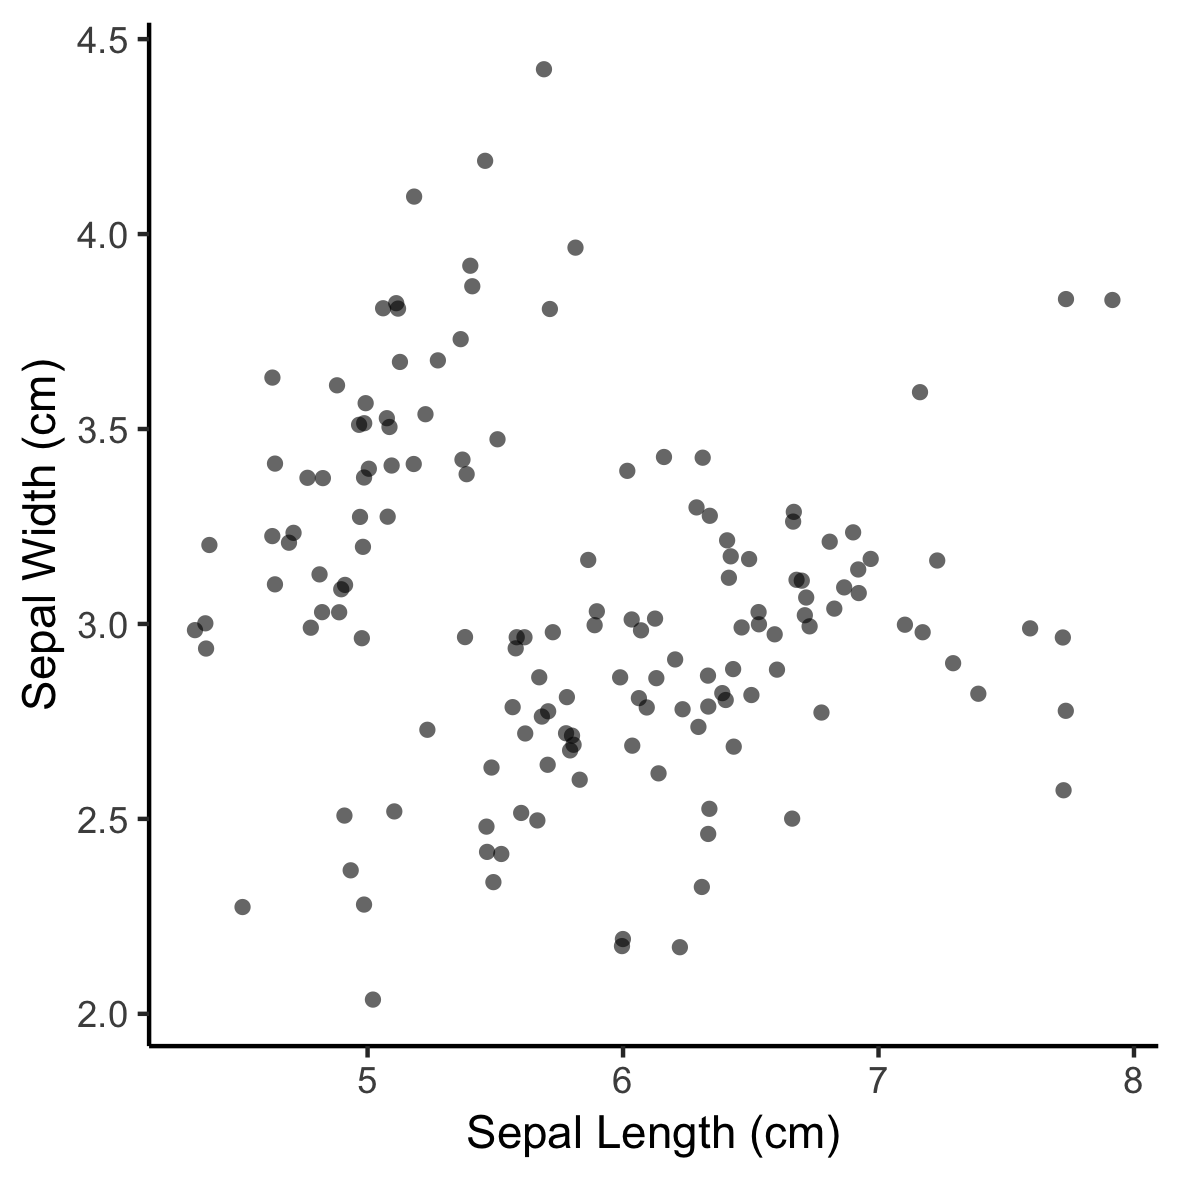
Estéticas

Estéticas de íris

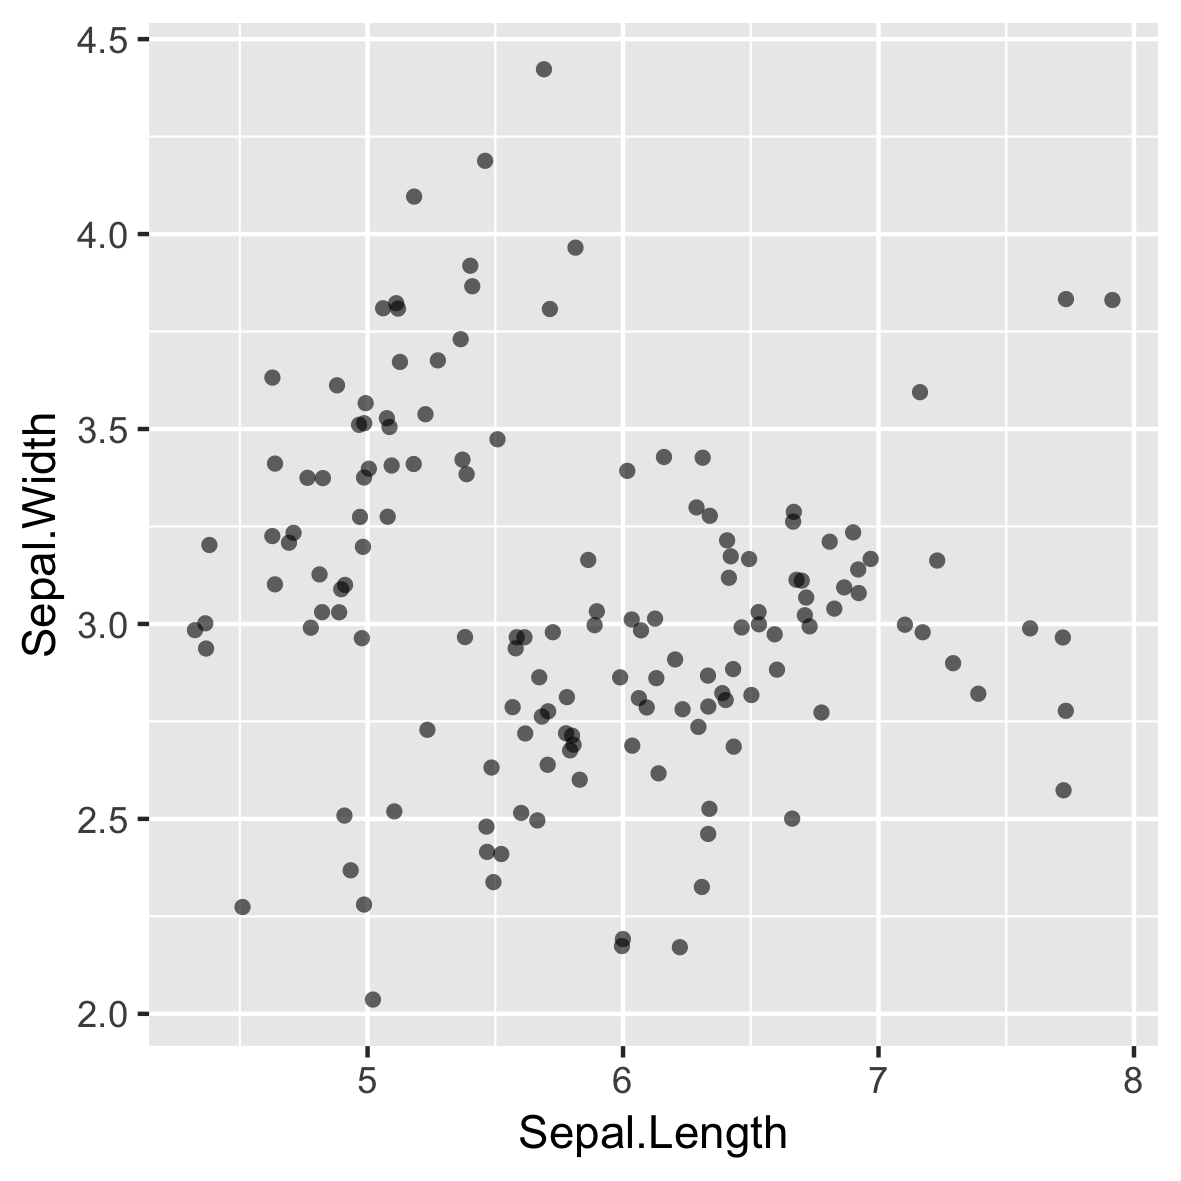
Geometrias

Geometrias de íris
Temas

Temas de íris