Gerando resposta emocional
Visualização de dados no Power BI

Iason Prassides
Content Developer at DataCamp
Você alcançou o público certo?
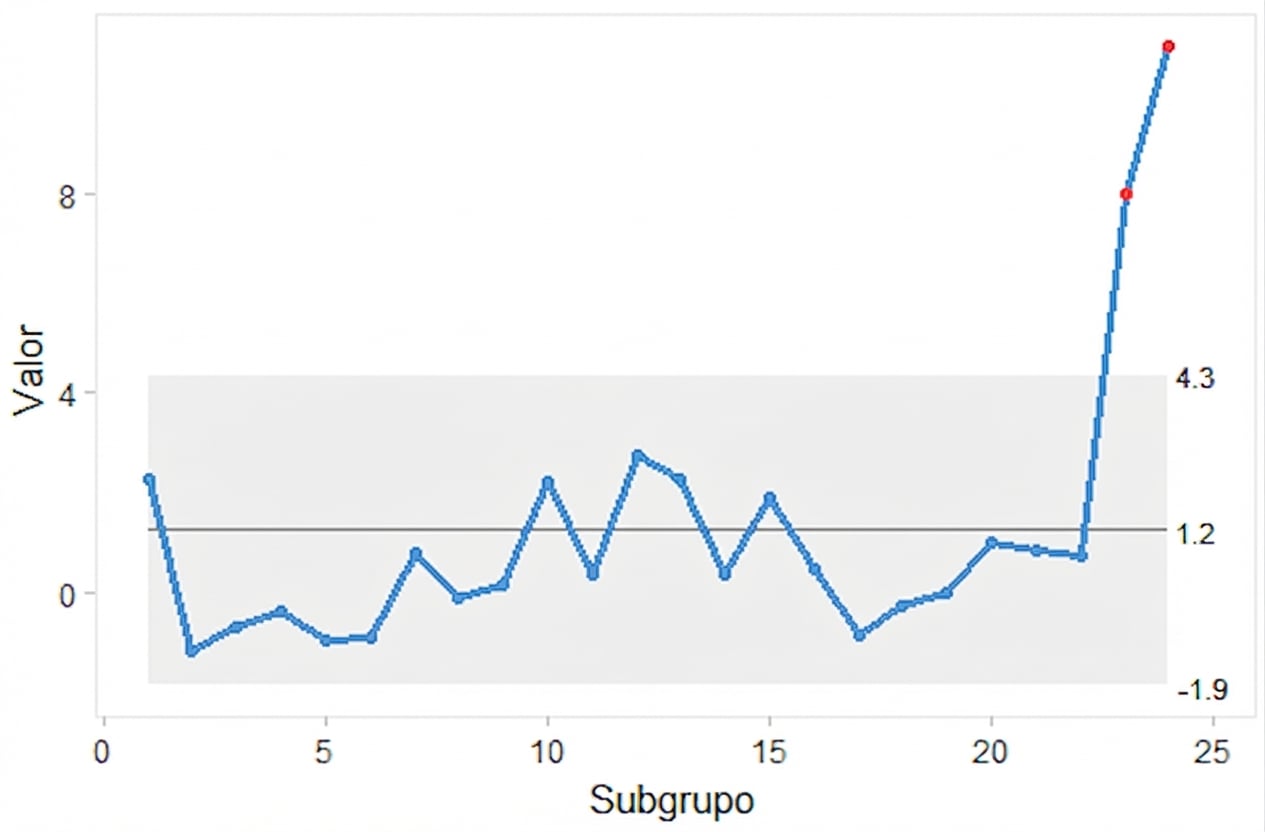
Gráfico de Controle de Processo
Engajamento emocional
Por que estou feliz

- Tudo no dashboard parece ok
- Não preciso agir (ou posso fazer uma ação positiva)
Por que estou bravo

- Algo deu errado
- Preciso agir por causa disso
Engajamento emocional

Pior caso: zero resposta emocional
- Dashboard irrelevante para a pessoa usuária
Nosso público