Menos é mais
Visualização de dados no Power BI

Iason Prassides
Content Developer at DataCamp
Promovendo a história
Narrativa em um mundo de escolhas
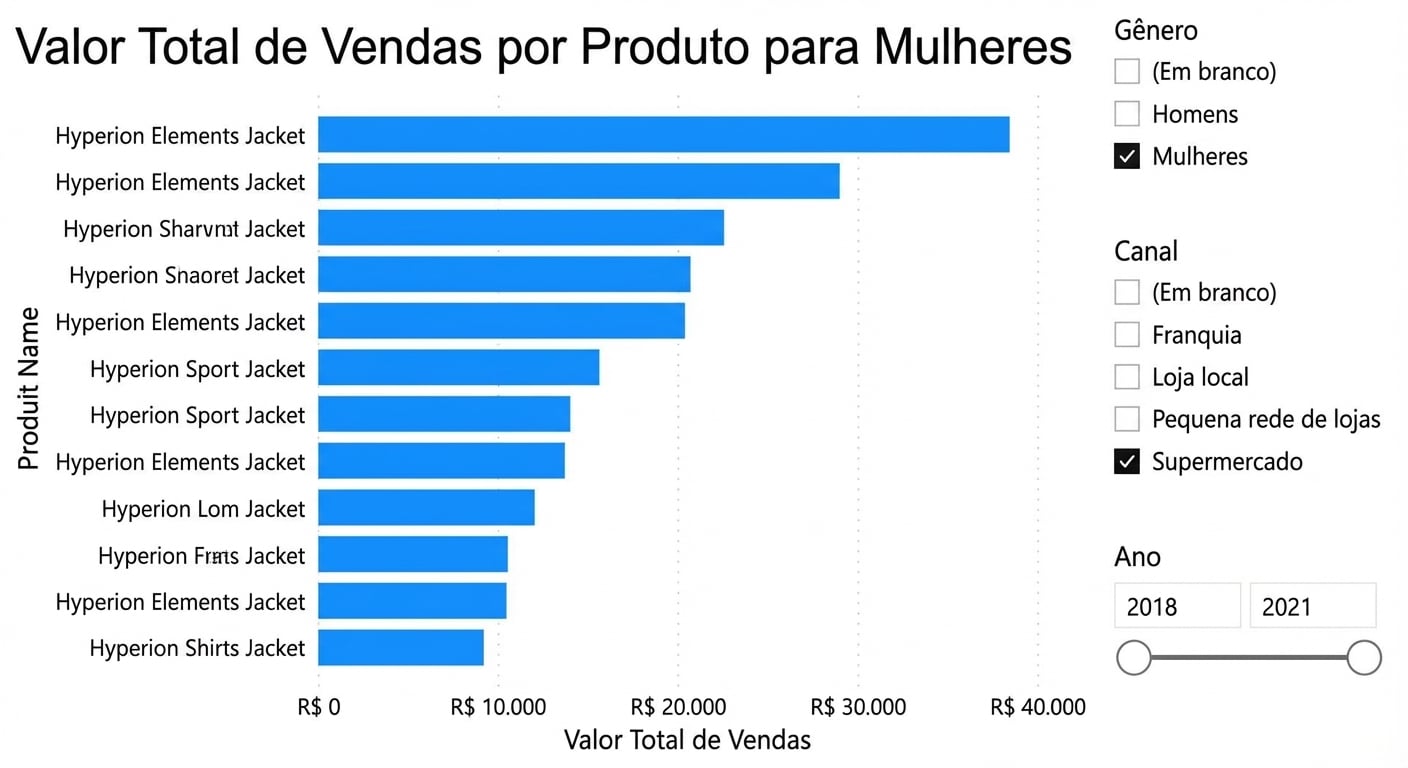
Escolhendo o elemento visual certo
Escolhendo o elemento visual certo
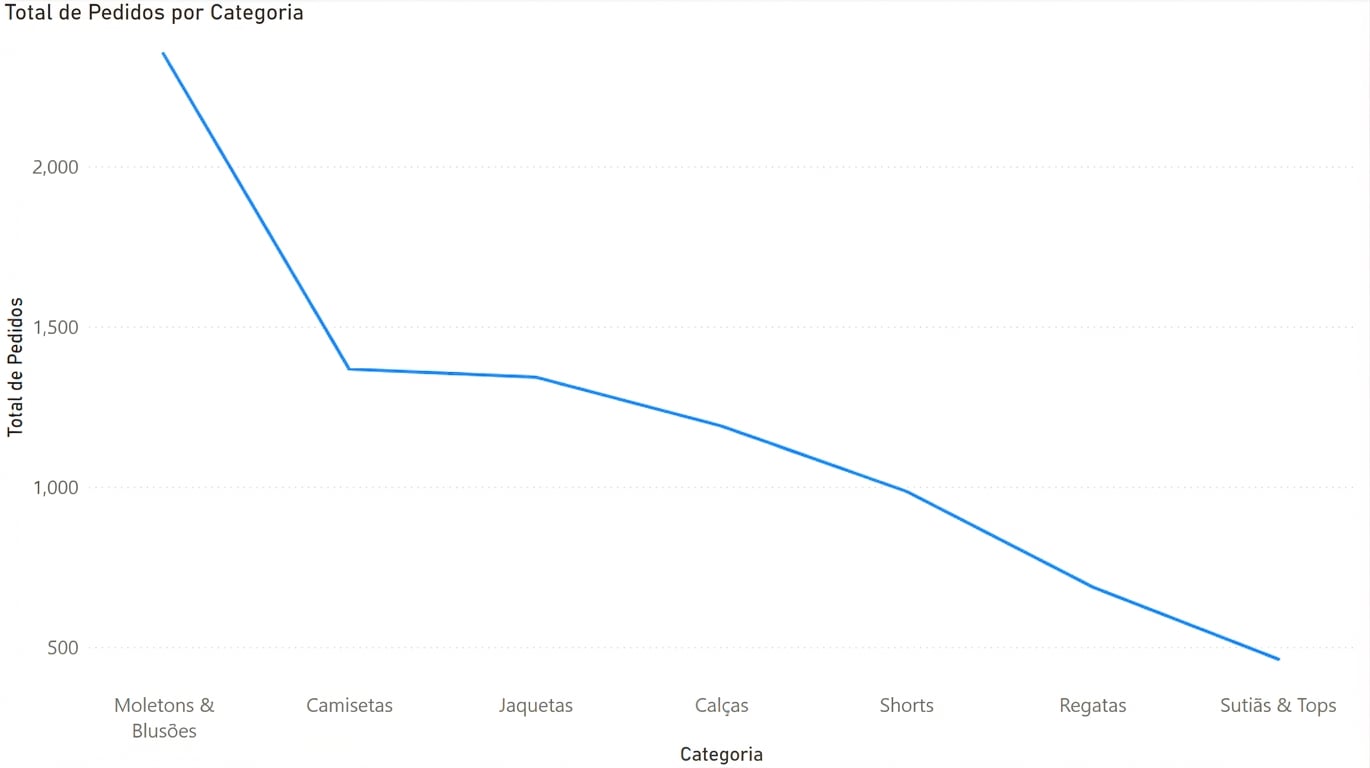
Escolhendo o elemento visual certo
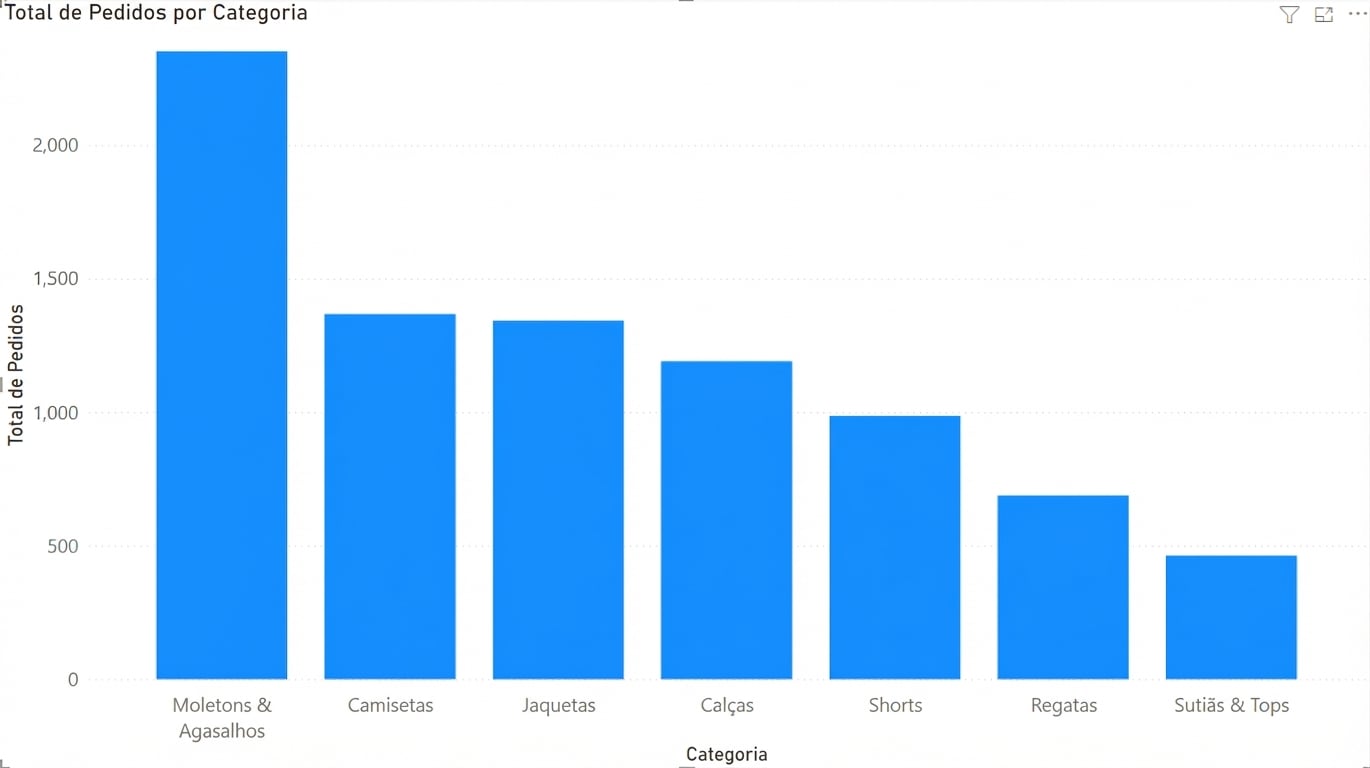
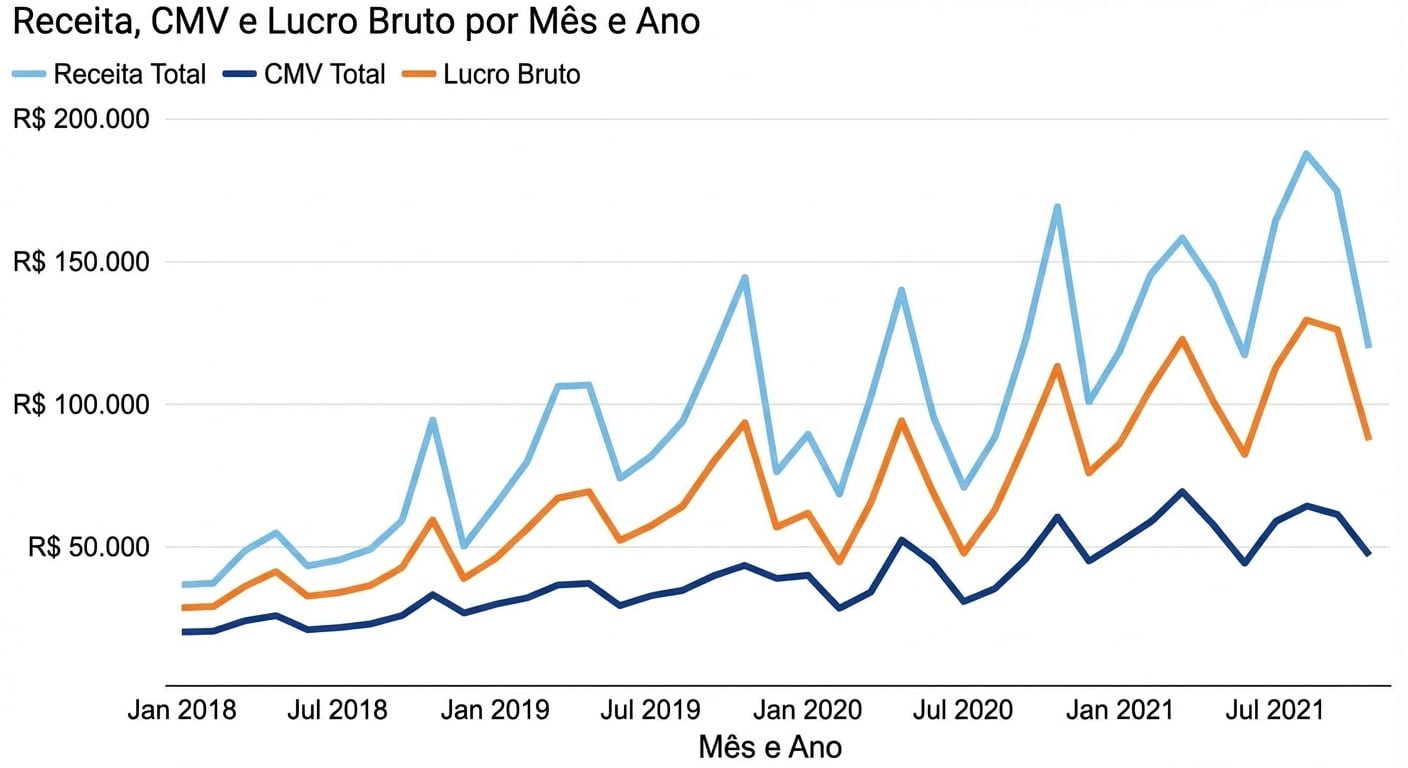
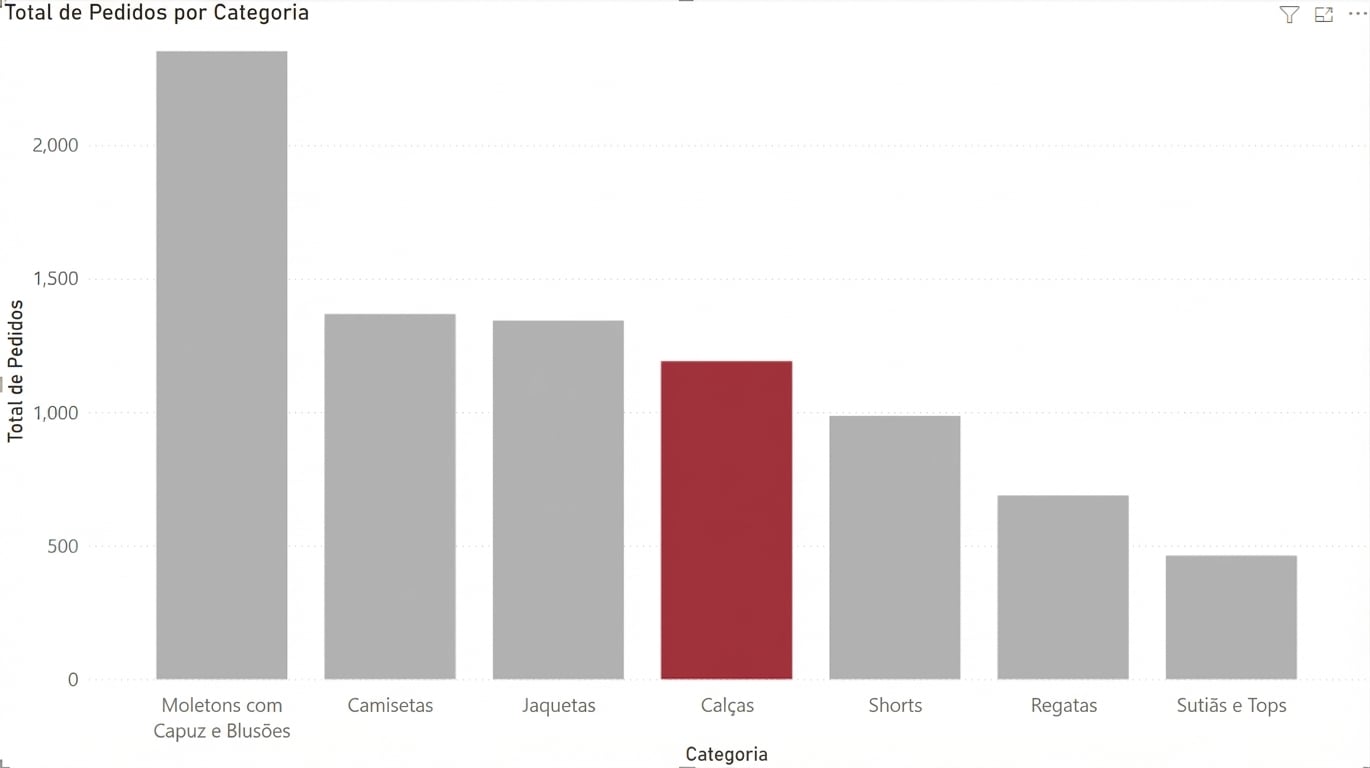
Cor como destaque
- Cor é um "atributo pré-atentivo"
- Use cores neutras nas barras
- Escolha uma cor de destaque
- Cor é um enfeite

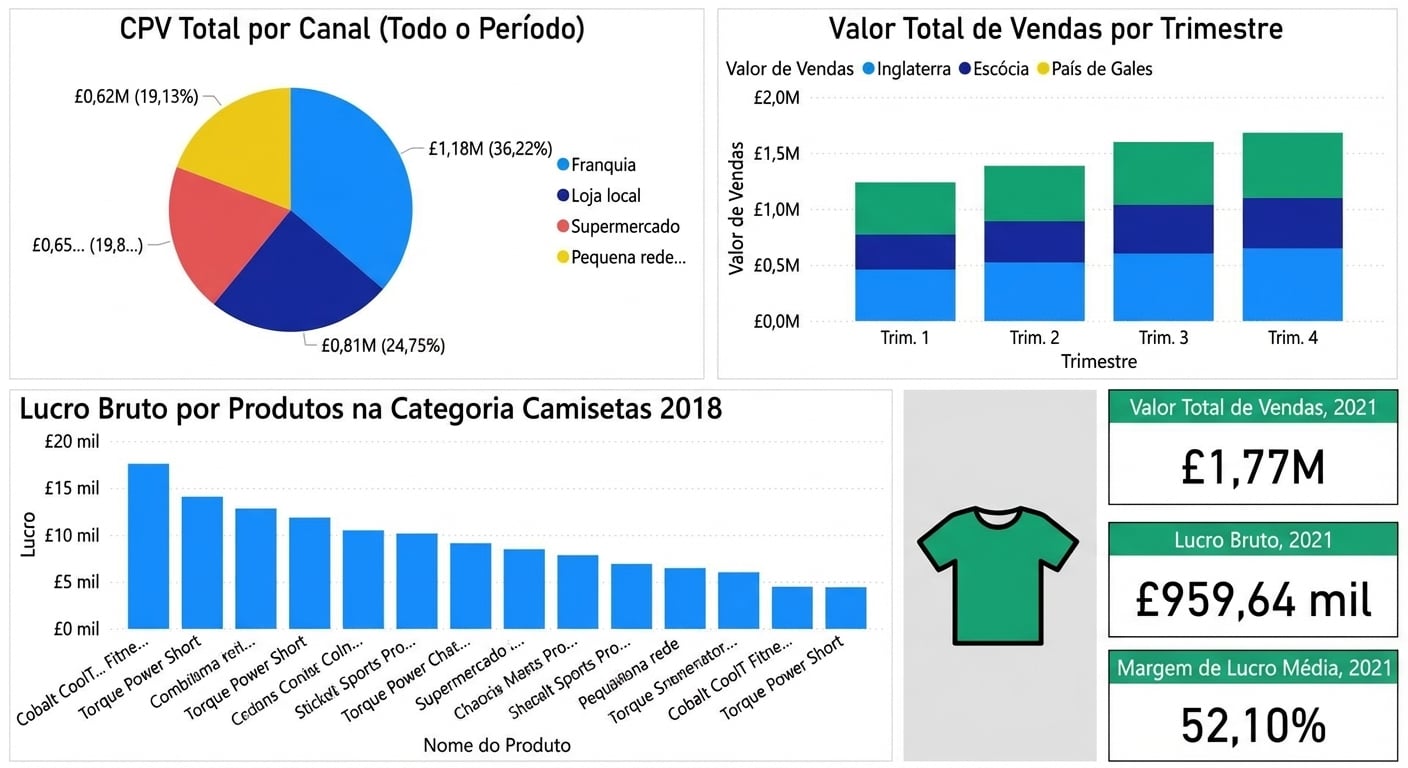
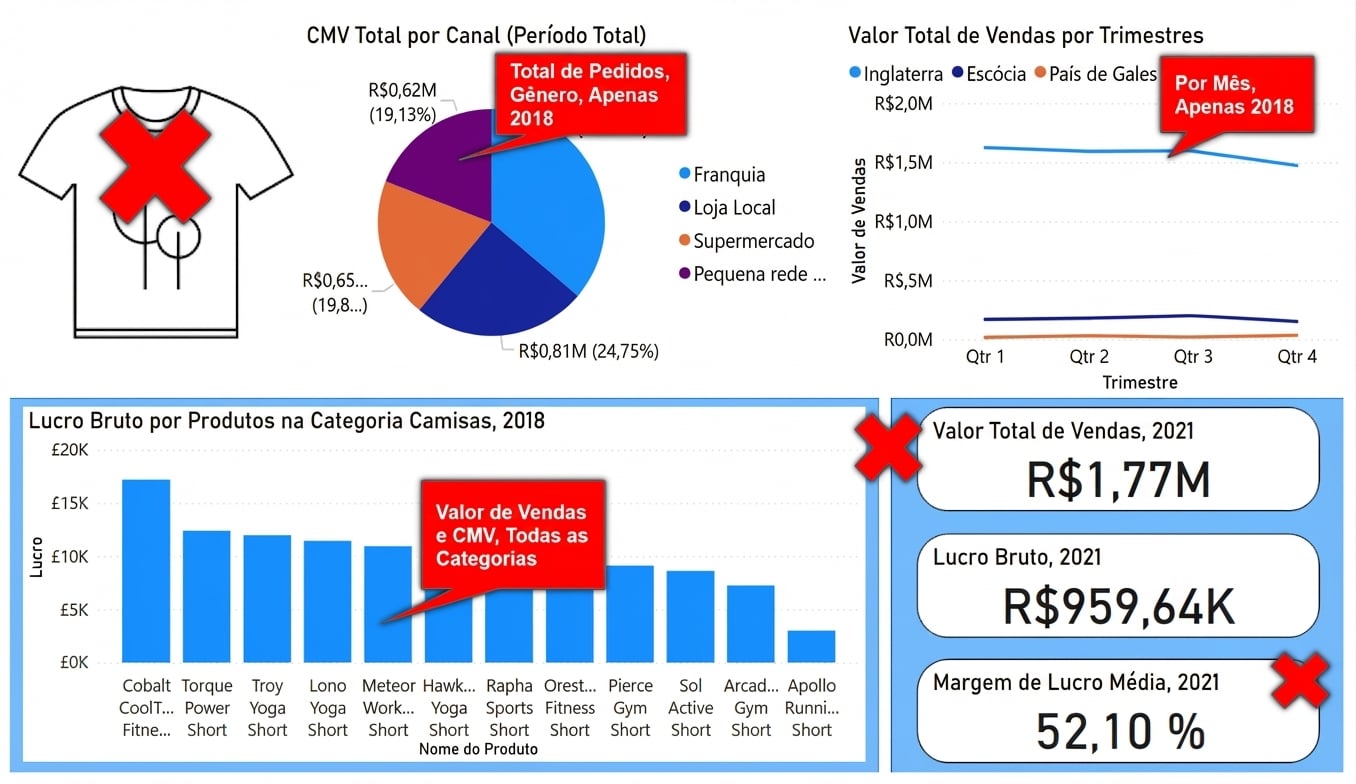
Despoluindo um dashboard
Despoluindo um dashboard
Um dashboard mais limpo
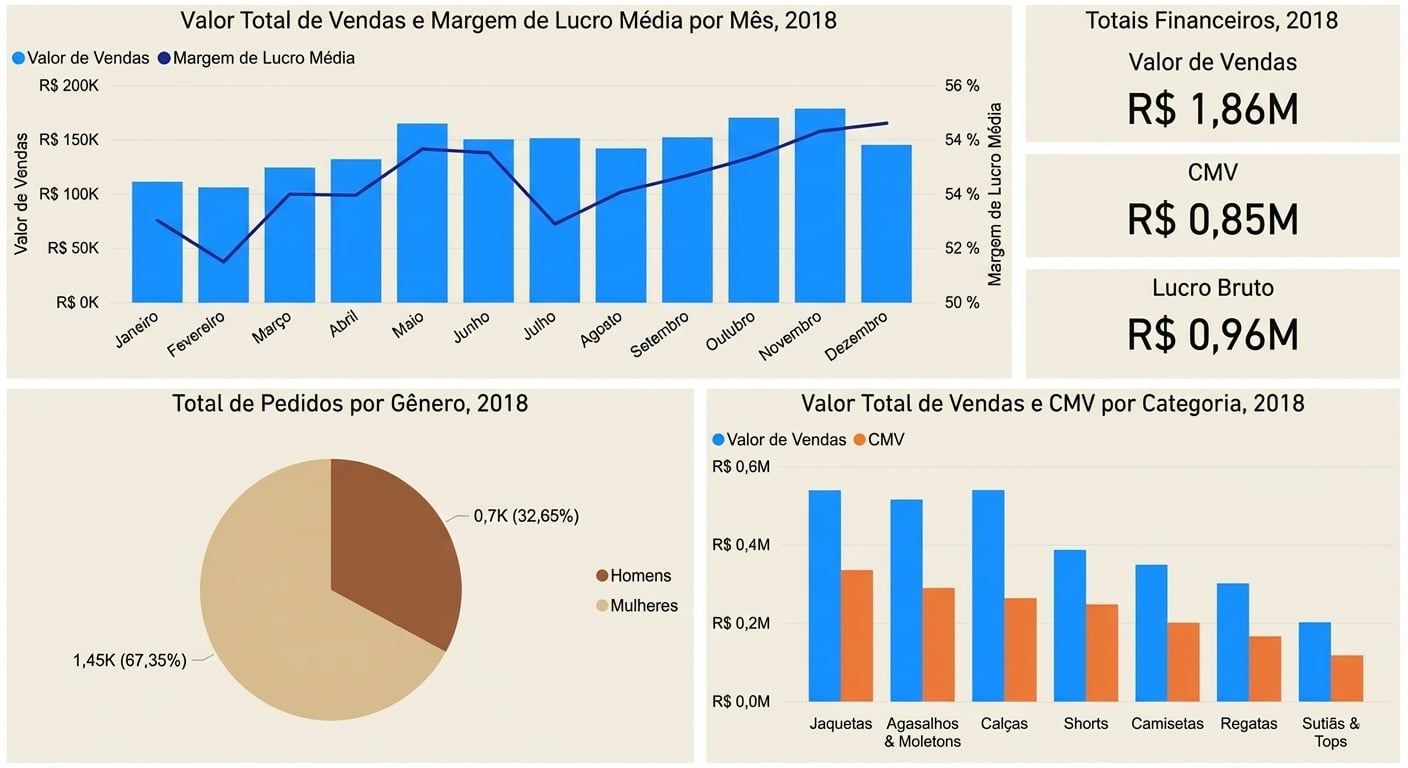
Pensando na nossa audiência