Reduza a carga cognitiva
Visualização de dados no Power BI

Iason Prassides
Content Developer at DataCamp
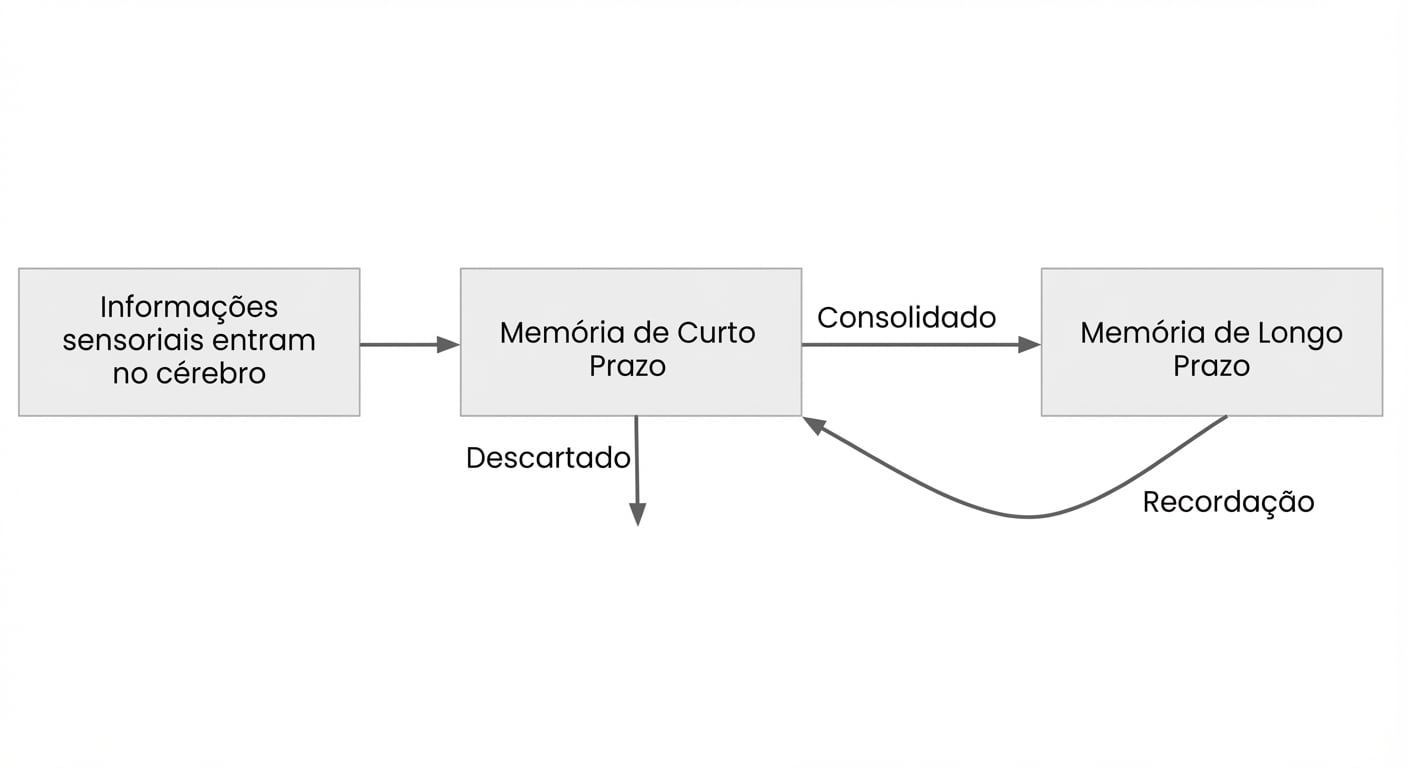
Memória de curto prazo
Esta é uma versão simplificada de como humanos processam sinais.
O “número mágico sete”
A pesquisa de George Miller mostrou que pessoas tendem a manter sete (mais ou menos dois) itens na memória de curto prazo ao mesmo tempo.
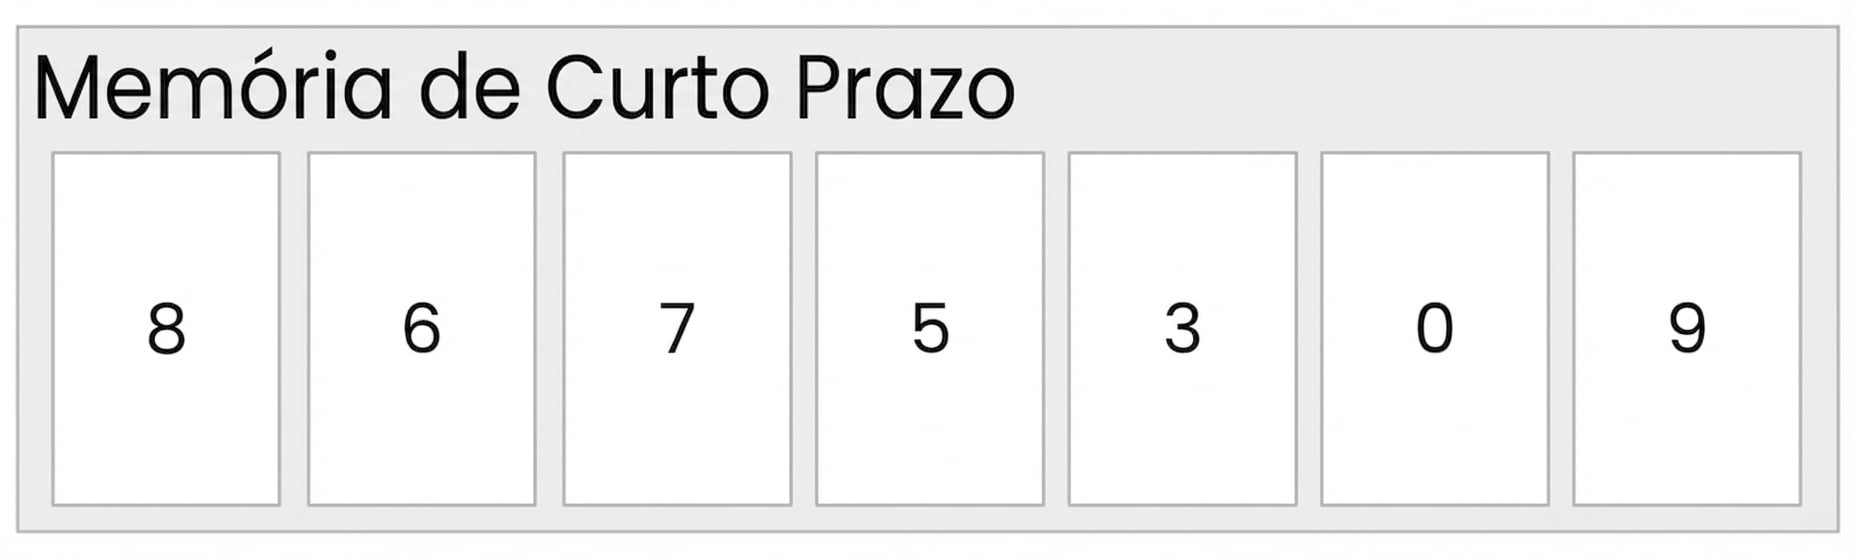
1 Miller, G. A. (1956). The magical number seven, plus or minus two: Some limits on our capacity for processing information. Psychological Review, 63(2), 81-97.
Ou talvez 4?
Pesquisas posteriores indicam que pode ser mais perto de 4 +/- 1, mas que podemos “agrupar” informações.
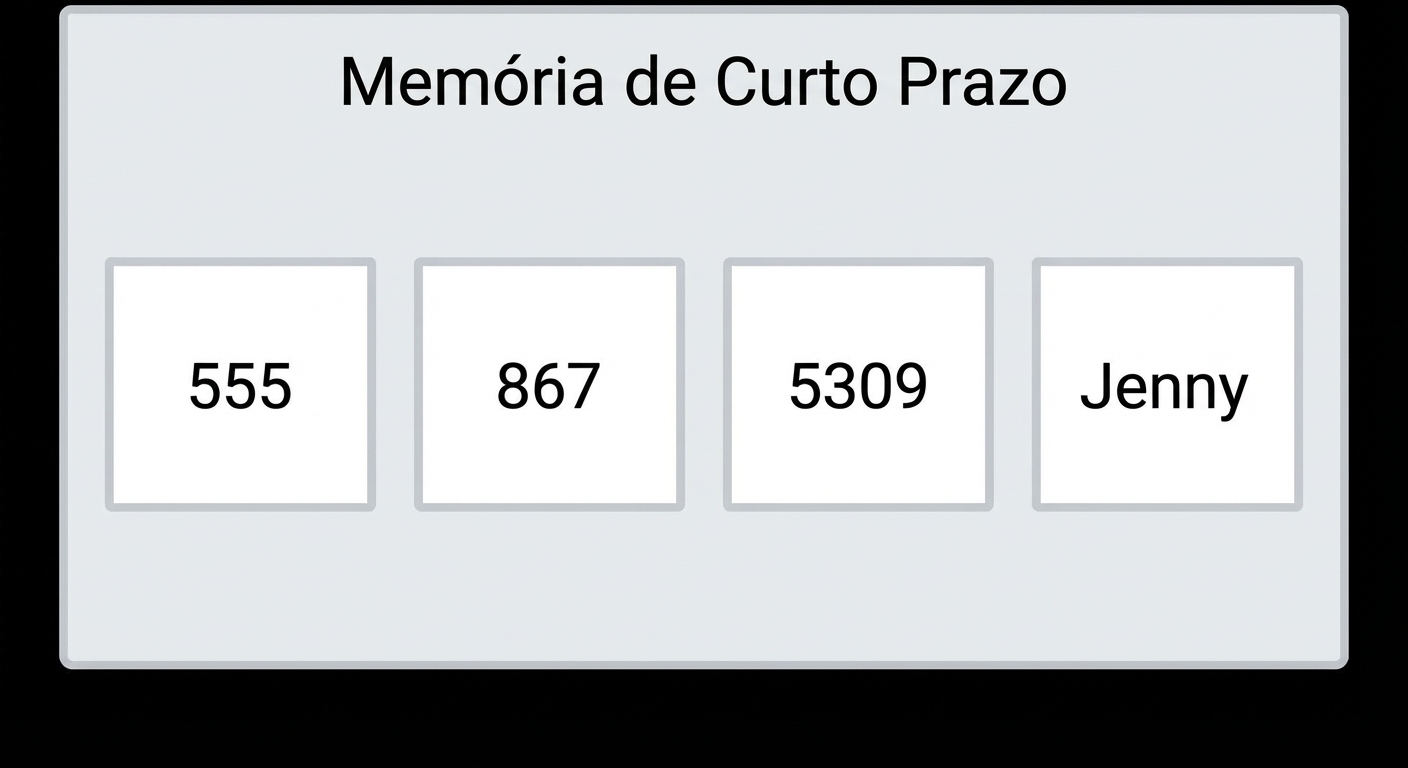
1 Cowan, N (2001). The magical number 4 in short-term memory: a reconsideration of mental storage capacity. Behavioral Brain Science, 24(1), 87-114.
Carga cognitiva
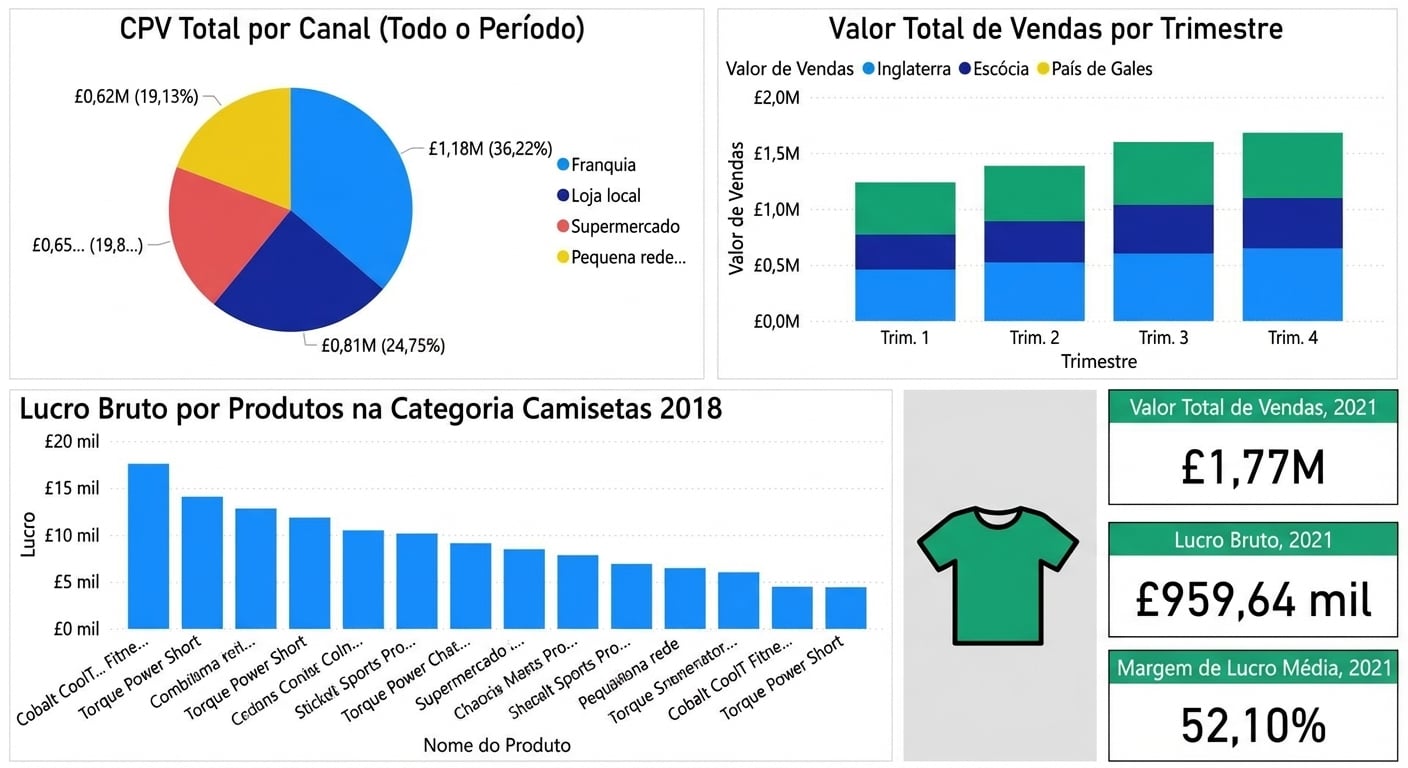
Reduzindo a carga cognitiva
Vitórias rápidas para reduzir a carga cognitiva:
- Ajuste a página ao seu público
- Uma história por página de relatório
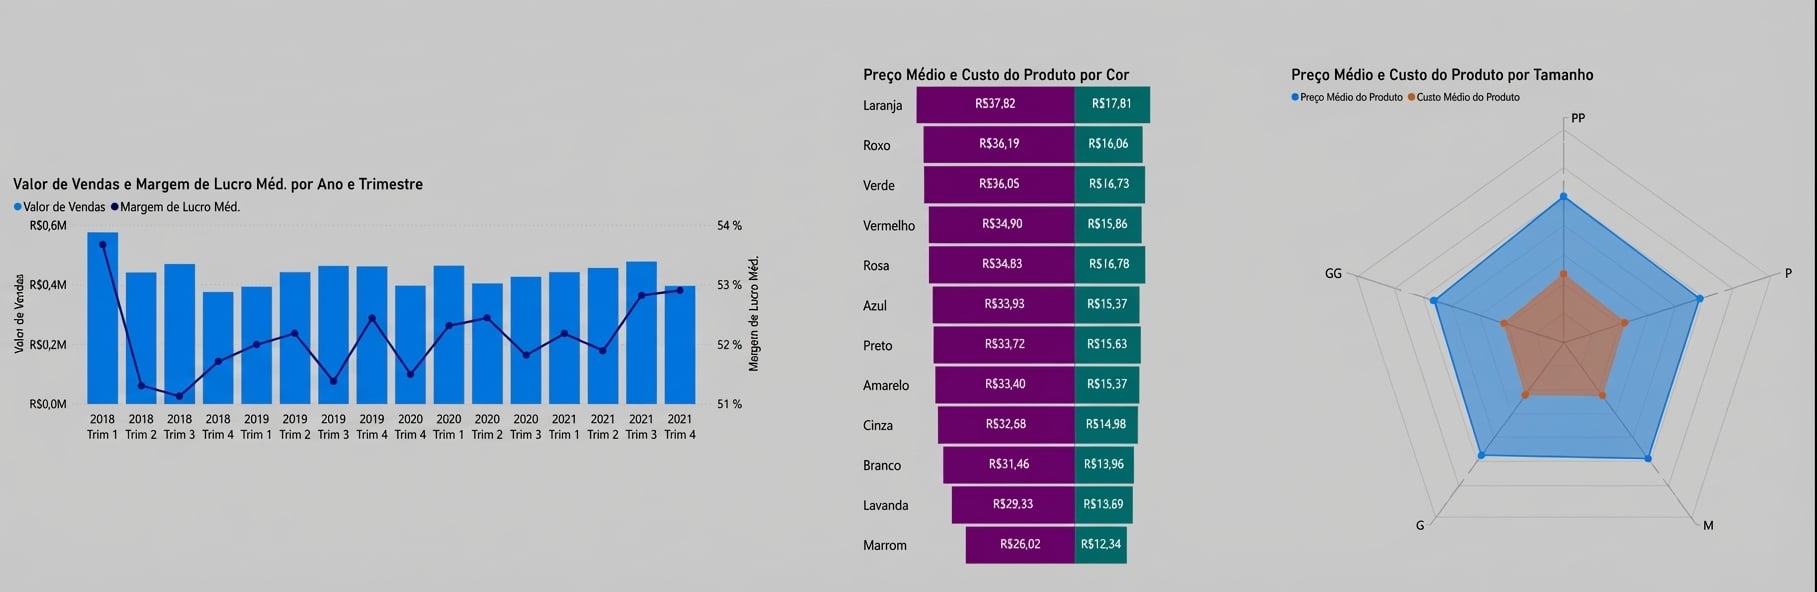
- Equilibre visuais ricos em informação sem confundir o público
Visuais personalizados no Power BI
Visuais personalizados podem ser carregados em um relatório do Power BI.

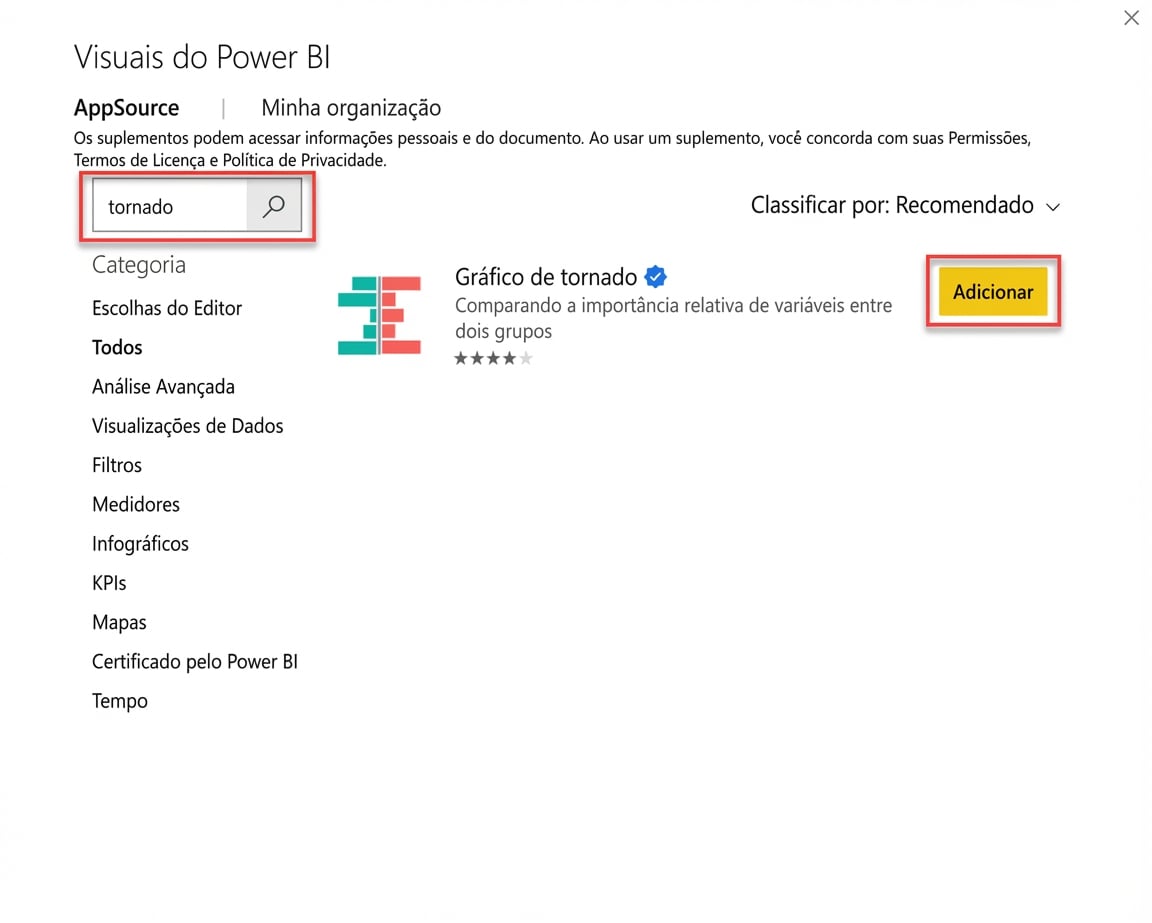
Microsoft AppSource
O Microsoft AppSource é um marketplace centralizado para visuais personalizados do Power BI.
Pensando no nosso público