Measures of spread

Introduction to Statistics in R

Maggie Matsui

Content Developer, DataCamp

What is spread?

Two histograms: one that's narrow with data only spanning a few values, one that's wider with data spanning more values.

Introduction to Statistics in R

Variance

Average distance from each data point to the data's mean A dot plot of 7 data points with a black line in the middle representing mean.

Introduction to Statistics in R

Calculating the variance

A dot plot of 7 data points with a black line in the middle representing mean. Arrows are drawn between each dot and the middle line.

dists <- msleep$sleep_total - mean(msleep$sleep_total)
dists
1.66626506  6.56626506 ... -4.13373494  2.06626506 -0.63373494
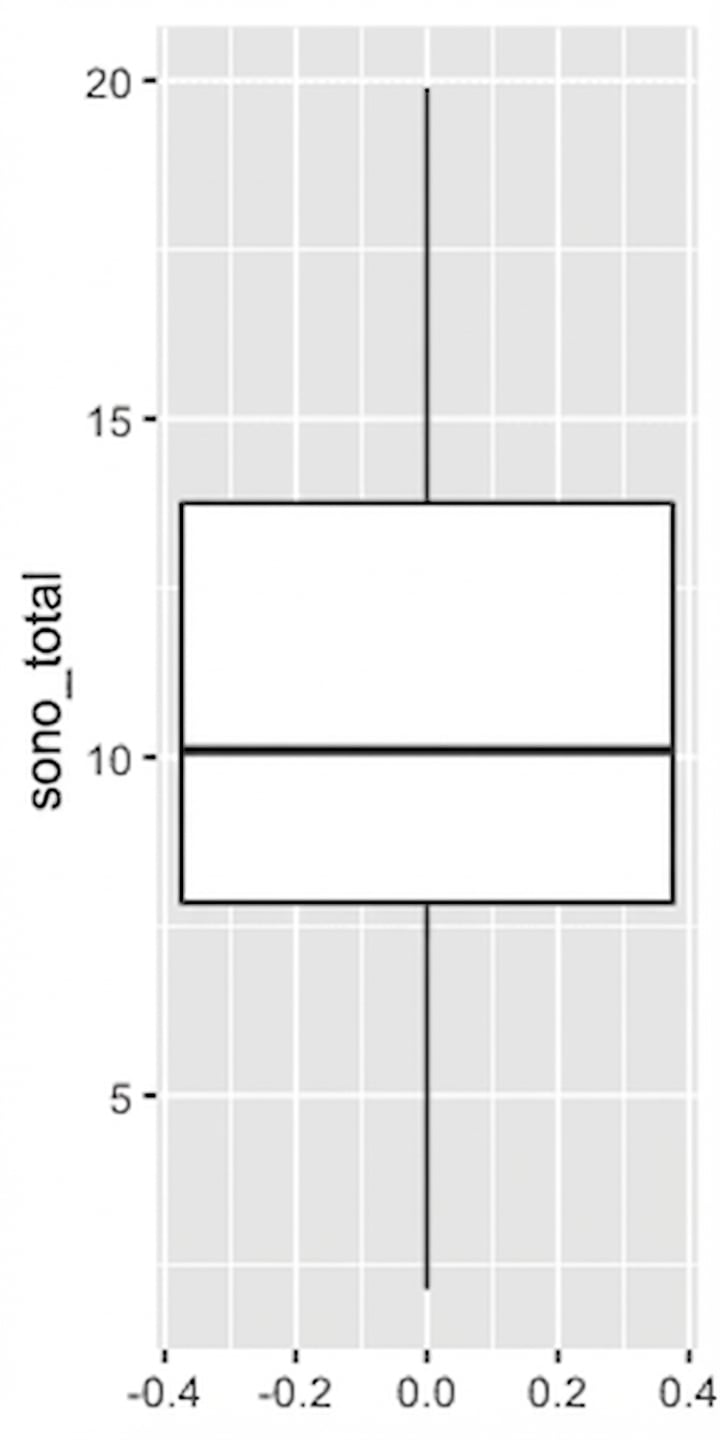
Introduction to Statistics in R

Calculating the variance

squared_dists <- (dists)^2
2.776439251 43.115836841 ... 17.087764552  4.269451299  0.401619974
sum_sq_dists <- sum(squared_dists)
sum_sq_dists
1624.066
Introduction to Statistics in R

Calculating the variance

sum_sq_dists/82
19.80568
var(msleep$sleep_total)
19.80568
Introduction to Statistics in R

Standard deviation

sqrt(var(msleep$sleep_total))
4.450357
# Standard deviation of 'sleep_total'
sd(msleep$sleep_total)
4.450357
Introduction to Statistics in R

Mean absolute deviation

dists <- msleep$sleep_total - mean(msleep$sleep_total)
mean(abs(dists))
3.566701


Standard deviation vs. mean absolute deviation

  • SD squares distances, penalizing longer distances more than shorter ones.
  • MAD penalizes each distance equally.
  • One isn't better than the other, but SD is more common than MAD.
Introduction to Statistics in R

Quartiles

quantile(msleep$sleep_total)
   0%   25%   50%   75%  100% 
 1.90  7.85 10.10 13.75 19.90

Second quartile/50th percentile = median

Introduction to Statistics in R

Boxplots use quartiles

ggplot(msleep, aes(y = sleep_total)) +
  geom_boxplot()

A boxplot of mammals' total sleep time

Introduction to Statistics in R

Quantiles

quantile(msleep$sleep_total, probs = c(0, 0.2, 0.4, 0.6, 0.8, 1))
   0%   20%   40%   60%   80%  100% 
 1.90  6.24  9.48 11.14 14.40 19.90

seq(from, to, by)

quantile(msleep$sleep_total, probs = seq(0, 1, 0.2))
   0%   20%   40%   60%   80%  100% 
 1.90  6.24  9.48 11.14 14.40 19.90
Introduction to Statistics in R

Interquartile range (IQR)

Height of the box in a boxplot

iqr = quantile(msleep$sleep_total, 0.75) - quantile(msleep$sleep_total, 0.25)
iqr
75%
5.9
Introduction to Statistics in R

Outliers

Outlier: data point that is substantially different from the others

How do we know what a substantial difference is? A data point is an outlier if:

  • $\text{data} < \text{Q1} - 1.5\times\text{IQR}$    or
  • $\text{data} > \text{Q3} + 1.5\times\text{IQR}$
Introduction to Statistics in R

Finding outliers

iqr <- quantile(msleep$bodywt, 0.75) - quantile(msleep$bodywt, 0.25)

lower_threshold <- quantile(msleep$bodywt, 0.25) - 1.5 * iqr upper_threshold<- quantile(msleep$bodywt, 0.75) + 1.5 * iqr
msleep %>% filter(bodywt < lower_threshold | bodywt > upper_threshold ) %>% 
  select(name, vore, sleep_total, bodywt)
# A tibble: 11 x 4
   name                 vore  sleep_total bodywt
   <chr>                <chr>       <dbl>  <dbl> 
 1 Cow                  herbi         4      600 
 2 Asian elephant       herbi         3.9   2547 
 3 Horse                herbi         2.9    521 
 ...
Introduction to Statistics in R

Let's practice!

Introduction to Statistics in R

Preparing Video For Download...