O verbo relocate
Manipulação de dados com o dplyr

James Chapman
Curriculum Manager, DataCamp
Relocate
- Mude posições de colunas
- Sintaxe rápida e eficiente
counties
# A tibble: 3,138 × 40
   census_id state   county   region metro population   men women hispanic white
   <chr>     <chr>   <chr>    <chr>  <chr>      <dbl> <dbl> <dbl>    <dbl> <dbl>
 1 1001      Alabama Autauga  South  Metro      55221 26745 28476      2.6  75.8
 2 1003      Alabama Baldwin  South  Metro     195121 95314 99807      4.5  83.1
 3 1005      Alabama Barbour  South  Nonm…      26932 14497 12435      4.6  46.2
 4 1007      Alabama Bibb     South  Metro      22604 12073 10531      2.2  74.5
 5 1009      Alabama Blount   South  Metro      57710 28512 29198      8.6  87.9
 6 1011      Alabama Bullock  South  Nonm…      10678  5660  5018      4.4  22.2
 7 1013      Alabama Butler   South  Nonm…      20354  9502 10852      1.2  53.3
 8 1015      Alabama Calhoun  South  Metro     116648 56274 60374      3.5  73
 9 1017      Alabama Chambers South  Nonm…      34079 16258 17821      0.4  57.3
10 1019      Alabama Cherokee South  Nonm…      26008 12975 13033      1.5  91.7
# … with 3,128 more rows, and 30 more variables: black <dbl>, native <dbl>, …
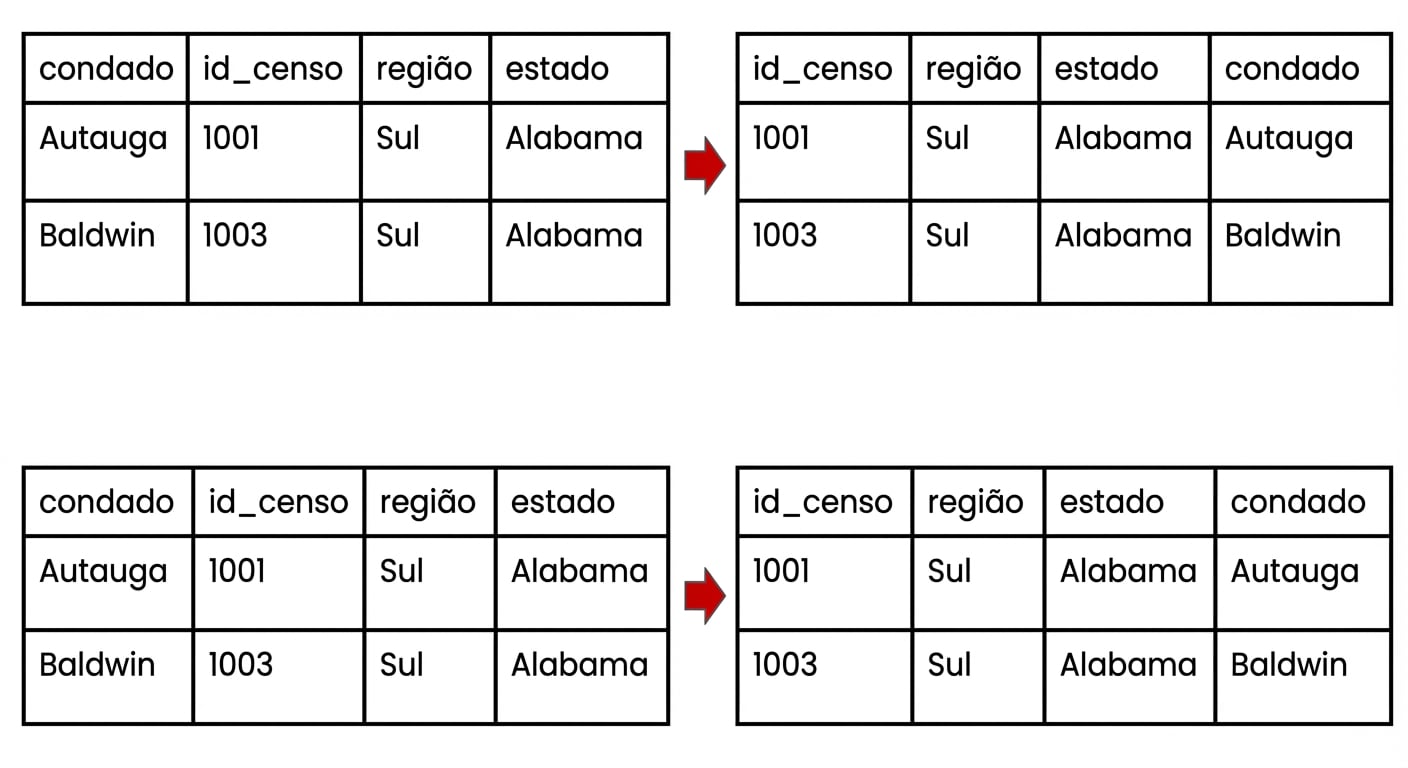
Movendo para .before
counties %>%
  relocate(region, .before = state)
# A tibble: 3,138 × 40
   census_id region state   county   metro population   men women hispanic white
   <chr>     <chr>  <chr>   <chr>    <chr>      <dbl> <dbl> <dbl>    <dbl> <dbl>
 1 1001      South  Alabama Autauga  Metro      55221 26745 28476      2.6  75.8
 2 1003      South  Alabama Baldwin  Metro     195121 95314 99807      4.5  83.1
 3 1005      South  Alabama Barbour  Nonm…      26932 14497 12435      4.6  46.2
 4 1007      South  Alabama Bibb     Metro      22604 12073 10531      2.2  74.5
 5 1009      South  Alabama Blount   Metro      57710 28512 29198      8.6  87.9
 6 1011      South  Alabama Bullock  Nonm…      10678  5660  5018      4.4  22.2
 7 1013      South  Alabama Butler   Nonm…      20354  9502 10852      1.2  53.3
 8 1015      South  Alabama Calhoun  Metro     116648 56274 60374      3.5  73
 9 1017      South  Alabama Chambers Nonm…      34079 16258 17821      0.4  57.3
10 1019      South  Alabama Cherokee Nonm…      26008 12975 13033      1.5  91.7
# … with 3,128 more rows, and 30 more variables: black <dbl>, native <dbl>, …
Movendo para .after
counties %>%
  relocate(state, .after = region)
# A tibble: 3,138 × 40
   census_id county   region state   metro population   men women hispanic white
   <chr>     <chr>    <chr>  <chr>   <chr>      <dbl> <dbl> <dbl>    <dbl> <dbl>
 1 1001      Autauga  South  Alabama Metro      55221 26745 28476      2.6  75.8
 2 1003      Baldwin  South  Alabama Metro     195121 95314 99807      4.5  83.1
 3 1005      Barbour  South  Alabama Nonm…      26932 14497 12435      4.6  46.2
 4 1007      Bibb     South  Alabama Metro      22604 12073 10531      2.2  74.5
 5 1009      Blount   South  Alabama Metro      57710 28512 29198      8.6  87.9
 6 1011      Bullock  South  Alabama Nonm…      10678  5660  5018      4.4  22.2
 7 1013      Butler   South  Alabama Nonm…      20354  9502 10852      1.2  53.3
 8 1015      Calhoun  South  Alabama Metro     116648 56274 60374      3.5  73
 9 1017      Chambers South  Alabama Nonm…      34079 16258 17821      0.4  57.3
10 1019      Cherokee South  Alabama Nonm…      26008 12975 13033      1.5  91.7
# … with 3,128 more rows, and 30 more variables: black <dbl>, native <dbl>, …
relocate() + seletores auxiliares
counties %>%
  relocate(census_id, .after = last_col())
# A tibble: 3,138 × 40
   state  county region metro population   men women hispanic white black native
   <chr>  <chr>  <chr>  <chr>      <dbl> <dbl> <dbl>    <dbl> <dbl> <dbl>  <dbl>
 1 Alaba… Autau… South  Metro      55221 26745 28476      2.6  75.8  18.5    0.4
 2 Alaba… Baldw… South  Metro     195121 95314 99807      4.5  83.1   9.5    0.6
 3 Alaba… Barbo… South  Nonm…      26932 14497 12435      4.6  46.2  46.7    0.2
 4 Alaba… Bibb   South  Metro      22604 12073 10531      2.2  74.5  21.4    0.4
 5 Alaba… Blount South  Metro      57710 28512 29198      8.6  87.9   1.5    0.3
 6 Alaba… Bullo… South  Nonm…      10678  5660  5018      4.4  22.2  70.7    1.2
 7 Alaba… Butler South  Nonm…      20354  9502 10852      1.2  53.3  43.8    0.1
 8 Alaba… Calho… South  Metro     116648 56274 60374      3.5  73    20.3    0.2
 9 Alaba… Chamb… South  Nonm…      34079 16258 17821      0.4  57.3  40.3    0.2
10 Alaba… Chero… South  Nonm…      26008 12975 13033      1.5  91.7   4.8    0.6
# … with 3,128 more rows, and 29 more variables: asian <dbl>, … census_id <chr>
select() vs. relocate()?
select()
- Mantém só as colunas indicadas
- Bom para filtrar e mover
counties %>%
  select(region, state, county)
relocate()
- Mantém todas as colunas
- Melhor para só mover
counties %>%
  relocate(region, .before = state)
Vamos praticar!
Manipulação de dados com o dplyr

