Uma história de duas variáveis
Introdução à Regressão em R

Richie Cotton
Data Evangelist at DataCamp
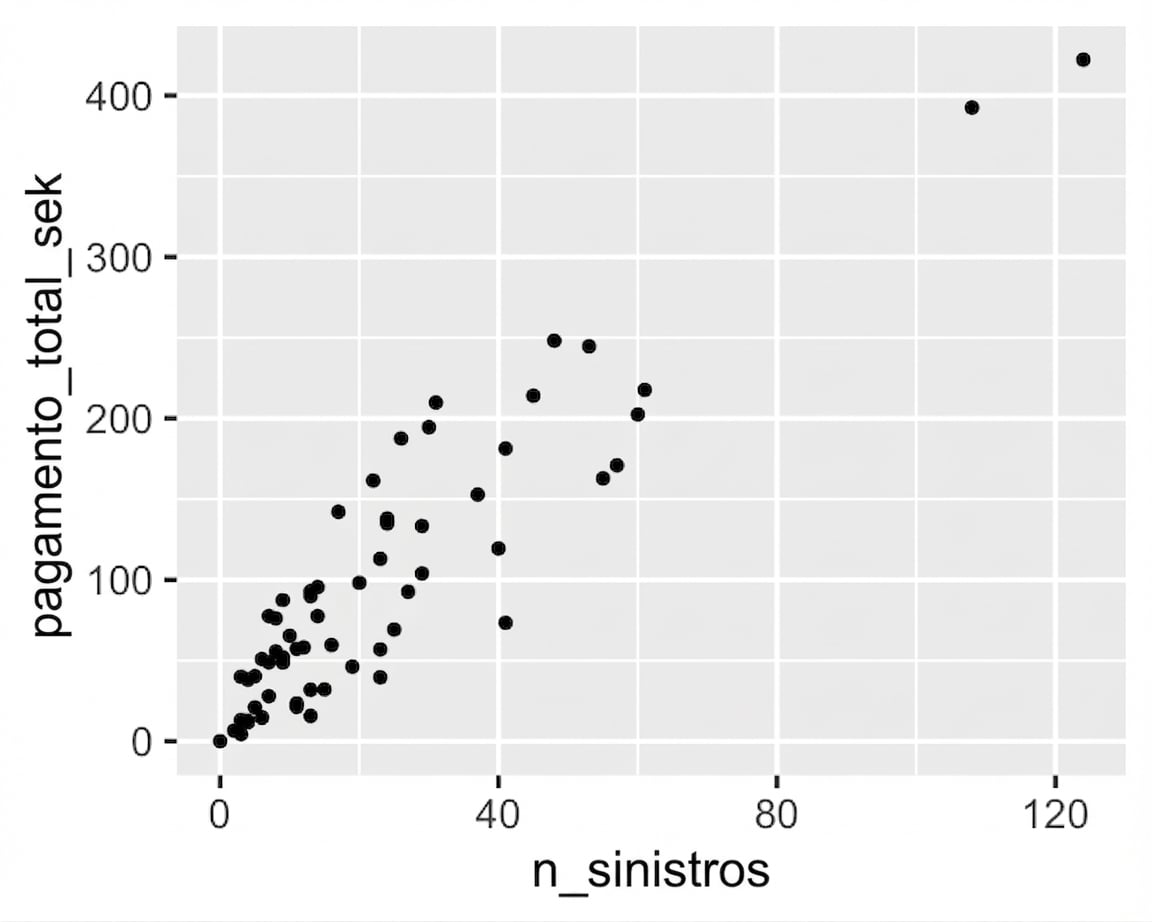
Visualizando pares de variáveis
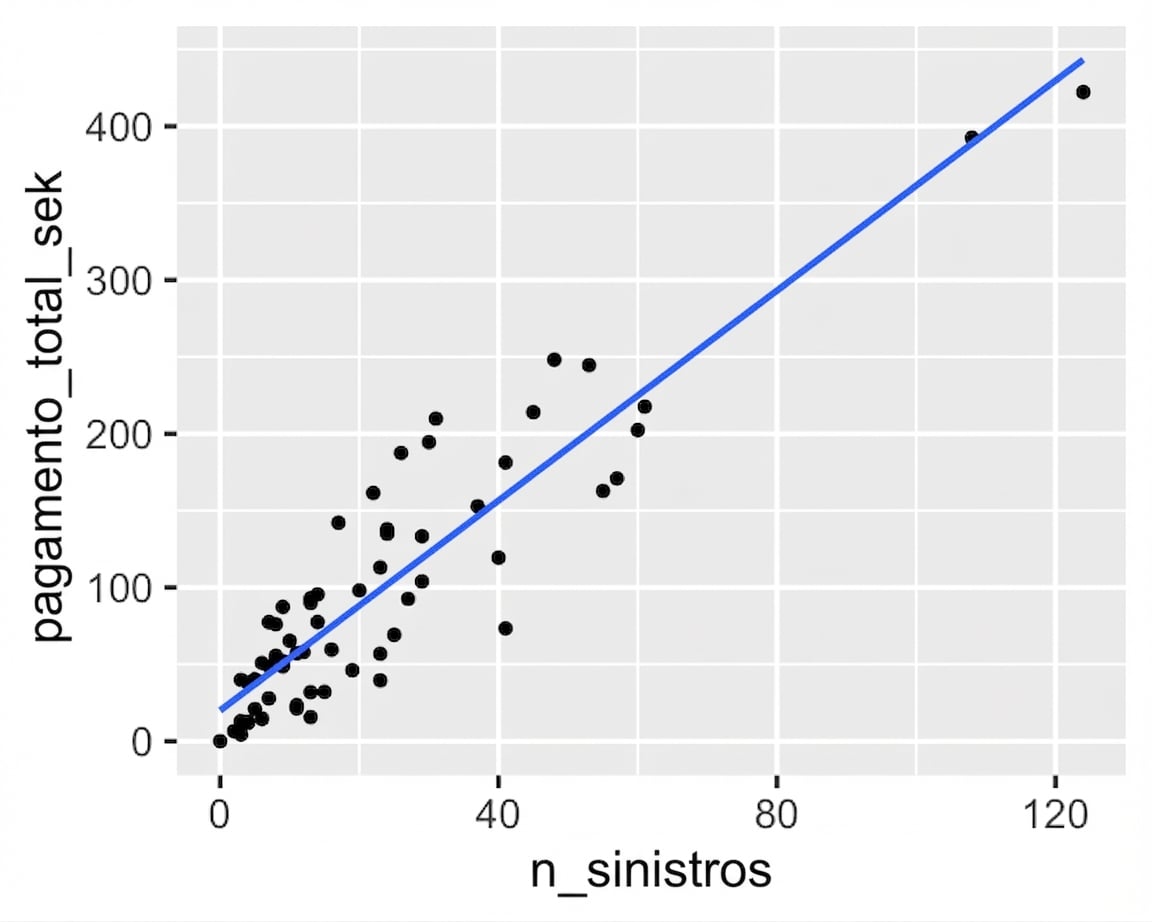
Adicionando uma linha de tendência linear
Introdução à Regressão em R
Richie Cotton
Data Evangelist at DataCamp

