Chi-square test of independence
Teste de hipóteses em Python

James Chapman
Curriculum Manager, DataCamp
Revisiting the proportion test
age_by_hobbyist = stack_overflow.groupby("age_cat")['hobbyist'].value_counts()
age_cat      hobbyist
At least 30  Yes          812
             No           238
Under 30     Yes         1021
             No           190
Name: hobbyist, dtype: int64
from statsmodels.stats.proportion import proportions_ztest
n_hobbyists = np.array([812, 1021])
n_rows = np.array([812 + 238, 1021 + 190])
stat, p_value = proportions_ztest(count=n_hobbyists, nobs=n_rows,
                                  alternative="two-sided")
(-4.223691463320559, 2.403330142685068e-05)
Independence of variables
Previous hypothesis test result: evidence that hobbyistand age_cat are associated
Statistical independence - proportion of successes in the response variable is the same across all categories of the explanatory variable
Test for independence of variables
import pingouin
expected, observed, stats = pingouin.chi2_independence(data=stack_overflow, x='hobbyist',
                                                       y='age_cat', correction=False)
print(stats)
                 test    lambda       chi2  dof      pval    cramer     power
0             pearson  1.000000  17.839570  1.0  0.000024  0.088826  0.988205
1        cressie-read  0.666667  17.818114  1.0  0.000024  0.088773  0.988126
2      log-likelihood  0.000000  17.802653  1.0  0.000025  0.088734  0.988069
3       freeman-tukey -0.500000  17.815060  1.0  0.000024  0.088765  0.988115
4  mod-log-likelihood -1.000000  17.848099  1.0  0.000024  0.088848  0.988236
5              neyman -2.000000  17.976656  1.0  0.000022  0.089167  0.988694
$\chi^2$ statistic = 17.839570 = $(-4.223691463320559)^2$ = ($z$-score)$^2$
Job satisfaction and age category
stack_overflow['age_cat'].value_counts()
Under 30       1211
At least 30    1050
Name: age_cat, dtype: int64
stack_overflow['job_sat'].value_counts()
Very satisfied           879
Slightly satisfied       680
Slightly dissatisfied    342
Neither                  201
Very dissatisfied        159
Name: job_sat, dtype: int64
Declaring the hypotheses
$H_{0}$: Age categories are independent of job satisfaction levels
$H_{A}$: Age categories are not independent of job satisfaction levels
alpha = 0.1
- Test statistic denoted $\chi^{2}$
- Assuming independence, how far away are the observed results from the expected values?
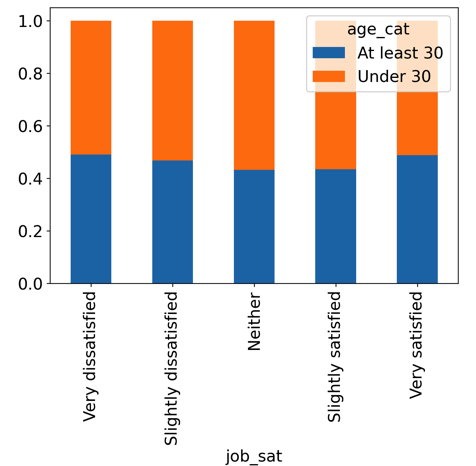
Exploratory visualization: proportional stacked bar plot
props = stack_overflow.groupby('job_sat')['age_cat'].value_counts(normalize=True)wide_props = props.unstack()wide_props.plot(kind="bar", stacked=True)
Exploratory visualization: proportional stacked bar plot
Chi-square independence test
import pingouin
expected, observed, stats = pingouin.chi2_independence(data=stack_overflow, x="job_sat", y="age_cat")
print(stats)
                 test    lambda      chi2  dof      pval    cramer     power
0             pearson  1.000000  5.552373  4.0  0.235164  0.049555  0.437417
1        cressie-read  0.666667  5.554106  4.0  0.235014  0.049563  0.437545
2      log-likelihood  0.000000  5.558529  4.0  0.234632  0.049583  0.437871
3       freeman-tukey -0.500000  5.562688  4.0  0.234274  0.049601  0.438178
4  mod-log-likelihood -1.000000  5.567570  4.0  0.233854  0.049623  0.438538
5              neyman -2.000000  5.579519  4.0  0.232828  0.049676  0.439419
Degrees of freedom:
$(\text{No. of response categories} - 1) \times (\text{No. of explanatory categories} - 1)$
$(2 - 1) * (5 - 1) = 4$
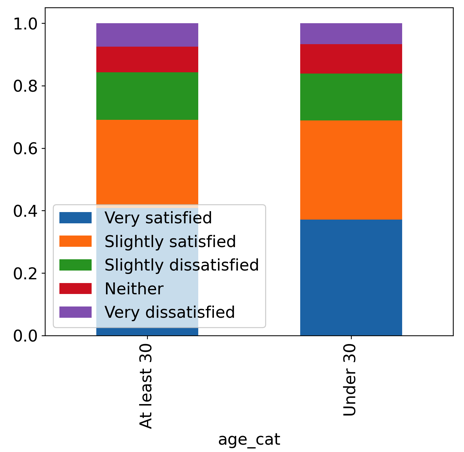
Swapping the variables?
props = stack_overflow.groupby('age_cat')['job_sat'].value_counts(normalize=True)
wide_props = props.unstack()
wide_props.plot(kind="bar", stacked=True)
Swapping the variables?
chi-square both ways
expected, observed, stats = pingouin.chi2_independence(data=stack_overflow, x="age_cat", y="job_sat")
print(stats[stats['test'] == 'pearson'])
      test  lambda      chi2  dof      pval    cramer     power
0  pearson     1.0  5.552373  4.0  0.235164  0.049555  0.437417
Ask: Are the variables X and Y independent?
Not: Is variable X independent from variable Y?
What about direction and tails?
- Observed and expected counts squared must be non-negative
- chi-square tests are almost always right-tailed $^{1}$
1 Left-tailed chi-square tests are used in statistical forensics to detect if a fit is suspiciously good because the data was fabricated. Chi-square tests of variance can be two-tailed. These are niche uses, though.
Let's practice!
Teste de hipóteses em Python

