Hypothesis tests and z-scores

Hypothesis Testing in Python

James Chapman

Curriculum Manager, DataCamp

A/B testing

  • In 2013, Electronic Arts (EA) released SimCity 5
  • They wanted to increase pre-orders of the game
  • They used A/B testing to test different advertising scenarios
  • This involves splitting users into control and treatment groups

Electronic Arts building

1 Image credit: "Electronic Arts" by majaX1 CC BY-NC-SA 2.0
Hypothesis Testing in Python

Retail webpage A/B test

Control:

SimCity webpage with banner that says "pre-order and get $20 off your next purchase"

Treatment:

SimCity webpage without banner

Hypothesis Testing in Python

A/B test results

  • The treatment group (no ad) got 43.4% more purchases than the control group (with ad)
  • Intuition that "showing an ad would increase sales" was false
  • Was this result statistically significant or just chance?
  • Need EA's data to determine this
  • Techniques from Sampling in Python + this course to do so
Hypothesis Testing in Python

Stack Overflow Developer Survey 2020

import pandas as pd
print(stack_overflow)
      respondent  age_1st_code  ...   age  hobbyist
0           36.0          30.0  ...  34.0       Yes
1           47.0          10.0  ...  53.0       Yes
2           69.0          12.0  ...  25.0       Yes
3          125.0          30.0  ...  41.0       Yes
4          147.0          15.0  ...  28.0        No
...          ...           ...  ...   ...       ...
2259     62867.0          13.0  ...  33.0       Yes
2260     62882.0          13.0  ...  28.0       Yes

[2261 rows x 8 columns]
Hypothesis Testing in Python

Hypothesizing about the mean

A hypothesis:

The mean annual compensation of the population of data scientists is $110,000

The point estimate (sample statistic):

mean_comp_samp = stack_overflow['converted_comp'].mean()
119574.71738168952
Hypothesis Testing in Python

Generating a bootstrap distribution

import numpy as np

# Step 3. Repeat steps 1 & 2 many times, appending to a list so_boot_distn = [] for i in range(5000): so_boot_distn.append(
# Step 2. Calculate point estimate np.mean(
# Step 1. Resample stack_overflow.sample(frac=1, replace=True)['converted_comp']
)
)
1 Bootstrap distributions are taught in Chapter 4 of Sampling in Python
Hypothesis Testing in Python

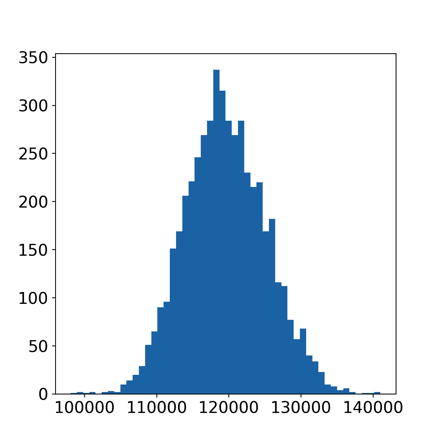
Visualizing the bootstrap distribution

import matplotlib.pyplot as plt
plt.hist(so_boot_distn, bins=50)
plt.show()

Histogram of the bootstrap distribution - it's bell shaped and ranges roughly between 110000 and 140000

Hypothesis Testing in Python

Standard error

std_error = np.std(so_boot_distn, ddof=1)
5607.997577378606
Hypothesis Testing in Python

z-scores

$\text{standardized value} = \dfrac{\text{value} - \text{mean}}{\text{standard deviation}}$

$z = \dfrac{\text{sample stat} - \text{hypoth. param. value}}{\text{standard error}}$

Hypothesis Testing in Python

$z = \dfrac{\text{sample stat} - \text{hypoth. param. value}}{\text{standard error}}$

stack_overflow['converted_comp'].mean()
119574.71738168952
mean_comp_hyp = 110000
std_error
5607.997577378606
z_score = (mean_comp_samp - mean_comp_hyp) / std_error
1.7073326529796957
Hypothesis Testing in Python

Testing the hypothesis

  • Is 1.707 a high or low number?
  • This is the goal of the course!
Hypothesis Testing in Python

Testing the hypothesis

  • Is 1.707 a high or low number?
  • This is the goal of the course!


Hypothesis testing use case:


Determine whether sample statistics are close to or far away from expected (or "hypothesized" values)

Hypothesis Testing in Python

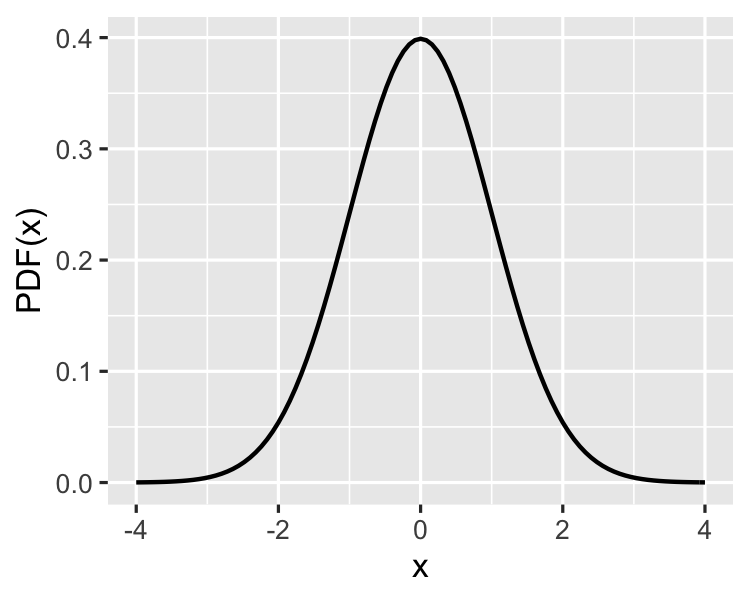
Standard normal (z) distribution

Standard normal distribution: normal distribution with mean = 0 + standard deviation = 1

Density plot of the PDF for the standard normal distribution

Hypothesis Testing in Python

Let's practice!

Hypothesis Testing in Python

Preparing Video For Download...