ANOVA tests
Teste de hipóteses em Python

James Chapman
Curriculum Manager, DataCamp
Job satisfaction: 5 categories
stack_overflow['job_sat'].value_counts()
Very satisfied           879
Slightly satisfied       680
Slightly dissatisfied    342
Neither                  201
Very dissatisfied        159
Name: job_sat, dtype: int64
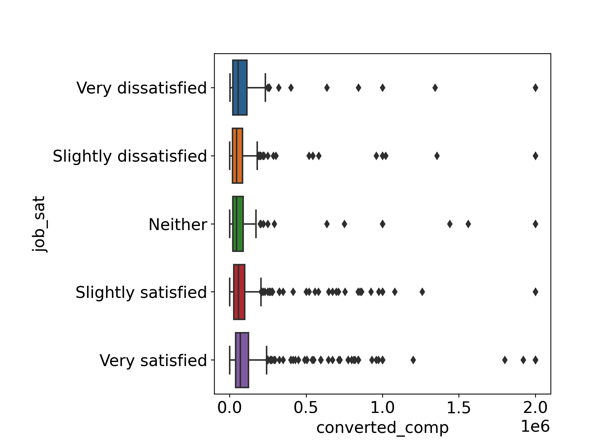
Visualizing multiple distributions
Is mean annual compensation different for different levels of job satisfaction?
import seaborn as sns
import matplotlib.pyplot as plt
sns.boxplot(x="converted_comp",
            y="job_sat",
            data=stack_overflow)
plt.show()
Analysis of variance (ANOVA)
- A test for differences between groups
alpha = 0.2pingouin.anova(data=stack_overflow, dv="converted_comp", between="job_sat")
    Source  ddof1  ddof2         F     p-unc       np2
0  job_sat      4   2256  4.480485  0.001315  0.007882
0.001315$< \alpha$- At least two categories have significantly different compensation
Pairwise tests
- $\mu_{\text{very dissatisfied}} \neq \mu_{\text{slightly dissatisfied}}$
- $\mu_{\text{very dissatisfied}} \neq \mu_{\text{neither}}$
- $\mu_{\text{very dissatisfied}} \neq \mu_{\text{slightly satisfied}}$
- $\mu_{\text{very dissatisfied}} \neq \mu_{\text{very satisfied}}$
- $\mu_{\text{slightly dissatisfied}} \neq \mu_{\text{neither}}$
- $\mu_{\text{slightly dissatisfied}} \neq \mu_{\text{slightly satisfied}}$
- $\mu_{\text{slightly dissatisfied}} \neq \mu_{\text{very satisfied}}$
- $\mu_{\text{neither}} \neq \mu_{\text{slightly satisfied}}$
- $\mu_{\text{neither}} \neq \mu_{\text{very satisfied}}$
- $\mu_{\text{slightly satisfied}} \neq \mu_{\text{very satisfied}}$
Set significance level to $\alpha = 0.2$.
pairwise_tests()
pingouin.pairwise_tests(data=stack_overflow,
                        dv="converted_comp",
                        between="job_sat",
                        padjust="none")
  Contrast                   A                      B  Paired  Parametric  ...          dof  alternative     p-unc     BF10    hedges
0  job_sat  Slightly satisfied         Very satisfied   False        True  ...  1478.622799    two-sided  0.000064  158.564 -0.192931
1  job_sat  Slightly satisfied                Neither   False        True  ...   258.204546    two-sided  0.484088    0.114 -0.068513
2  job_sat  Slightly satisfied      Very dissatisfied   False        True  ...   187.153329    two-sided  0.215179    0.208 -0.145624
3  job_sat  Slightly satisfied  Slightly dissatisfied   False        True  ...   569.926329    two-sided  0.969491    0.074 -0.002719
4  job_sat      Very satisfied                Neither   False        True  ...   328.326639    two-sided  0.097286    0.337  0.120115
5  job_sat      Very satisfied      Very dissatisfied   False        True  ...   221.666205    two-sided  0.455627    0.126  0.063479
6  job_sat      Very satisfied  Slightly dissatisfied   False        True  ...   821.303063    two-sided  0.002166     7.43  0.173247
7  job_sat             Neither      Very dissatisfied   False        True  ...   321.165726    two-sided  0.585481    0.135 -0.058537
8  job_sat             Neither  Slightly dissatisfied   False        True  ...   367.730081    two-sided  0.547406    0.118  0.055707
9  job_sat   Very dissatisfied  Slightly dissatisfied   False        True  ...   247.570187    two-sided  0.259590    0.197  0.119131

[10 rows x 11 columns]
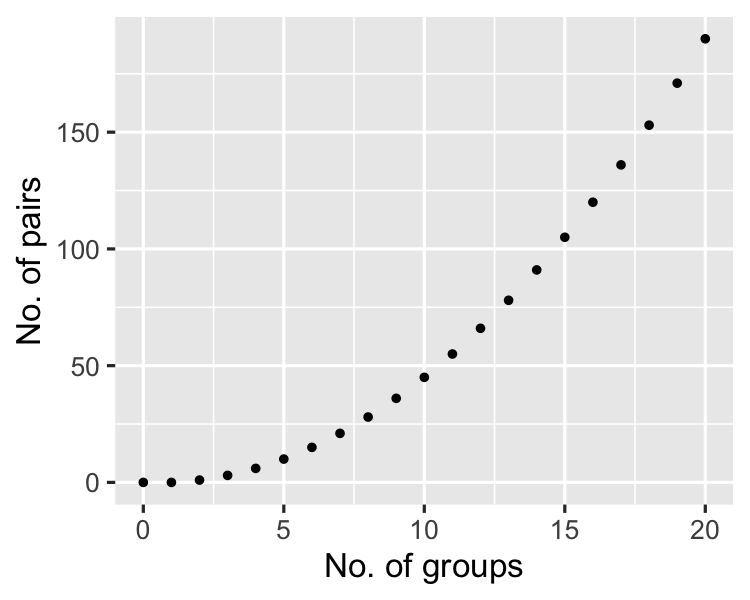
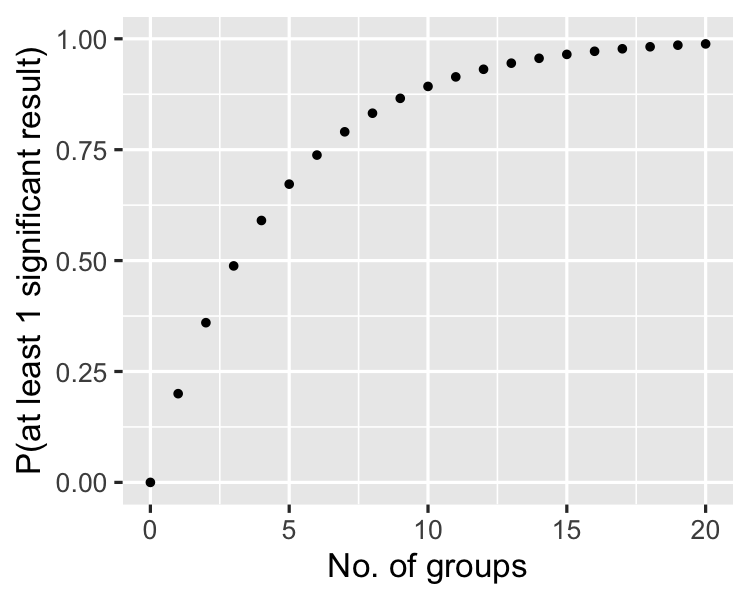
As the number of groups increases...
Bonferroni correction
pingouin.pairwise_tests(data=stack_overflow,
                        dv="converted_comp",
                        between="job_sat",
                        padjust="bonf")
  Contrast                   A                      B   ...     p-unc    p-corr p-adjust     BF10    hedges
0  job_sat  Slightly satisfied         Very satisfied   ...  0.000064  0.000638     bonf  158.564 -0.192931
1  job_sat  Slightly satisfied                Neither   ...  0.484088  1.000000     bonf    0.114 -0.068513
2  job_sat  Slightly satisfied      Very dissatisfied   ...  0.215179  1.000000     bonf    0.208 -0.145624
3  job_sat  Slightly satisfied  Slightly dissatisfied   ...  0.969491  1.000000     bonf    0.074 -0.002719
4  job_sat      Very satisfied                Neither   ...  0.097286  0.972864     bonf    0.337  0.120115
5  job_sat      Very satisfied      Very dissatisfied   ...  0.455627  1.000000     bonf    0.126  0.063479
6  job_sat      Very satisfied  Slightly dissatisfied   ...  0.002166  0.021659     bonf     7.43  0.173247
7  job_sat             Neither      Very dissatisfied   ...  0.585481  1.000000     bonf    0.135 -0.058537
8  job_sat             Neither  Slightly dissatisfied   ...  0.547406  1.000000     bonf    0.118  0.055707
9  job_sat   Very dissatisfied  Slightly dissatisfied   ...  0.259590  1.000000     bonf    0.197  0.119131

[10 rows x 11 columns]
More methods
padjust : string
Method used for testing and adjustment of pvalues.
'none': no correction [default]'bonf': one-step Bonferroni correction'sidak': one-step Sidak correction'holm': step-down method using Bonferroni adjustments'fdr_bh': Benjamini/Hochberg FDR correction'fdr_by': Benjamini/Yekutieli FDR correction
Let's practice!
Teste de hipóteses em Python

