Intervalos de confiança
Amostragem em Python

James Chapman
Curriculum Manager, DataCamp
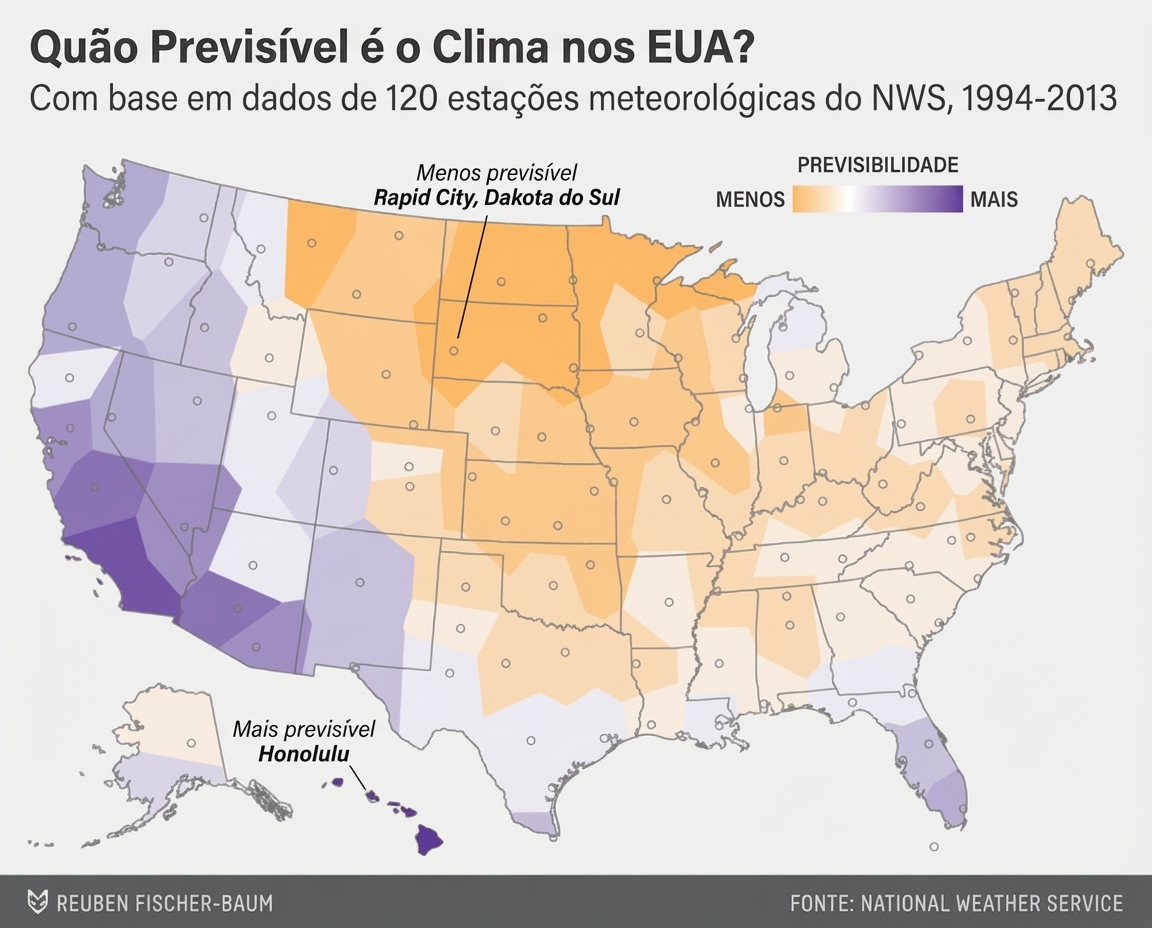
Prevendo o tempo
Distribuição bootstrap do sabor médio
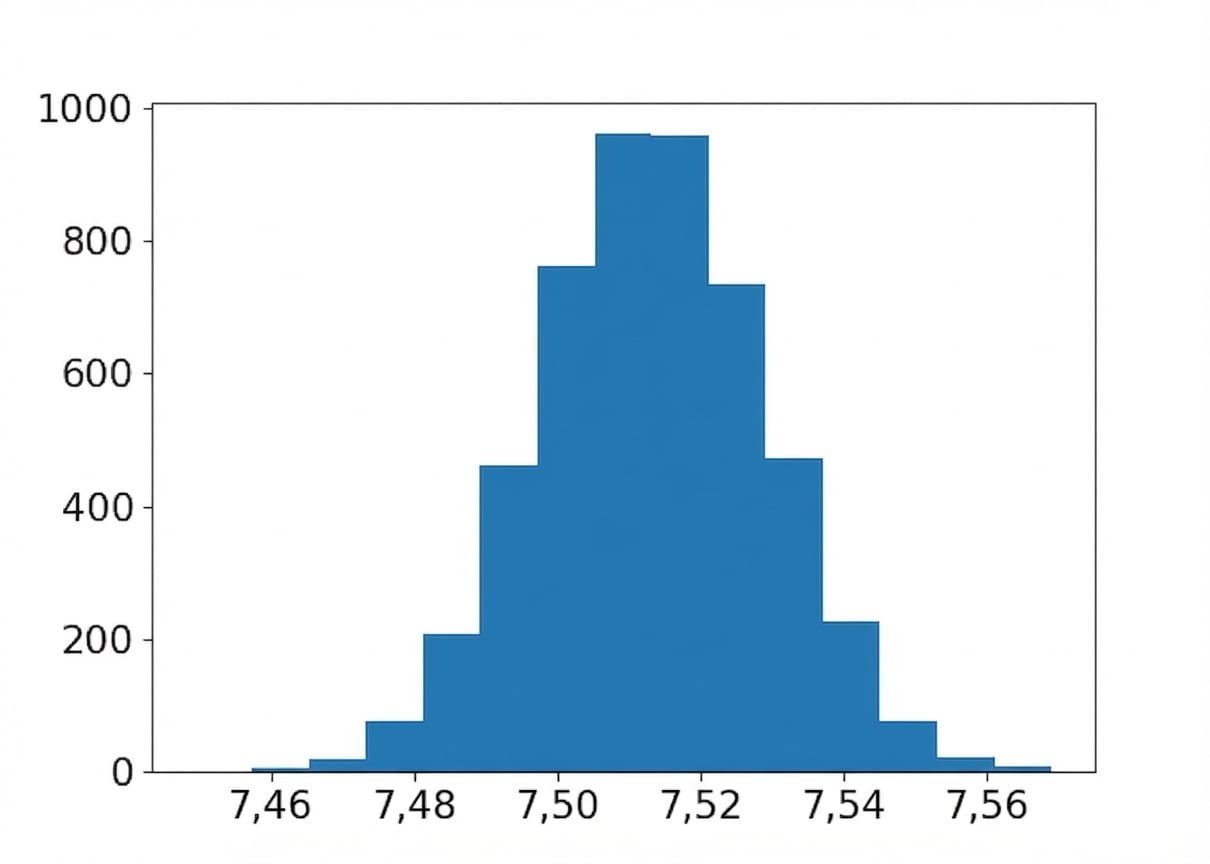
Média das reamostragens
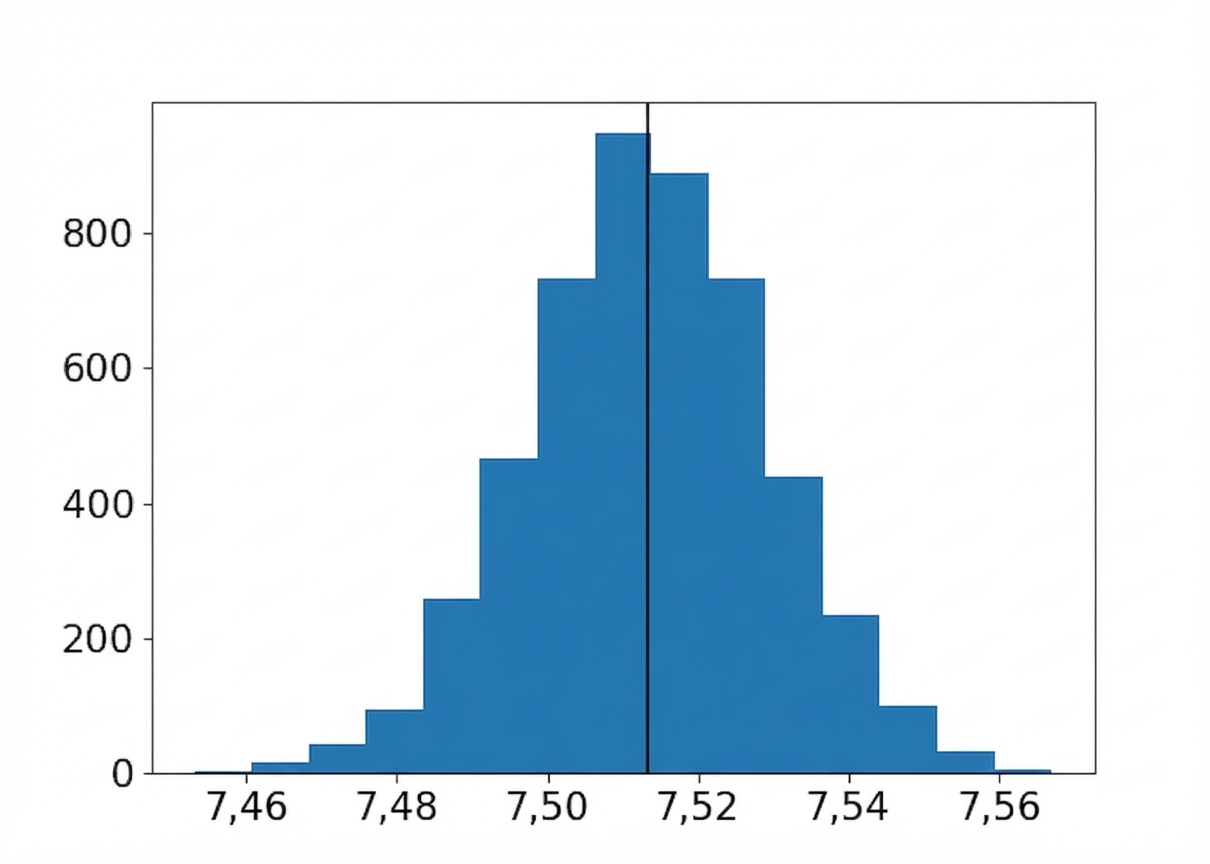
Média ± um desvio-padrão

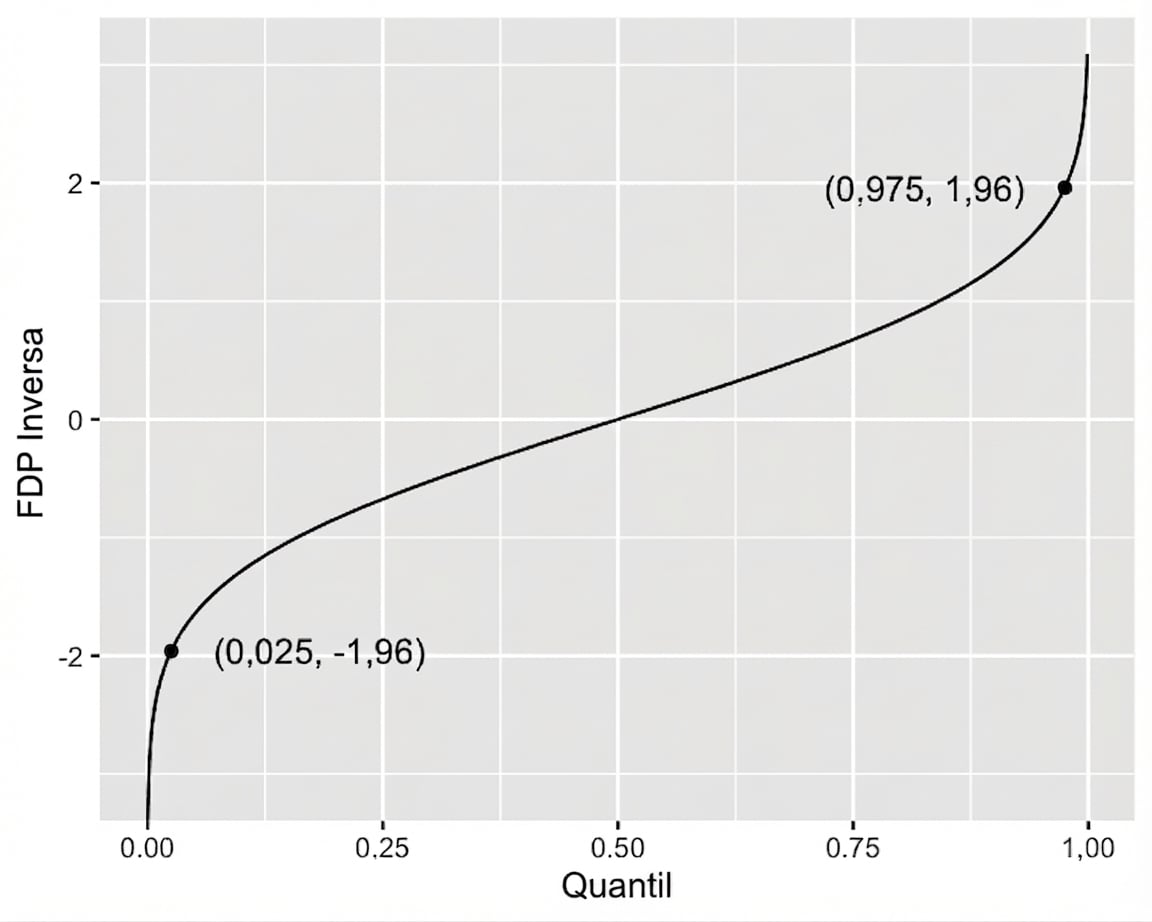
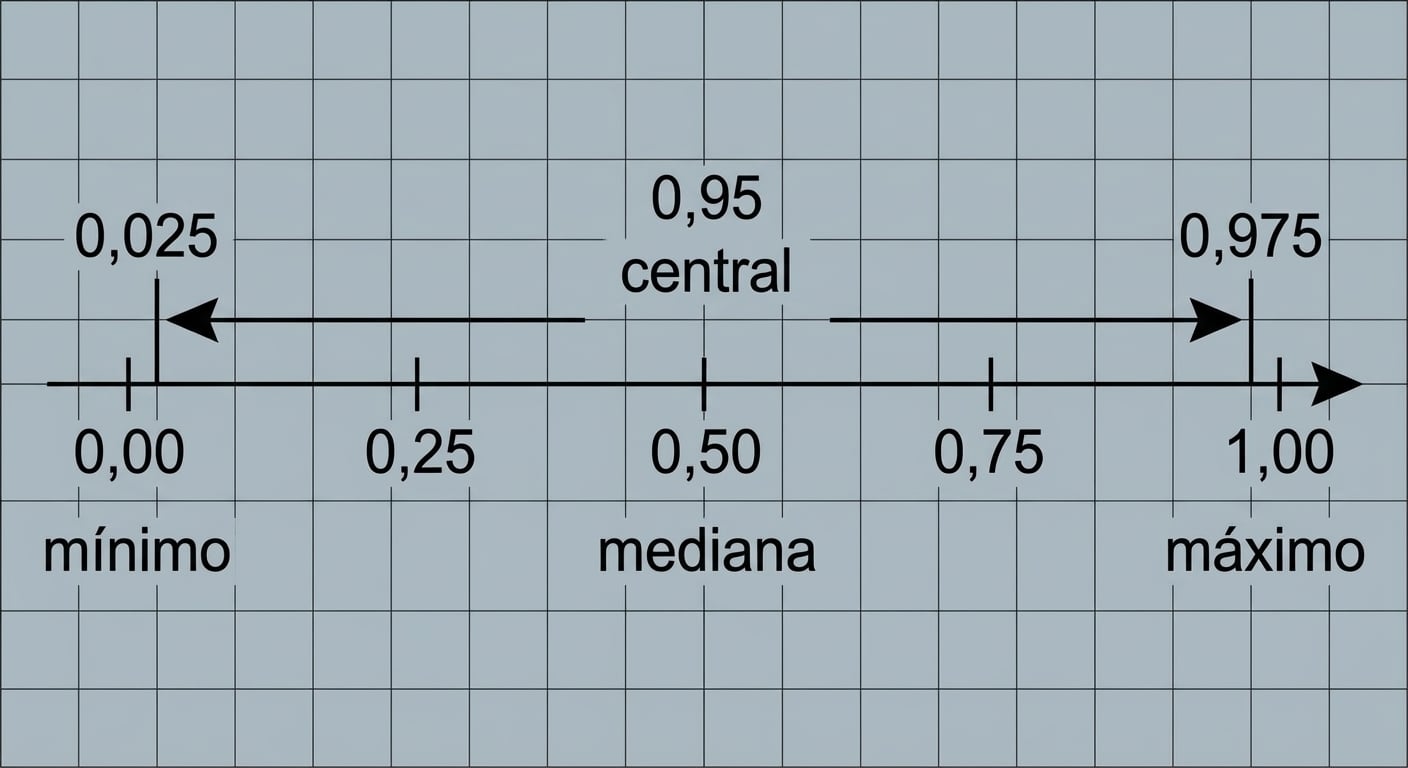
Método dos quantis para intervalos de confiança
Função de distribuição acumulada inversa