Regressão à média
Introdução à Regressão com statsmodels em Python

Maarten Van den Broeck
Content Developer at DataCamp
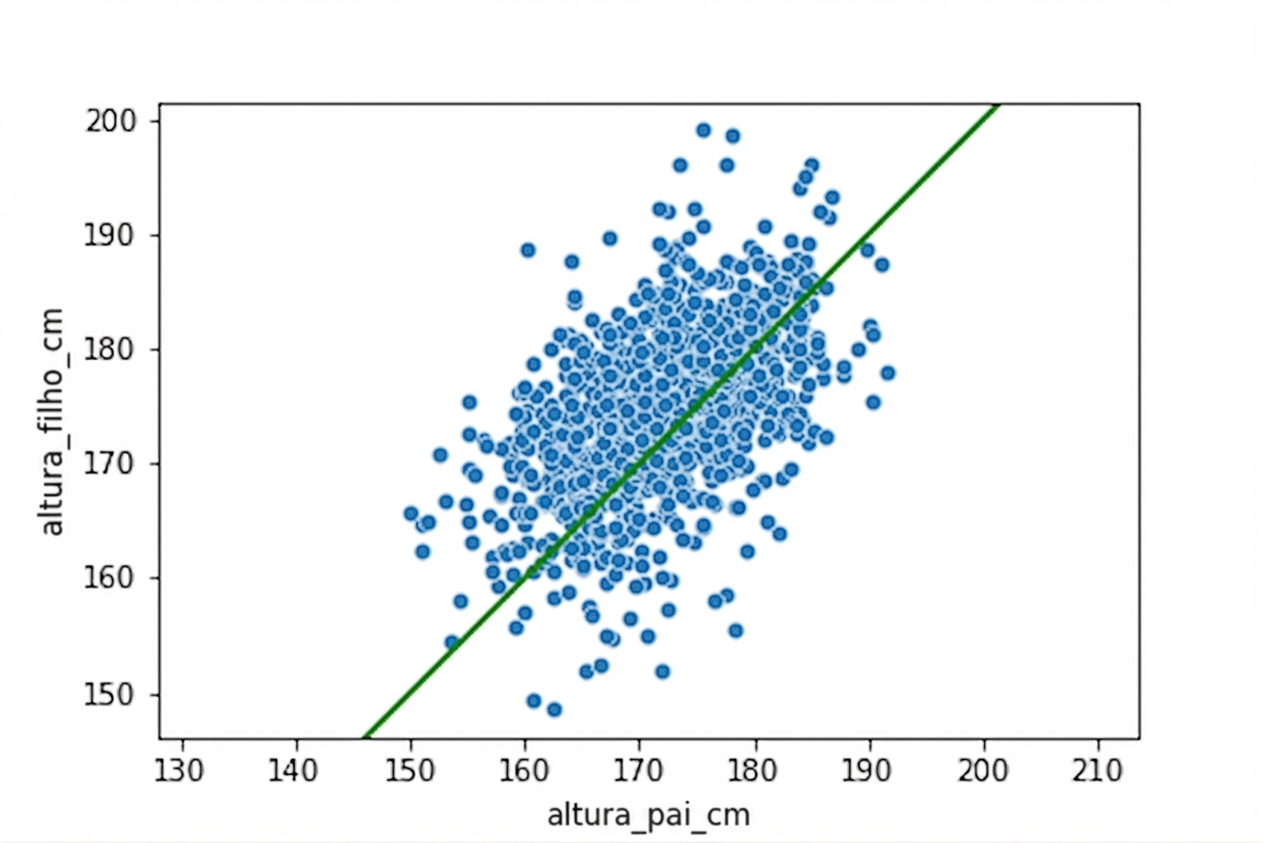
Gráfico de dispersão
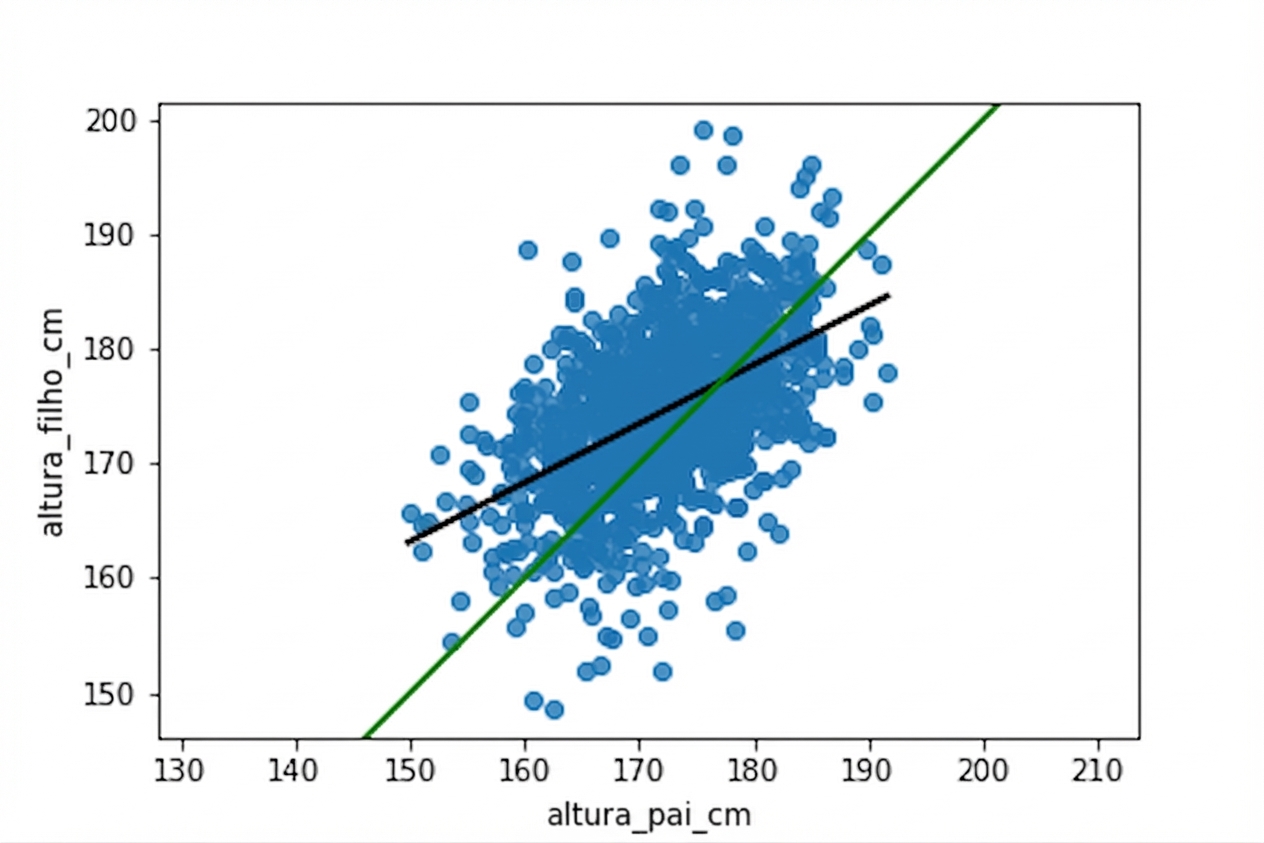
Adicionando uma linha de regressão
Introdução à Regressão com statsmodels em Python
Maarten Van den Broeck
Content Developer at DataCamp

