Uma história de duas variáveis
Introdução à Regressão com statsmodels em Python

Maarten Van den Broeck
Content Developer at DataCamp
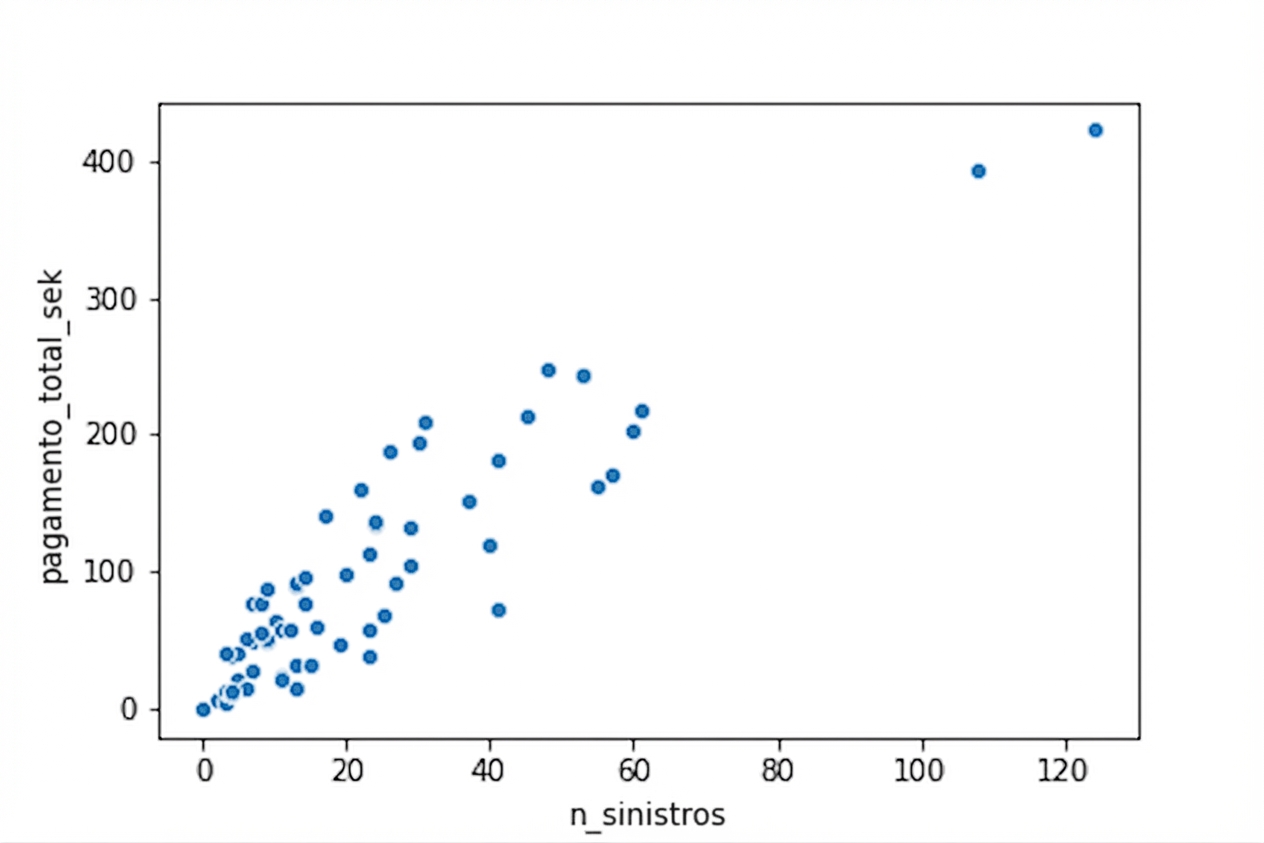
Visualizando pares de variáveis
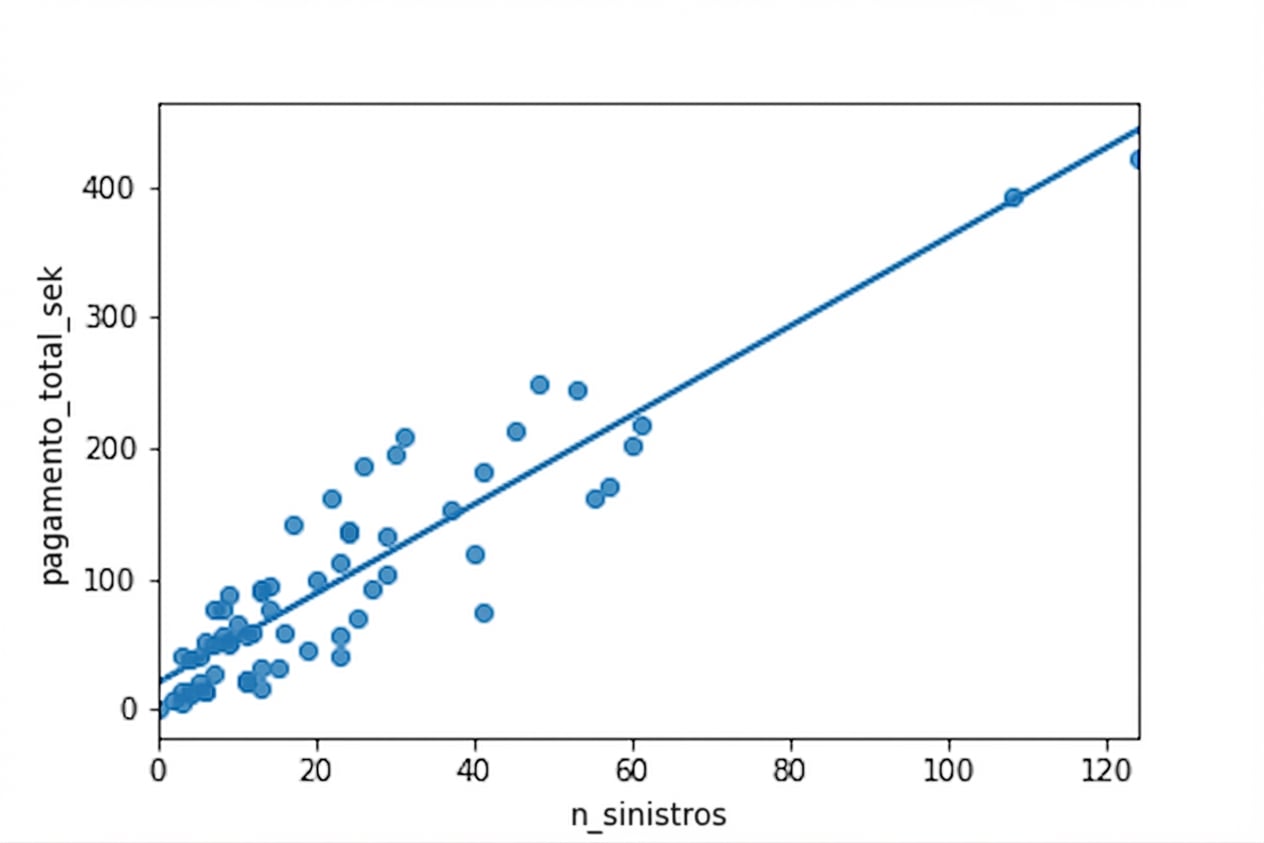
Adicionando uma linha de tendência
Introdução à Regressão com statsmodels em Python
Maarten Van den Broeck
Content Developer at DataCamp

