Konfidenzintervalle
Stichprobenziehung in Python

James Chapman
Curriculum Manager, DataCamp
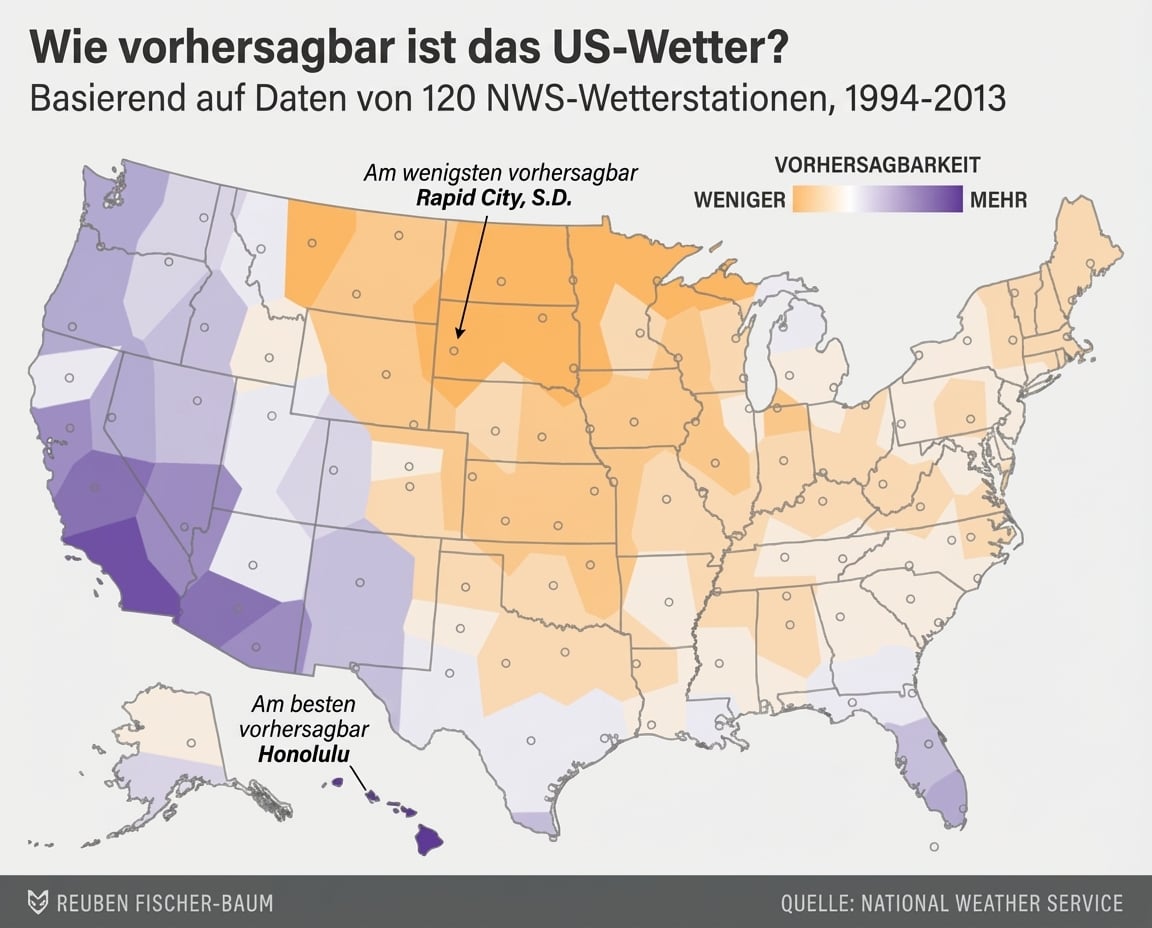
Wetter vorhersagen
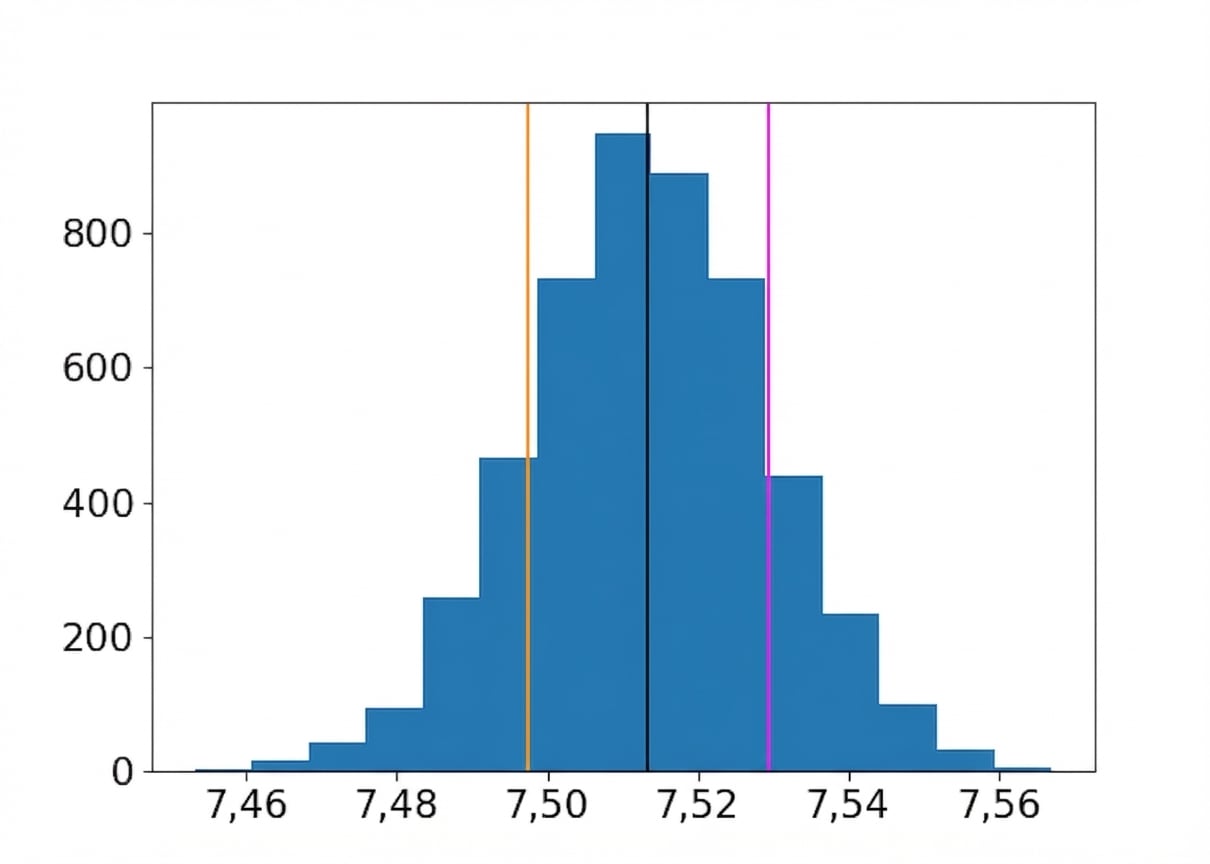
Bootstrap-Verteilung des mittleren Geschmacks
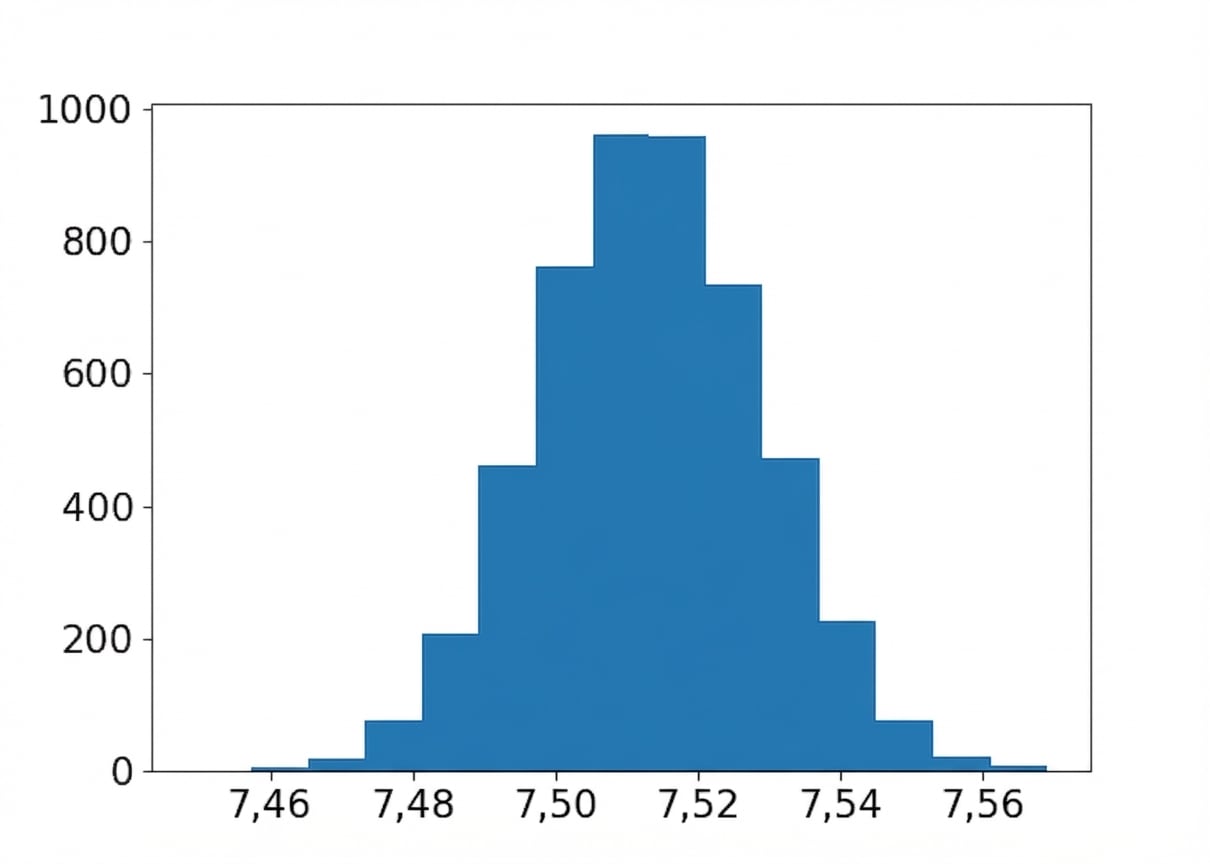
Mittelwert der Resamples
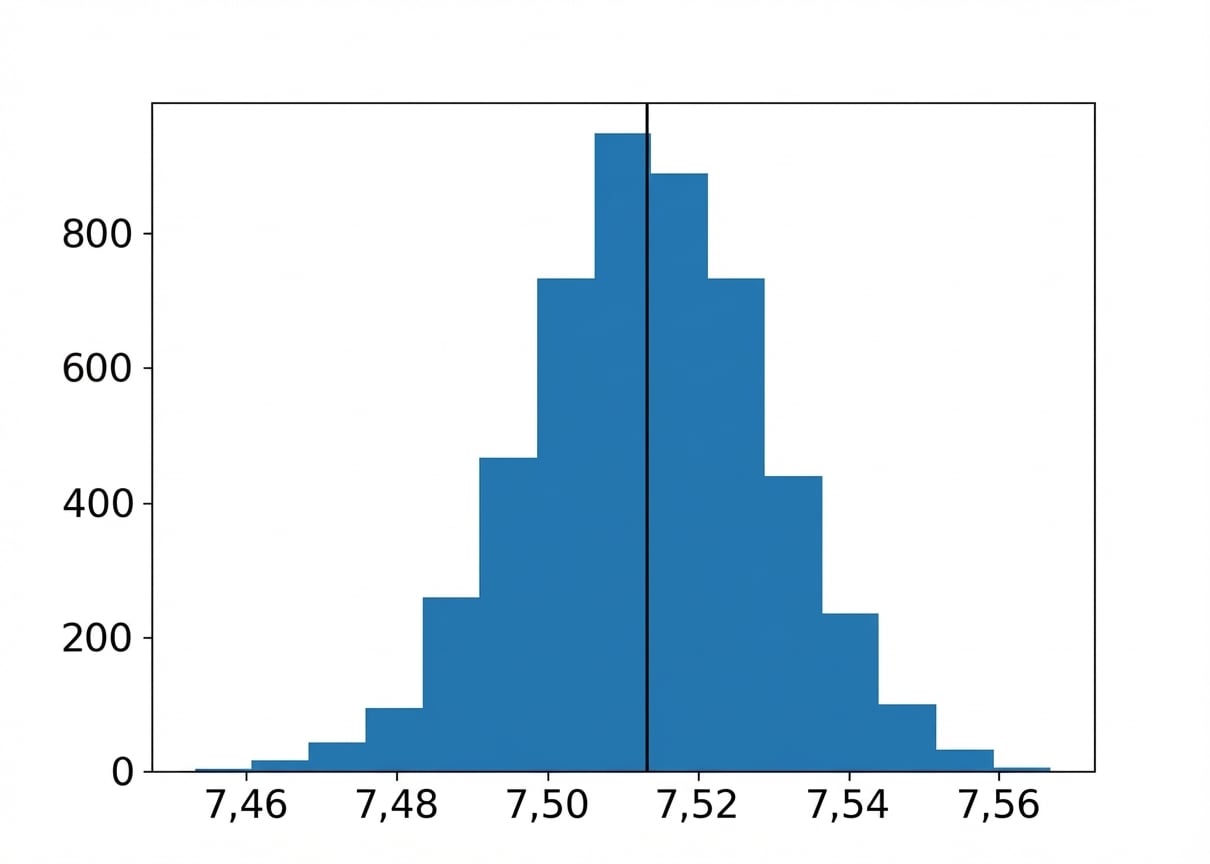
Mittelwert ± eine Standardabweichung
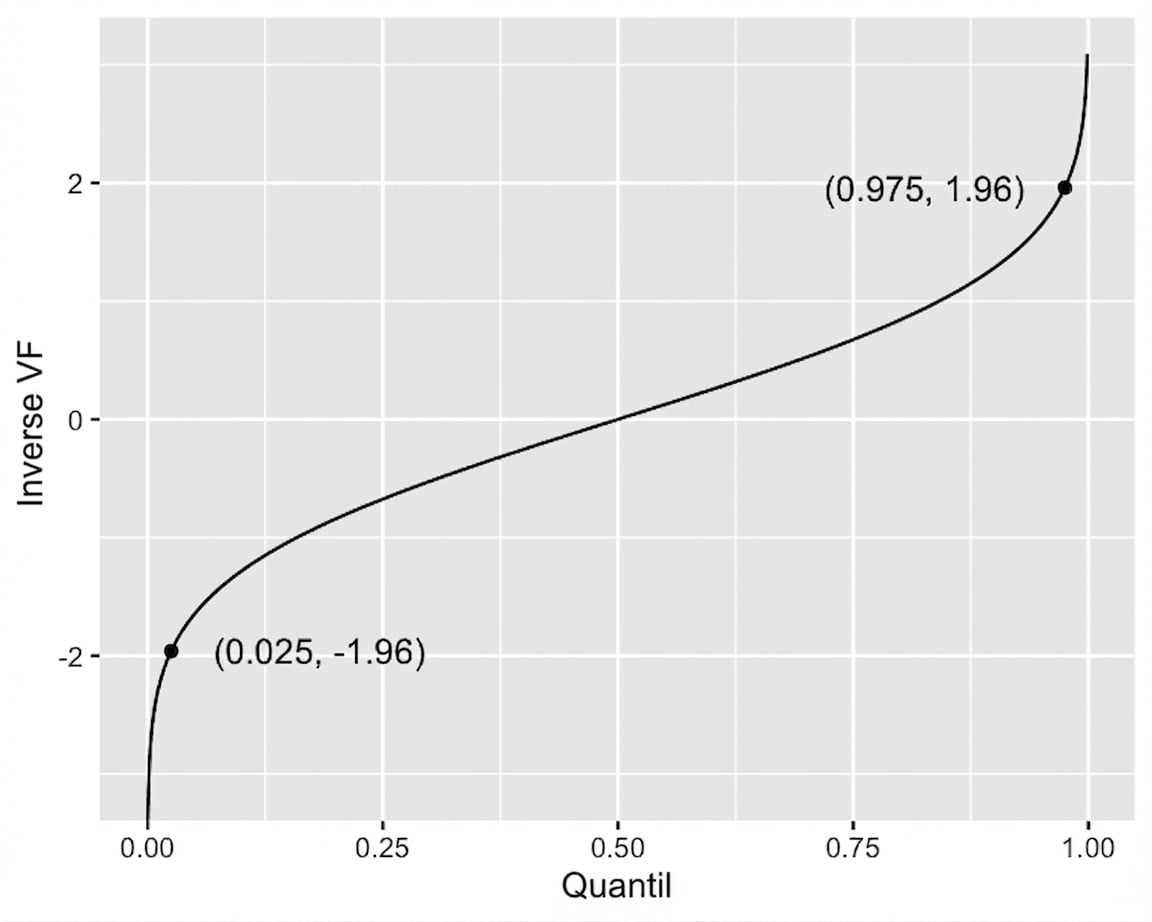
Quantilmethode für Konfidenzintervalle
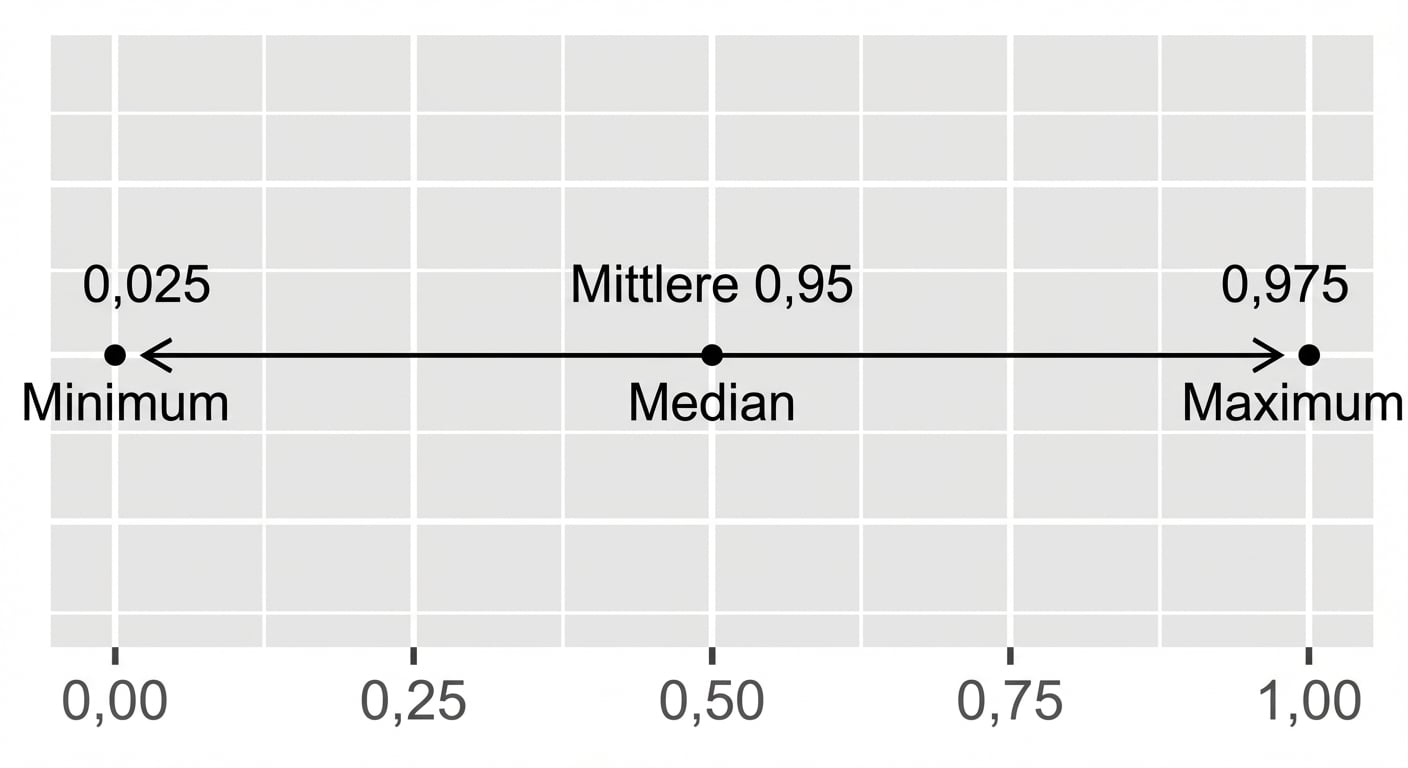
Inverse kumulative Verteilungsfunktion