Einführung ins Bootstrapping
Stichprobenziehung in Python

James Chapman
Curriculum Manager, DataCamp
Mit oder ohne
Ziehen ohne Zurücklegen:

Ziehen mit Zurücklegen („Resampling“):

Einfache Zufallsstichprobe ohne Zurücklegen
Population:

Stichprobe:

Einfache Zufallsstichprobe mit Zurücklegen
Population:
Resample:

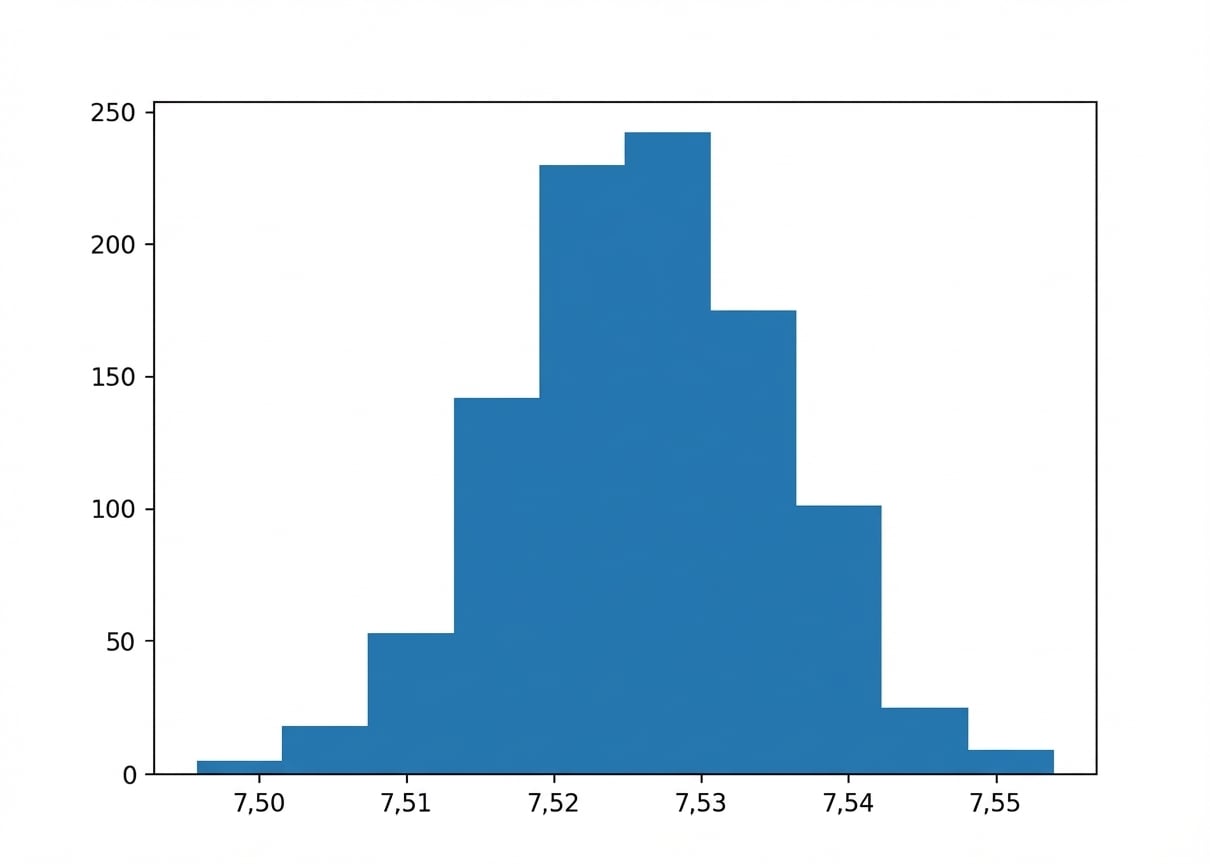
Bootstrapping
Histogramm der Bootstrap-Verteilung