Developing Effective Reports in Power BI
Data Ingestion and Semantic Models with Microsoft Fabric

Alex Kuntz
Head of Cloud Curriculum, DataCamp
Understanding Semantic Models
- Logical Data Representation: Simplifies complex data for intuitive analysis

Auto-Creation: Automatically created while creating Lakehouse/Warehouse.
Lakehouse:

Warehouse:

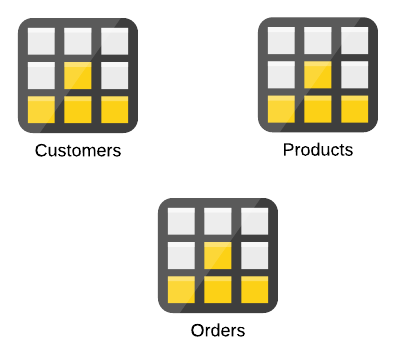
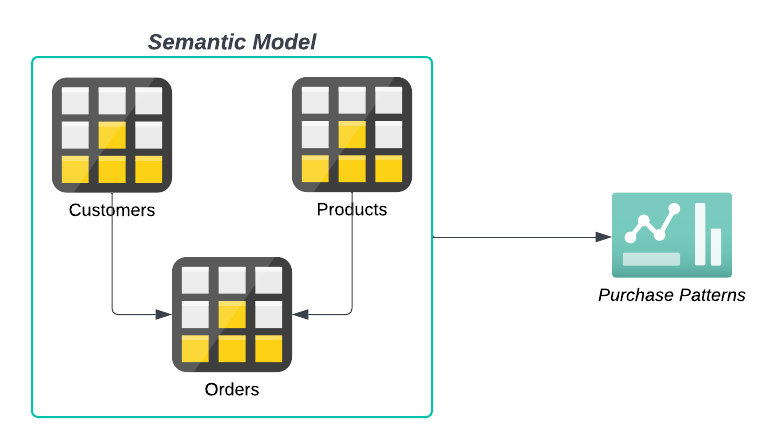
Understanding Relationships in model
- Building Relationships: Connect matching columns to unify data from multiple tables.
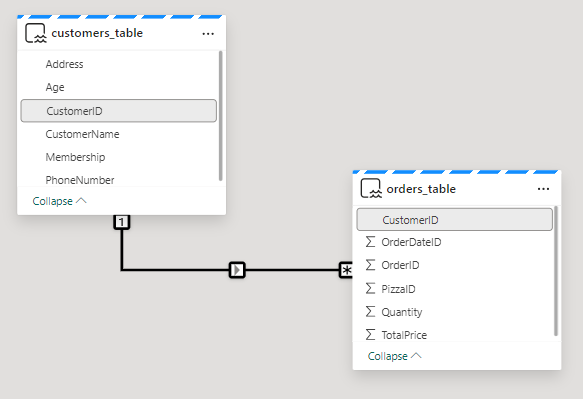
Cardinality in Relationships
Cardinality: Defines how data in one table relates to another.
- One-to-Many (1:*) One record relates to many in another table.

- One-to-One (1:1) Each record has a unique match in both tables.

- Many-to-Many (*:*) Multiple records in both tables relate to each other.

- One-to-Many (1:*) One record relates to many in another table.
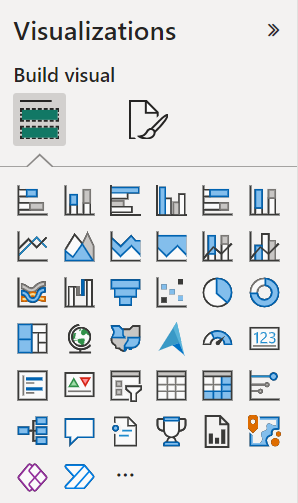
Visuals in Power BI Report
- Transform data into insights and make it easy to understand
Variety of visuals:
- Structured View: Table, Matrix
- Comparisions: Bar, Line, Pie chart, Treemap
- Filtering and Aggregations: Slicers, cards
Customize & personalize:
- Adjust colors, fonts, Layouts.
- Add titles, description, labels.
Introduction to DAX
- DAX Language: Formula language for Power BI
- Custom Calculations: Create sums, averages, and more
- Complex Calculations: Works across multiple tables
- Used for: Creating Measures and Calculated Columns

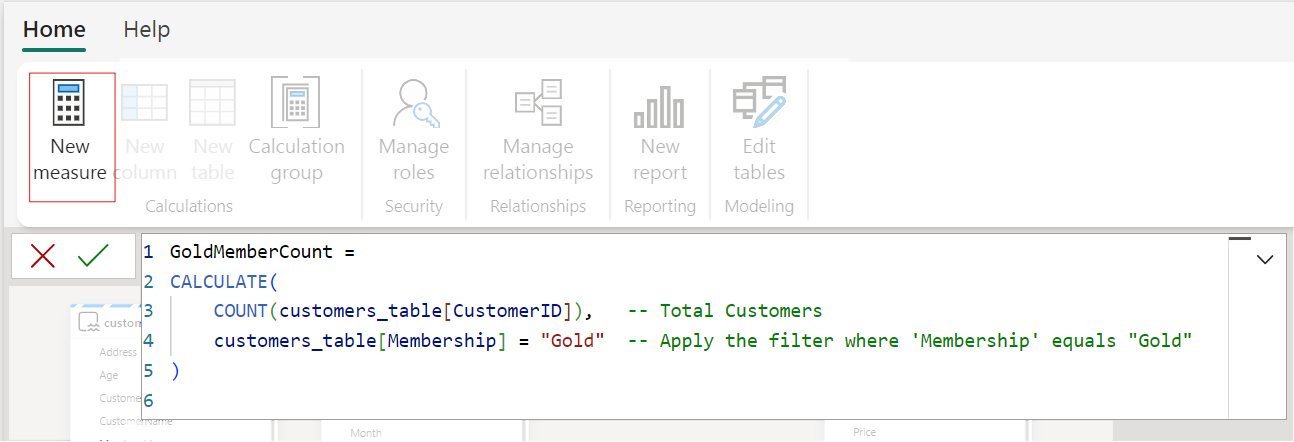
Measures
- Filter Context: Calculated based on report filters and slicers
- Does not Store Data: Only calculated when needed in visuals
- No Visible Column: Results are shown in visuals, not in data tables

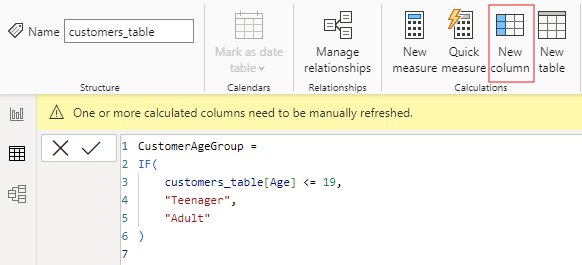
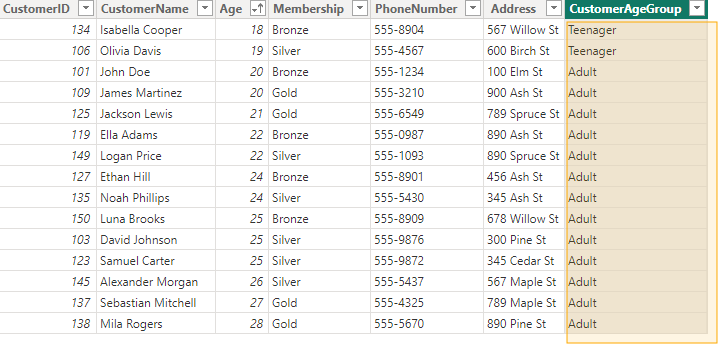
Calculated Columns
- Row Context: Calculated for each row in the data model
- Adds New Fields: Creates permanent new columns in the table
- Static Values: Calculated once and visible directly in the table
Let's practice!
Data Ingestion and Semantic Models with Microsoft Fabric

