Histogramas
Introdução ao Python para finanças

Adina Howe
Professor
Por que usar histogramas em finanças?
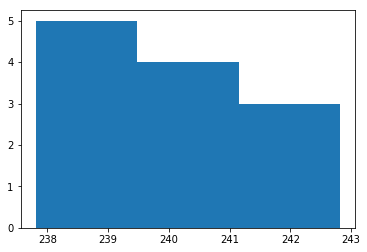
Histogramas e matplotlib.pyplot
import matplotlib.pyplot as plt
plt.hist(x=prices, bins=3)
plt.show()
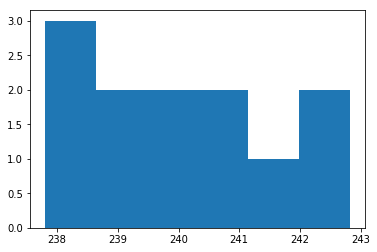
Mudando o número de bins
import matplotlib.pyplot as plt
plt.hist(prices, bins=6)
plt.show()
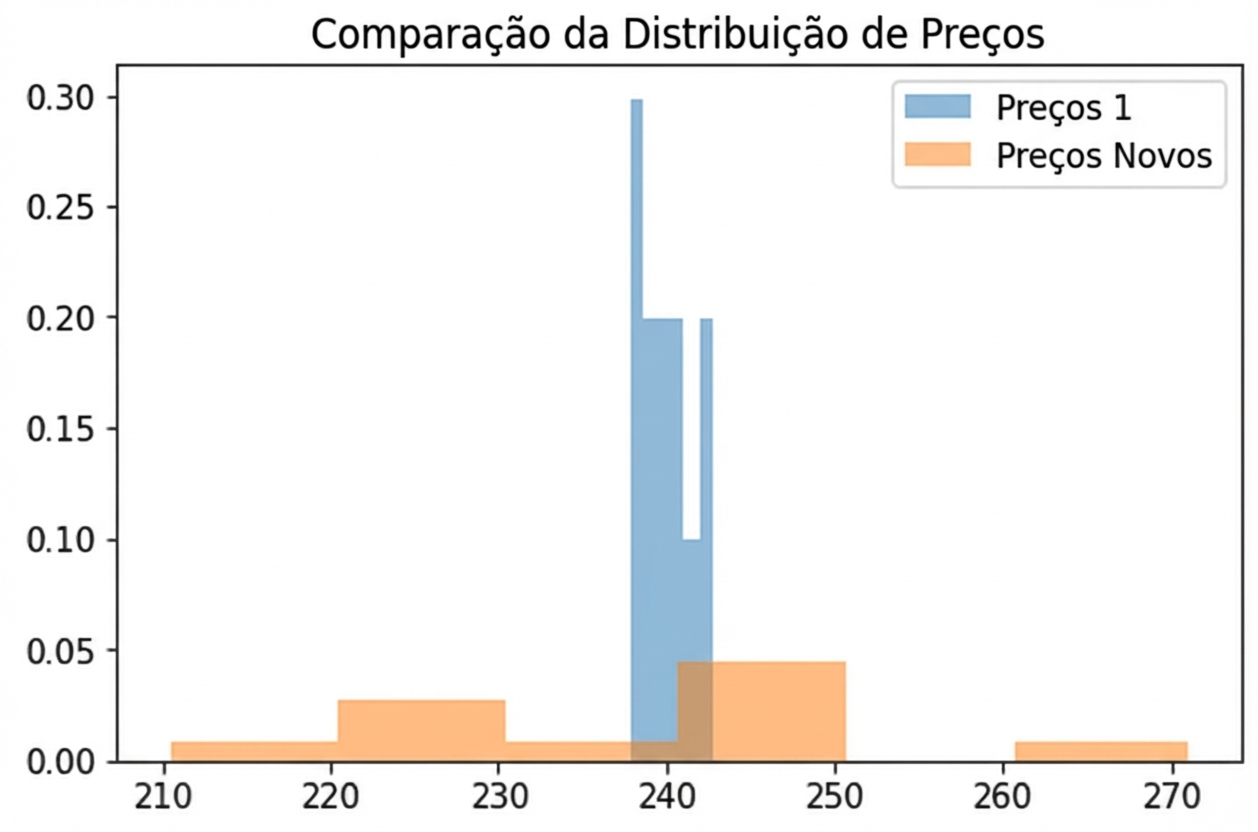
Normalizando os dados do histograma
import matplotlib.pyplot as plt
plt.hist(prices, bins=6, density=True)
plt.show()
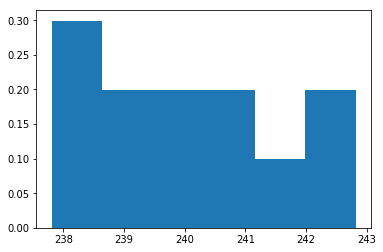
Resultado do histograma
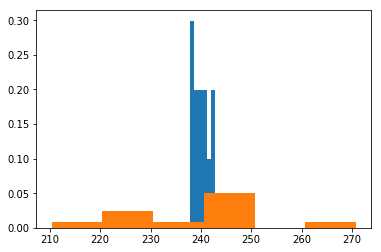
Resultado do histograma
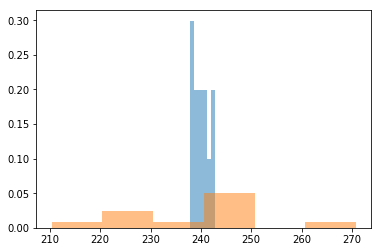
Resultado do histograma