Visualização em Python
Introdução ao Python para finanças

Adina Howe
Professor
Matplotlib: um pacote de visualização
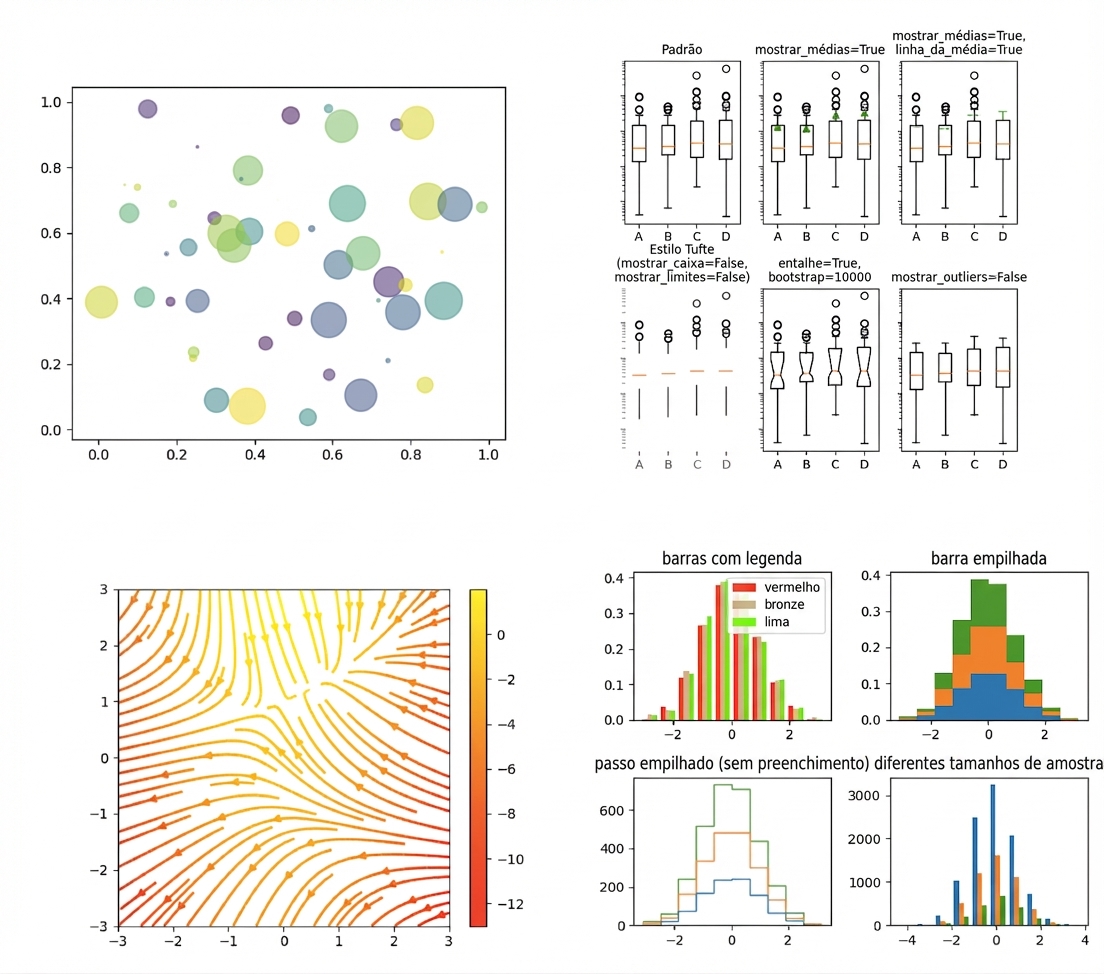
Veja mais na galeria do Matplotlib neste link.
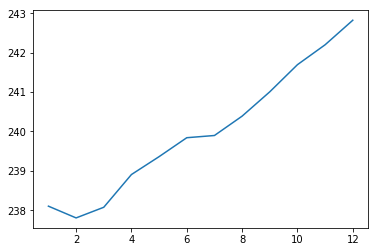
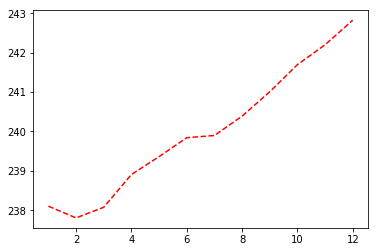
Resultado do gráfico
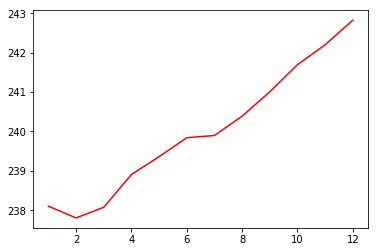
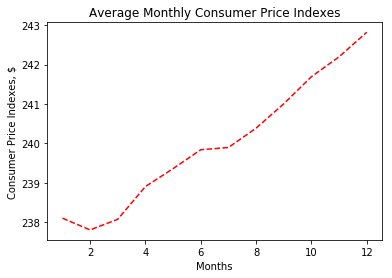
Resultado do gráfico
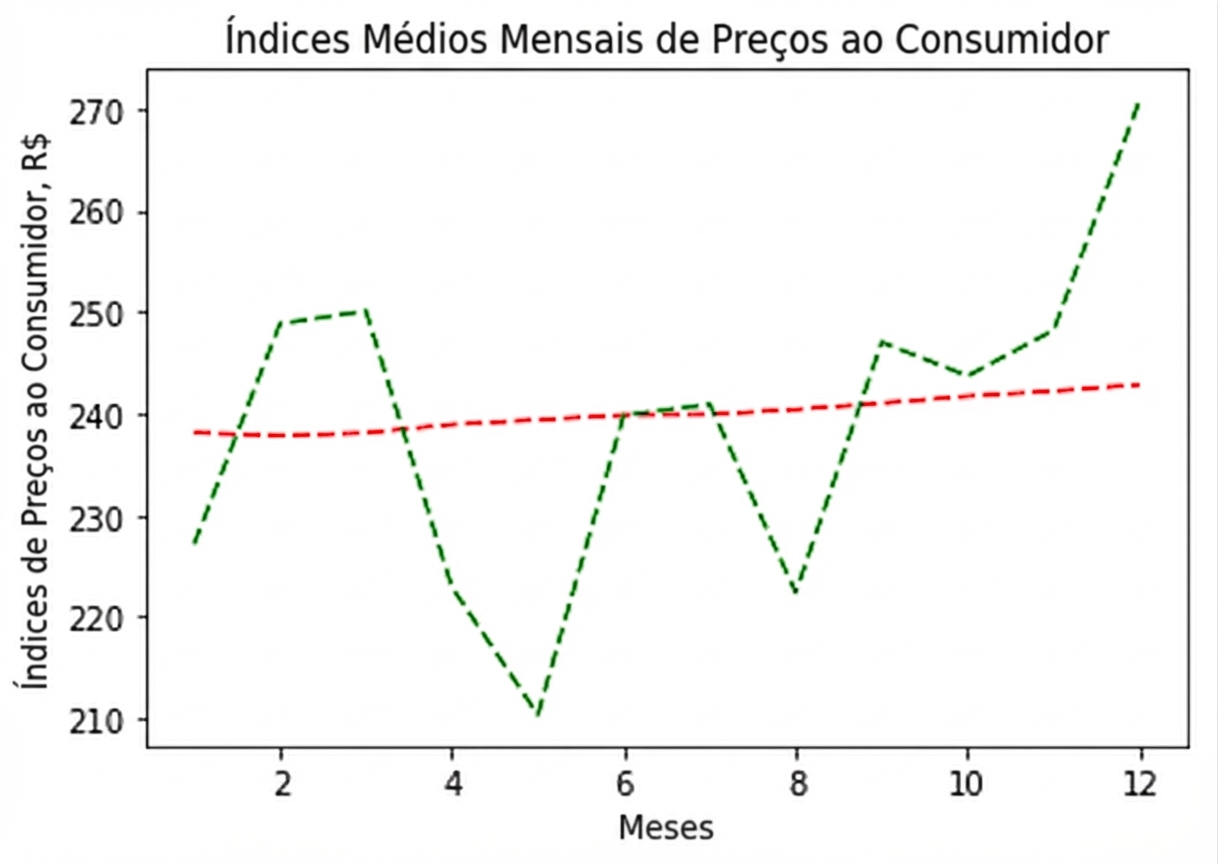
Resultado do gráfico
Resultado do gráfico
Resultado do gráfico
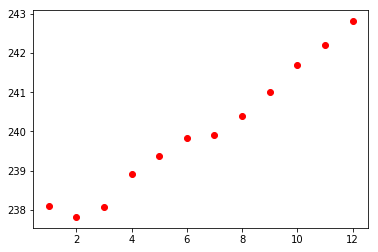
Resultado do gráfico de dispersão