Gráficos de regressão
Visualização intermediária de dados com a Seaborn

Chris Moffitt
Instructor
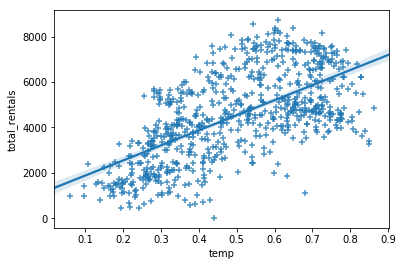
Plotando com regplot()
sns.regplot(data=df, x='temp',
            y='total_rentals', marker='+')
Avaliando regressão com residplot()
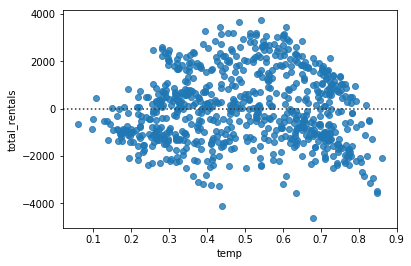
- Um gráfico de resíduos ajuda a avaliar o ajuste do modelo
- O Seaborn oferece isso com a função
residplot
sns.residplot(data=df, x='temp', y='total_rentals')
Regressão polinomial
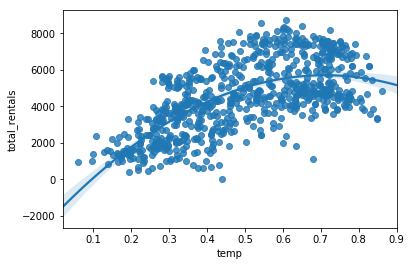
- O Seaborn oferece regressão polinomial com o parâmetro
order
sns.regplot(data=df, x='temp',
            y='total_rentals', order=2)
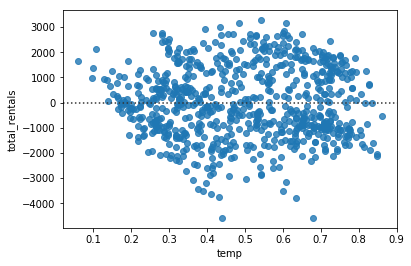
residplot com regressão polinomial
sns.residplot(data=df, x='temp',
              y='total_rentals', order=2)
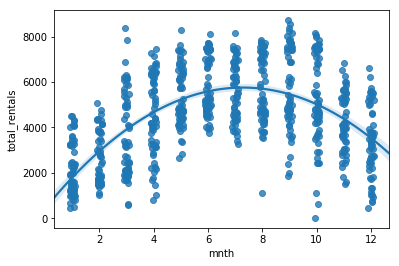
Valores categóricos
sns.regplot(data=df, x='mnth', y='total_rentals',
            x_jitter=.1, order=2)
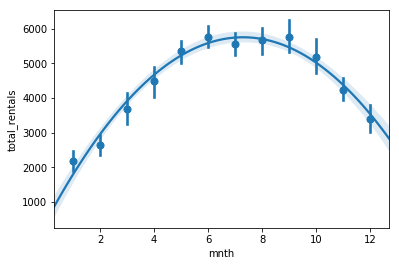
Estimadores
- Em alguns casos, um
x_estimatorajuda a destacar tendências
sns.regplot(data=df, x='mnth', y='total_rentals',
            x_estimator=np.mean, order=2)
Fazendo binning dos dados
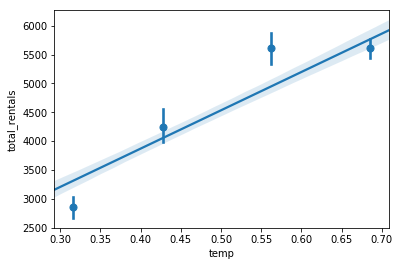
x_binspode dividir os dados em intervalos discretos- A linha de regressão ainda é ajustada a todos os dados
sns.regplot(data=df,x='temp',y='total_rentals',
            x_bins=4)