Working with relationships
Modelagem de dados intermediária no Power BI

Sara Billen
Curriculum Manager at DataCamp
Cross filtering
Cross-filtering: Selecting a value in one visual narrows down visible data in other visuals
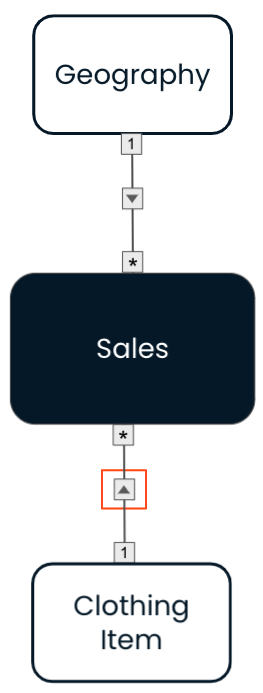
Filter direction
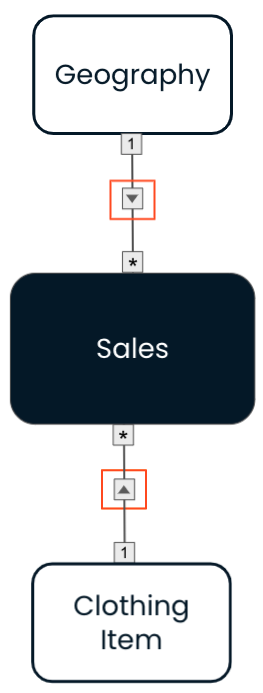
Filter direction
Data model:
Filter direction
Data model:

Filter direction options
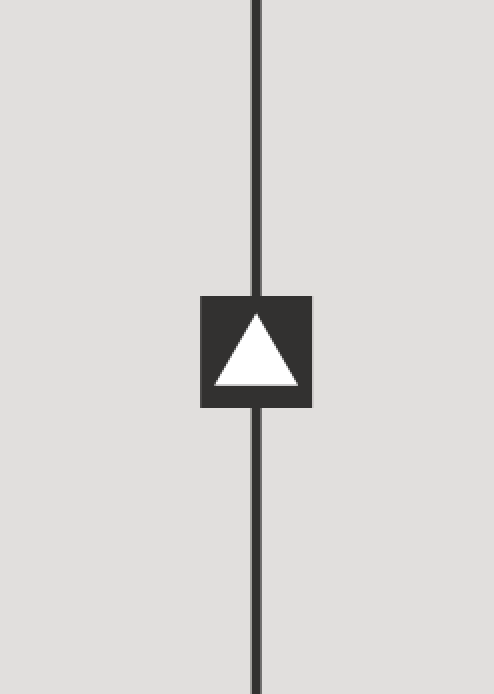
Single direction
Filter in one direction
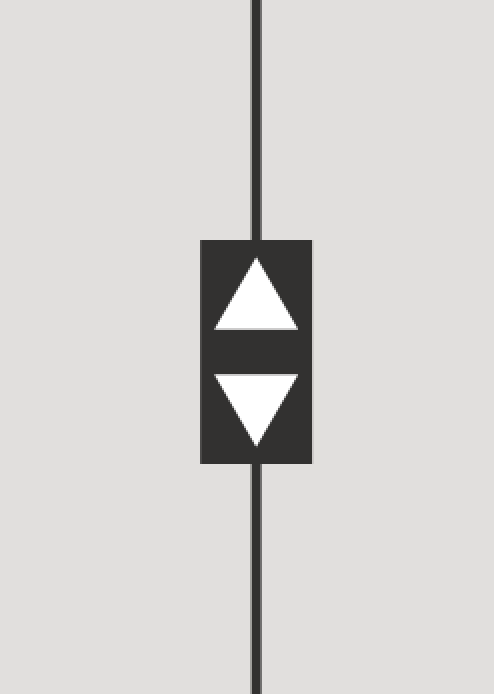
Bi-directional
Filter in both directions
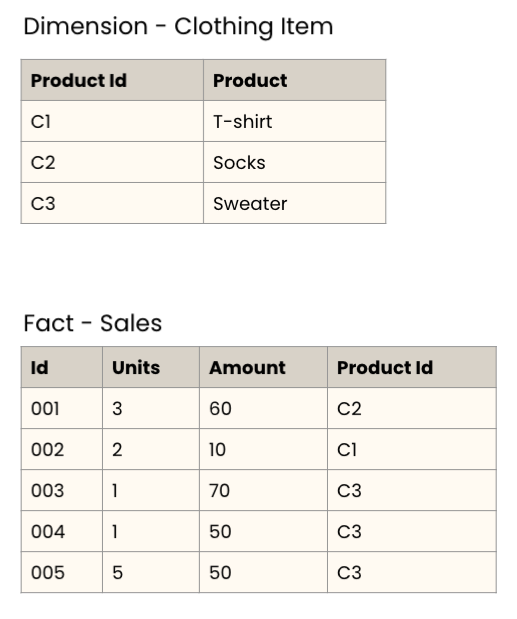
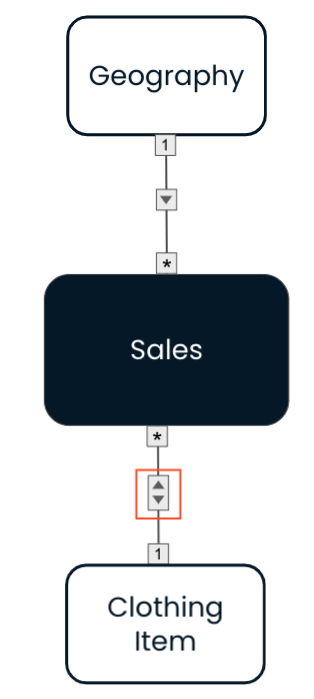
Bi-directional filtering: use case
Show only relevant slicer entries
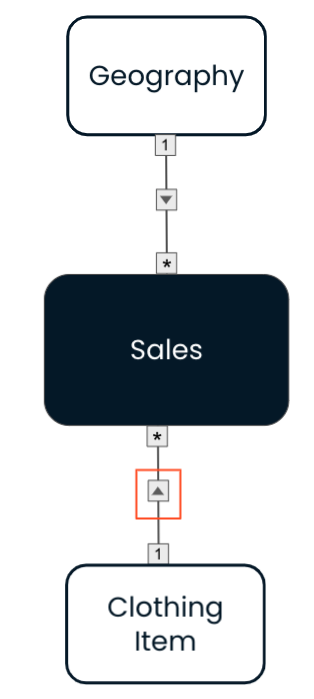
Data model:
$$
Report view:
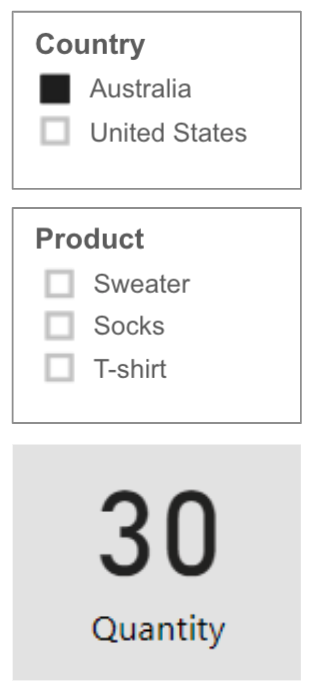
Bi-directional filtering: use case
Only sweaters were sold in Australia
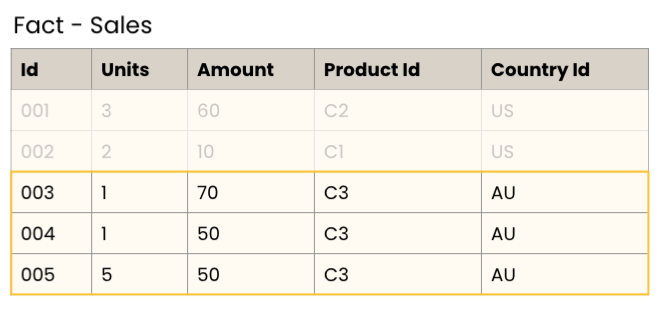
*Product Id: C3 = Sweater, Country Id: AU = Australia
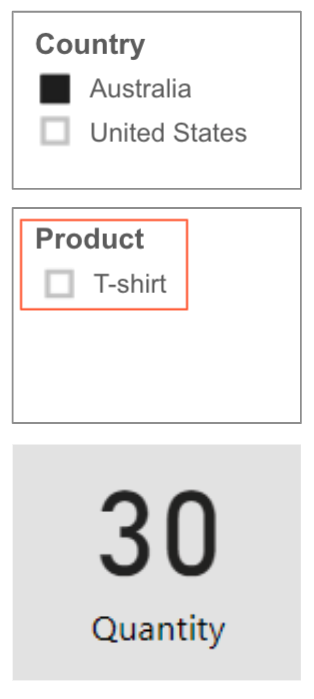
Bi-directional filtering: use case
Show only relevant slicer entries
Data model:
$$
Report view:
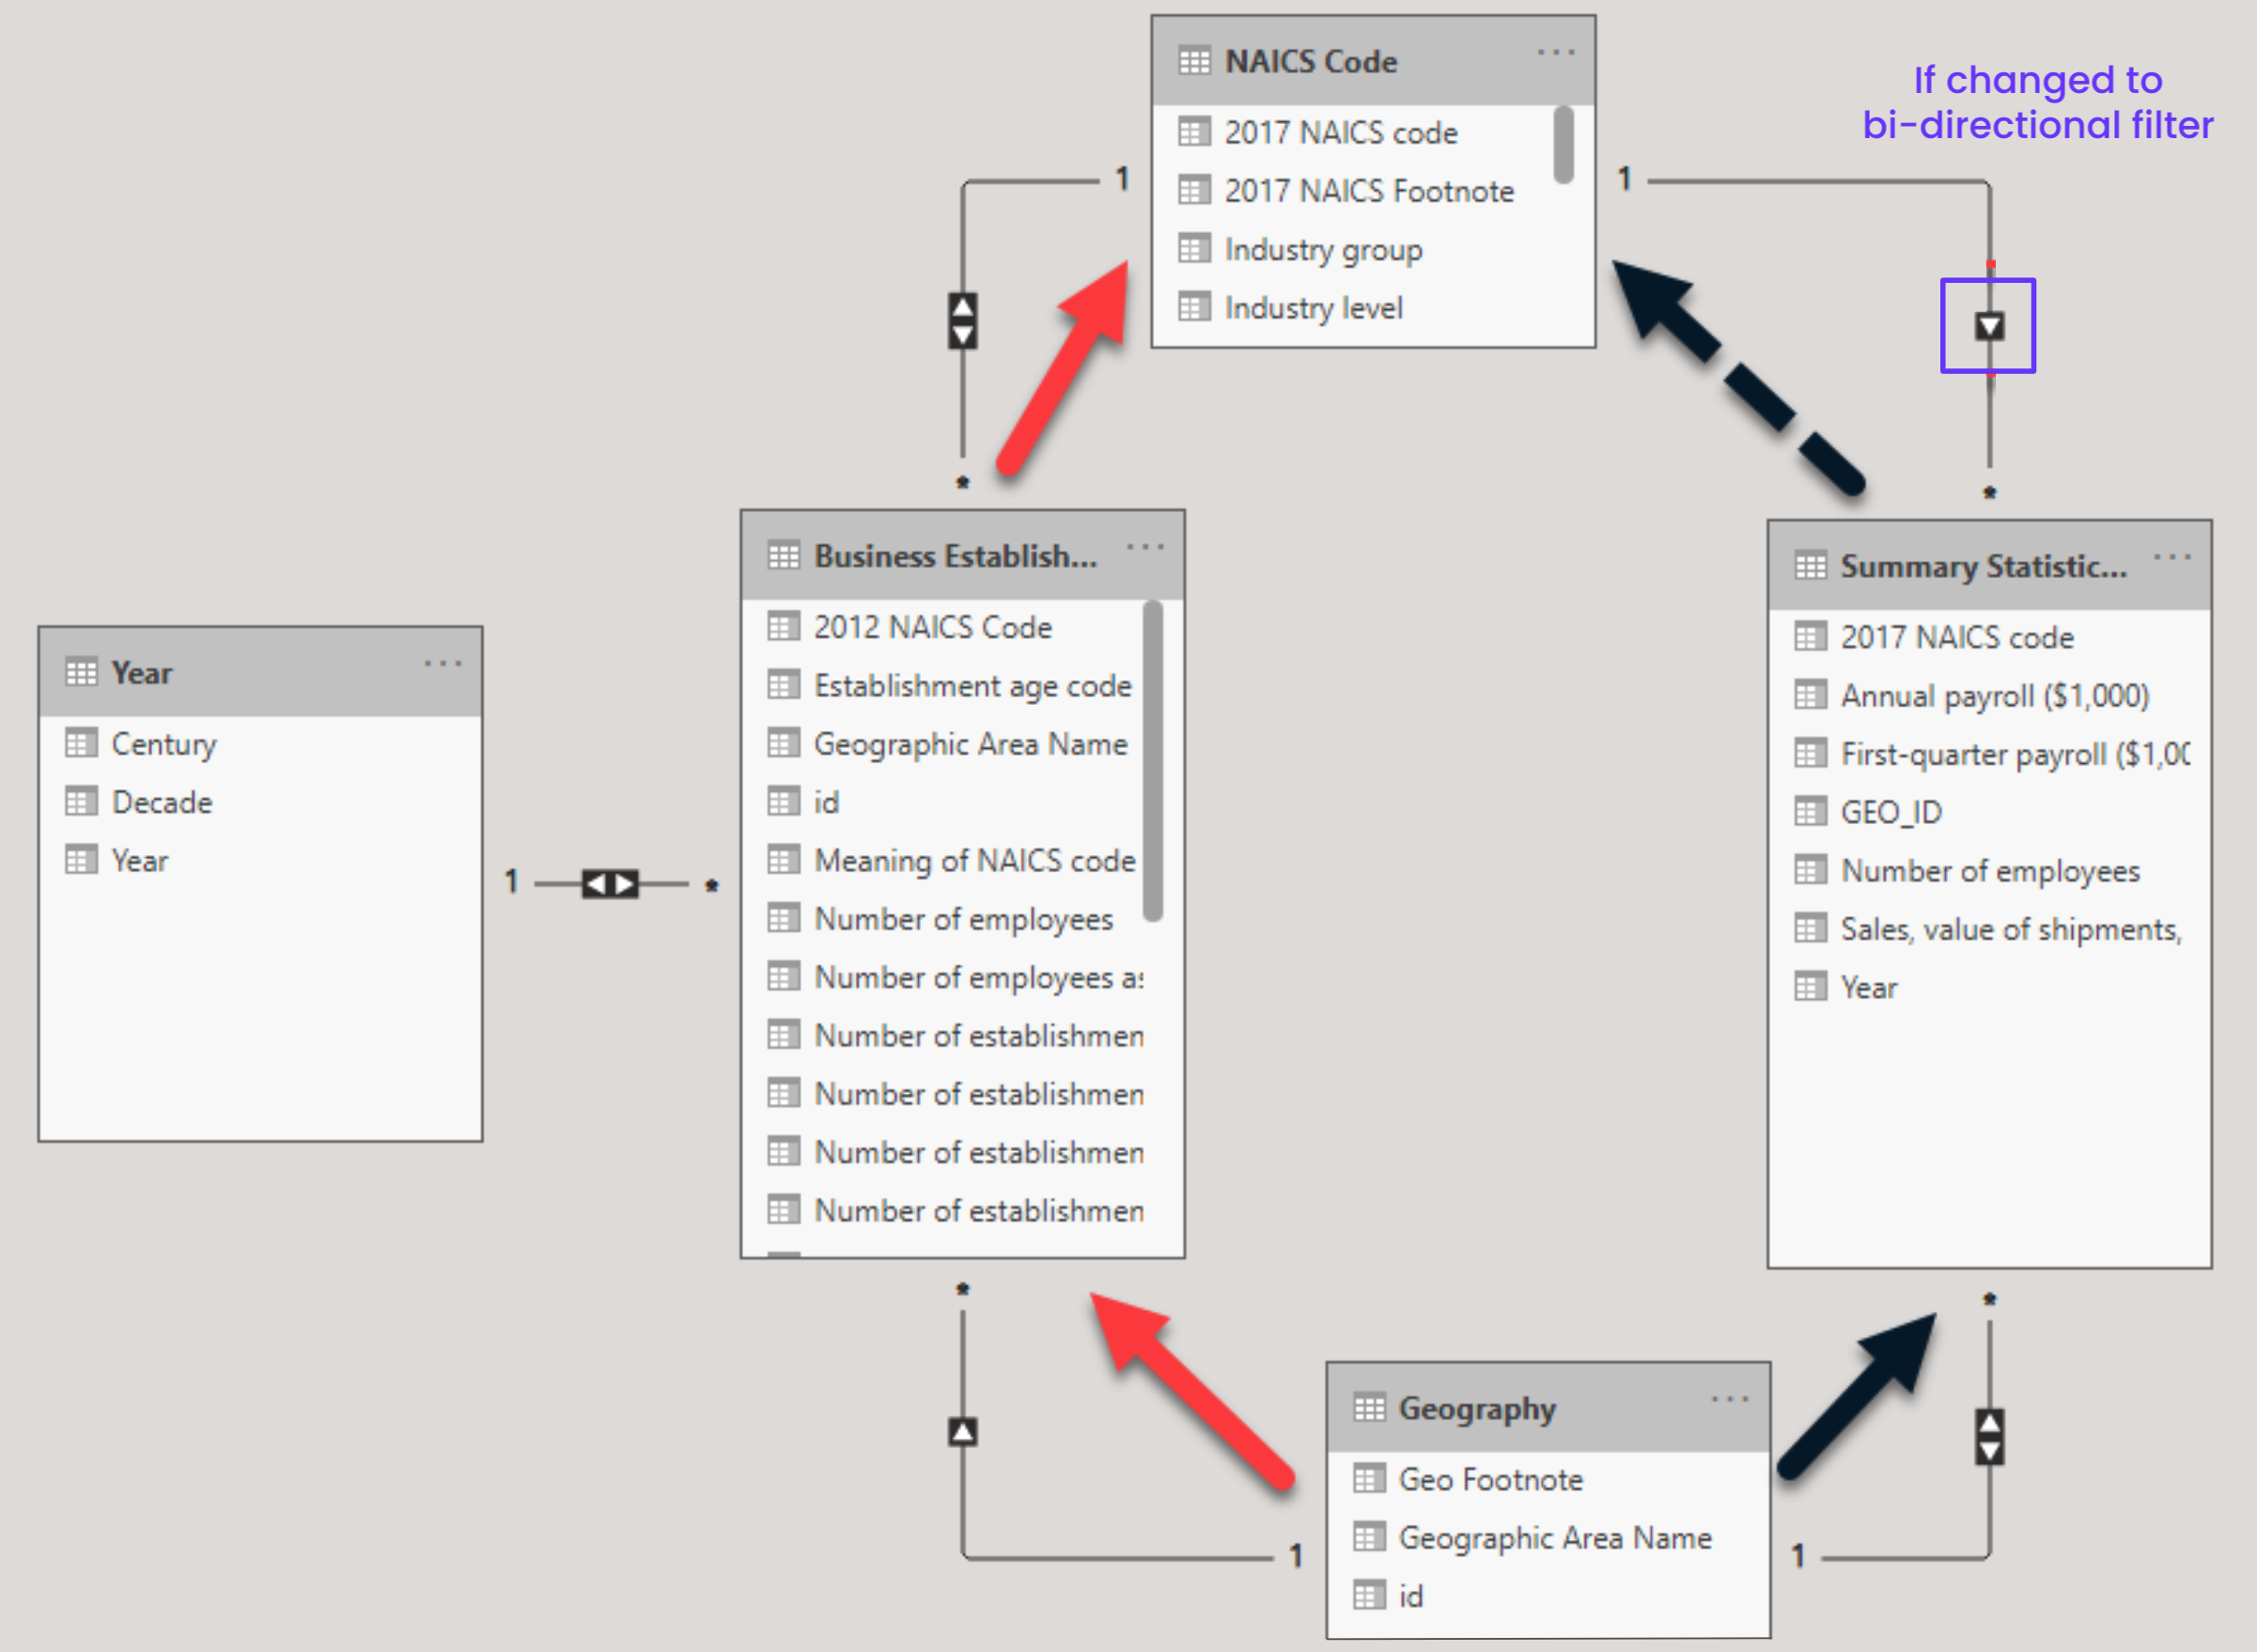
Bi-directional filtering and paths
Bi-directional filters cannot allow for two separate paths between two tables
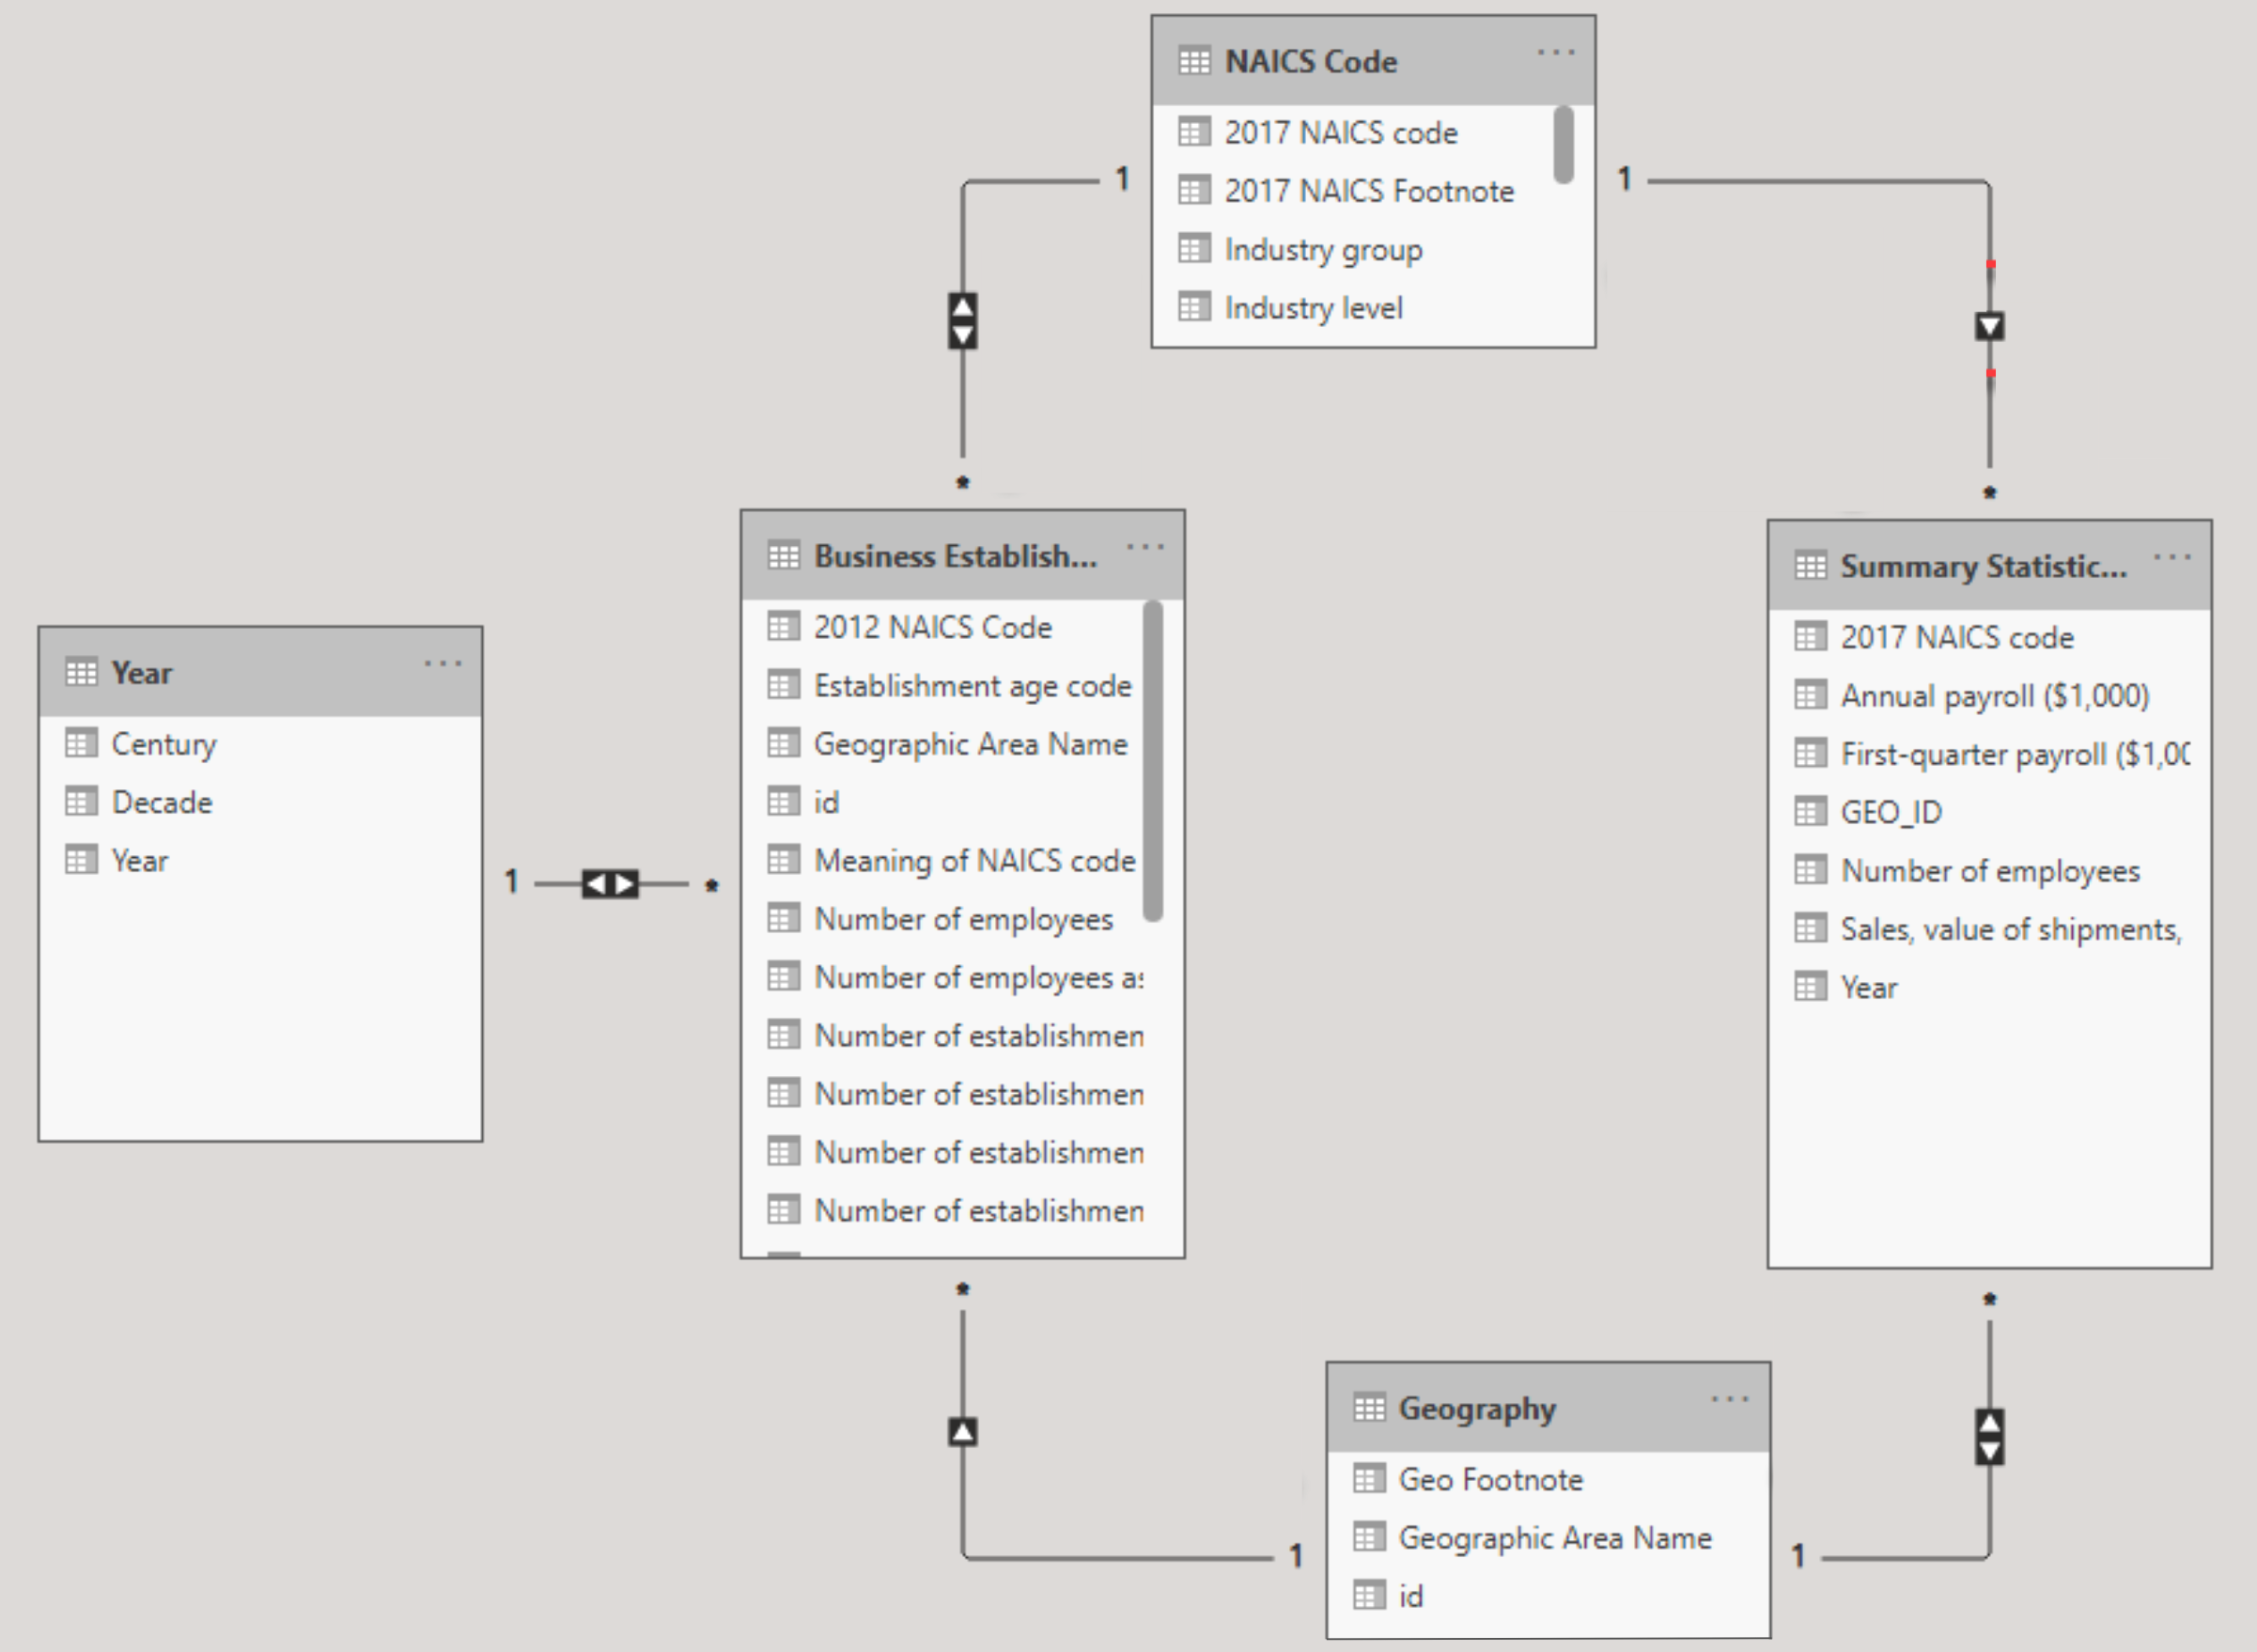
Bi-directional filtering and paths
Bi-directional filters cannot allow for two separate paths between two tables
Role-playing dimensions
- Sometimes we need to create multiple relationships between tables
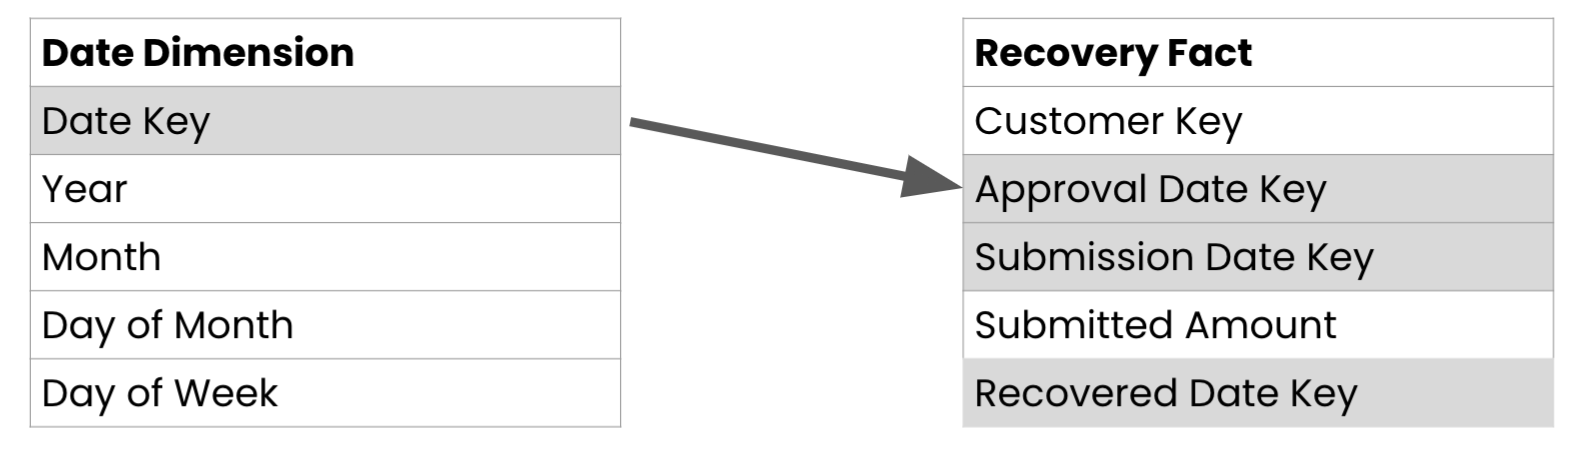
Role-playing dimensions
- Kimball model
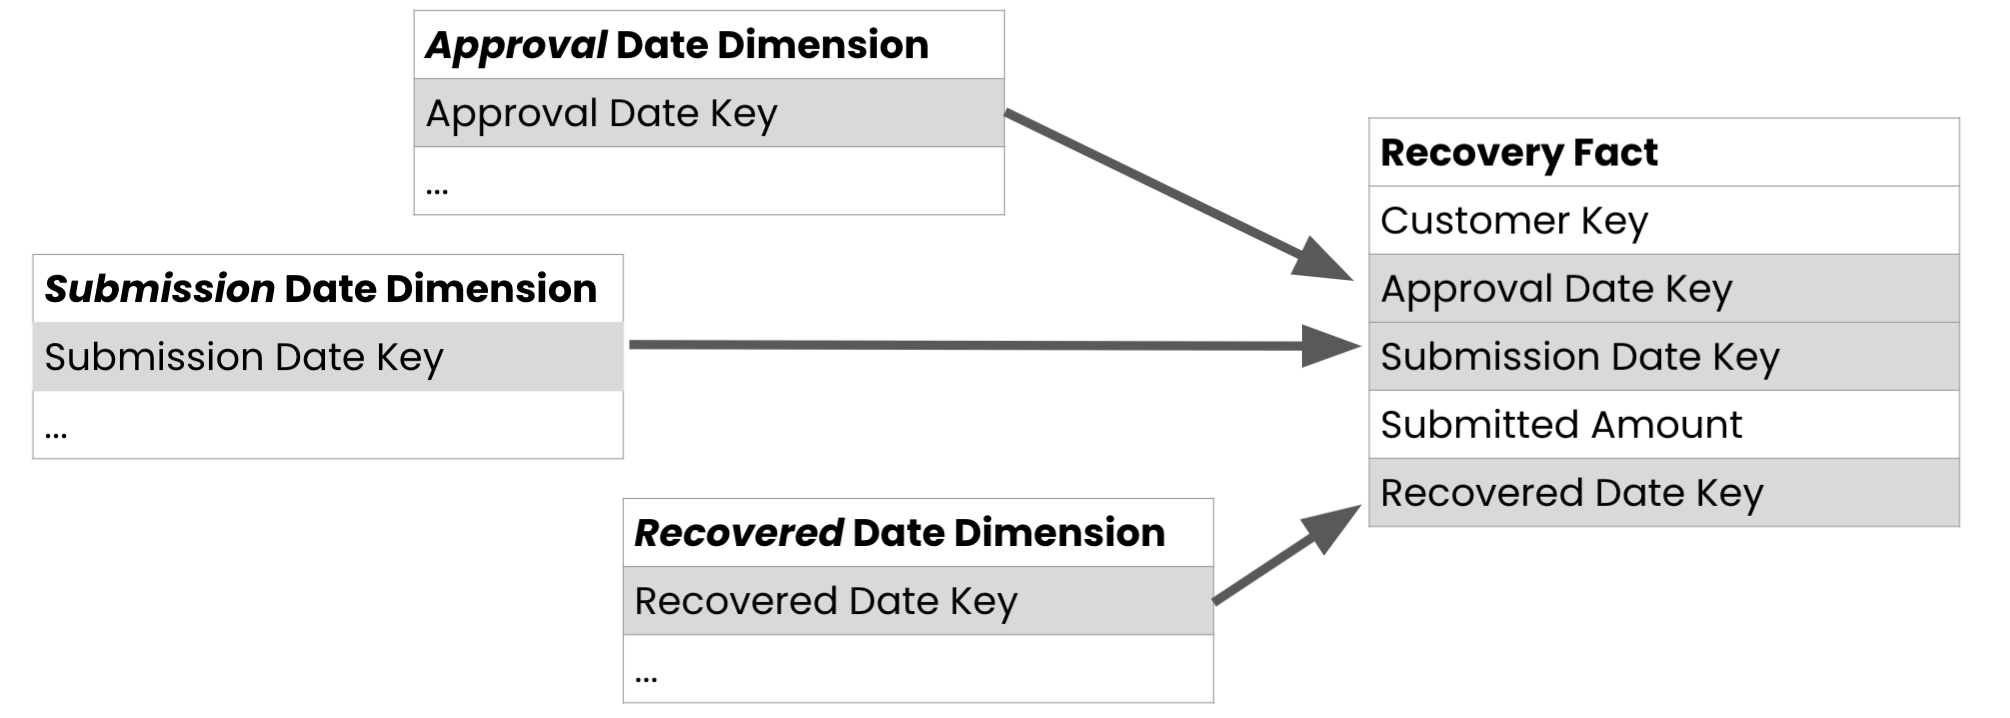
- Role-playing dimension:
- Dimension that can filter related facts differently
- Typically implemented as views of the Date dimension
Role-playing dimensions in Power BI
- Create multiple relationships on a dimension, but only one is active
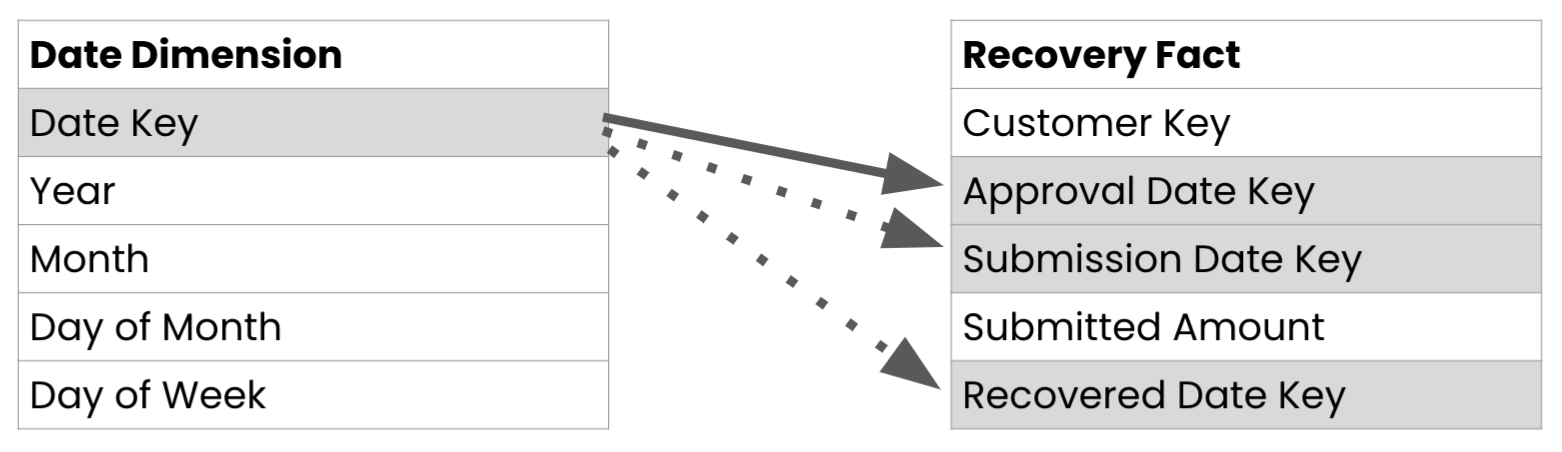
- Use
USERELATIONSHIP()in DAX to specify which relationship to use:
Measure Name = CALCULATE(<Measurement function>,
                         USERELATIONSHIP(<Dimension Key Column>, <Fact Key Column>)

