Visualizando diferenças entre conjuntos
Combinando dados com dplyr

Chris Cardillo
Data Scientist
Agregando conjuntos por cor
batmobile_colors <- batmobile %>%
  group_by(color_id) %>%
  summarize(total = sum(quantity))

batmobile_colors
# A tibble: 12 x 2
   color_id total
      <dbl> <dbl>
 1        0   543
 2        1    33
 3        4    16
 4       14    20
 5       15    16
 6       36    15
 7       57     8
 8       71   202
 9       72   160
10      182     8
# … with 2 more rows
batwing_colors <- batwing %>%
  group_by(color_id) %>%
  summarize(total = sum(quantity))

batwing_colors
# A tibble: 20 x 2
   color_id total
      <dbl> <dbl>
 1        0   418
 2        1    45
 3        4    81
 4       14    22
 5       15    22
 6       19    10
 7       25     1
 8       34     3
 9       36     9
10       46    21
# … with 10 more rows
Comparando esquemas de cores dos conjuntos
batmobile_colors %>%
  full_join(batwing_colors, by = "color_id", suffix = c("_batmobile", "_batwing")) %>%
  replace_na(list(total_batmobile = 0, total_batwing = 0))
# A tibble: 22 x 3
   color_id total_batmobile total_batwing
      <dbl>           <dbl>         <dbl>
 1        0             543           418
 2        1              33            45
 3        4              16            81
 4       14              20            22
 5       15              16            22
 6       36              15             9
 7       57               8             3
 8       71             202           158
 9       72             160           213
10      182               8            14
# … with 12 more rows
Adicionando nomes das cores
batmobile_colors %>%
  full_join(batwing_colors, by = "color_id", suffix = c("_batmobile", "_batwing")) %>%
  replace_na(list(total_batmobile = 0, total_batwing = 0)) %>%
  inner_join(colors, by = c("color_id" = "id"))
# A tibble: 22 x 5
   color_id total_batmobile total_batwing name              rgb
      <dbl>           <dbl>         <dbl> <chr>             <chr>
 1        0             543           418 Black             #05131D
 2        1              33            45 Blue              #0055BF
 3        4              16            81 Red               #C91A09
 4       14              20            22 Yellow            #F2CD37
 5       15              16            22 White             #FFFFFF
 6       36              15             9 Trans-Red         #C91A09
 7       57               8             3 Trans-Neon Orange #FF800D
 8       71             202           158 Light Bluish Gray #A0A5A9
 9       72             160           213 Dark Bluish Gray  #6C6E68
10      182               8            14 Trans-Orange      #F08F1C
# … with 12 more rows
Adicionando frações
batmobile_colors %>%
  full_join(batwing_colors, by = "color_id", suffix = c("_batmobile", "_batwing")) %>%
  replace_na(list(total_batmobile = 0, total_batwing = 0)) %>%
  inner_join(colors, by = c("color_id" = "id")) %>%
  mutate(total_batmobile = total_batmobile / sum(total_batmobile),
         total_batwing = total_batwing / sum(total_batwing))
# A tibble: 22 x 5
   color_id total_batmobile total_batwing name              rgb
      <dbl>           <dbl>         <dbl> <chr>             <chr>
 1        0         0.516         0.397   Black             #05131D
 2        1         0.0314        0.0428  Blue              #0055BF
 3        4         0.0152        0.0770  Red               #C91A09
 4       14         0.0190        0.0209  Yellow            #F2CD37
 5       15         0.0152        0.0209  White             #FFFFFF
 6       36         0.0143        0.00856 Trans-Red         #C91A09
 7       57         0.00760       0.00285 Trans-Neon Orange #FF800D
 8       71         0.192         0.150   Light Bluish Gray #A0A5A9
 9       72         0.152         0.202   Dark Bluish Gray  #6C6E68
10      182         0.00760       0.0133  Trans-Orange      #F08F1C
# … with 12 more rows
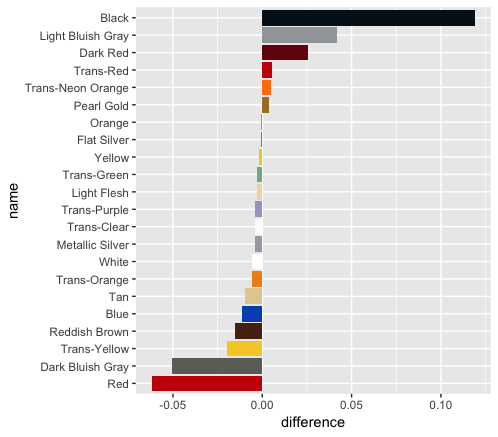
A diferença entre frações
colors_joined <- batmobile_colors %>%
  full_join(batwing_colors, by = "color_id", suffix = c("_batmobile", "_batwing")) %>%
  replace_na(list(total_batmobile = 0, total_batwing = 0)) %>%
  inner_join(colors, by = c("color_id" = "id")) %>%
  mutate(total_batmobile = total_batmobile / sum(total_batmobile),
         total_batwing = total_batwing / sum(total_batwing),
         difference = total_batmobile - total_batwing)

colors_joined
# A tibble: 22 x 6
   color_id total_batmobile total_batwing name              rgb     difference
      <dbl>           <dbl>         <dbl> <chr>             <chr>        <dbl>
 1        0         0.516         0.397   Black             #05131D    0.119
 2        1         0.0314        0.0428  Blue              #0055BF   -0.0114
 3        4         0.0152        0.0770  Red               #C91A09   -0.0618
 4       14         0.0190        0.0209  Yellow            #F2CD37   -0.00190
 5       15         0.0152        0.0209  White             #FFFFFF   -0.00570
 6       36         0.0143        0.00856 Trans-Red         #C91A09    0.00570
 7       57         0.00760       0.00285 Trans-Neon Orange #FF800D    0.00475
 8       71         0.192         0.150   Light Bluish Gray #A0A5A9    0.0418
 9       72         0.152         0.202   Dark Bluish Gray  #6C6E68   -0.0504
10      182         0.00760       0.0133  Trans-Orange      #F08F1C   -0.00570
# … with 12 more rows
Visualizando os dados
library(ggplot2)
library(forcats)

color_palette <- setNames(colors_joined$rgb, colors_joined$name)

colors_joined %>%
  mutate(name = fct_reorder(name, difference)) %>%
  ggplot(aes(name, difference, fill = name)) +
  geom_col() +
  coord_flip() +
  scale_fill_manual(values = color_palette, guide = "none")
Visualizando os dados
Comparando temas de Batman e Star Wars
Vamos praticar!
Combinando dados com dplyr

