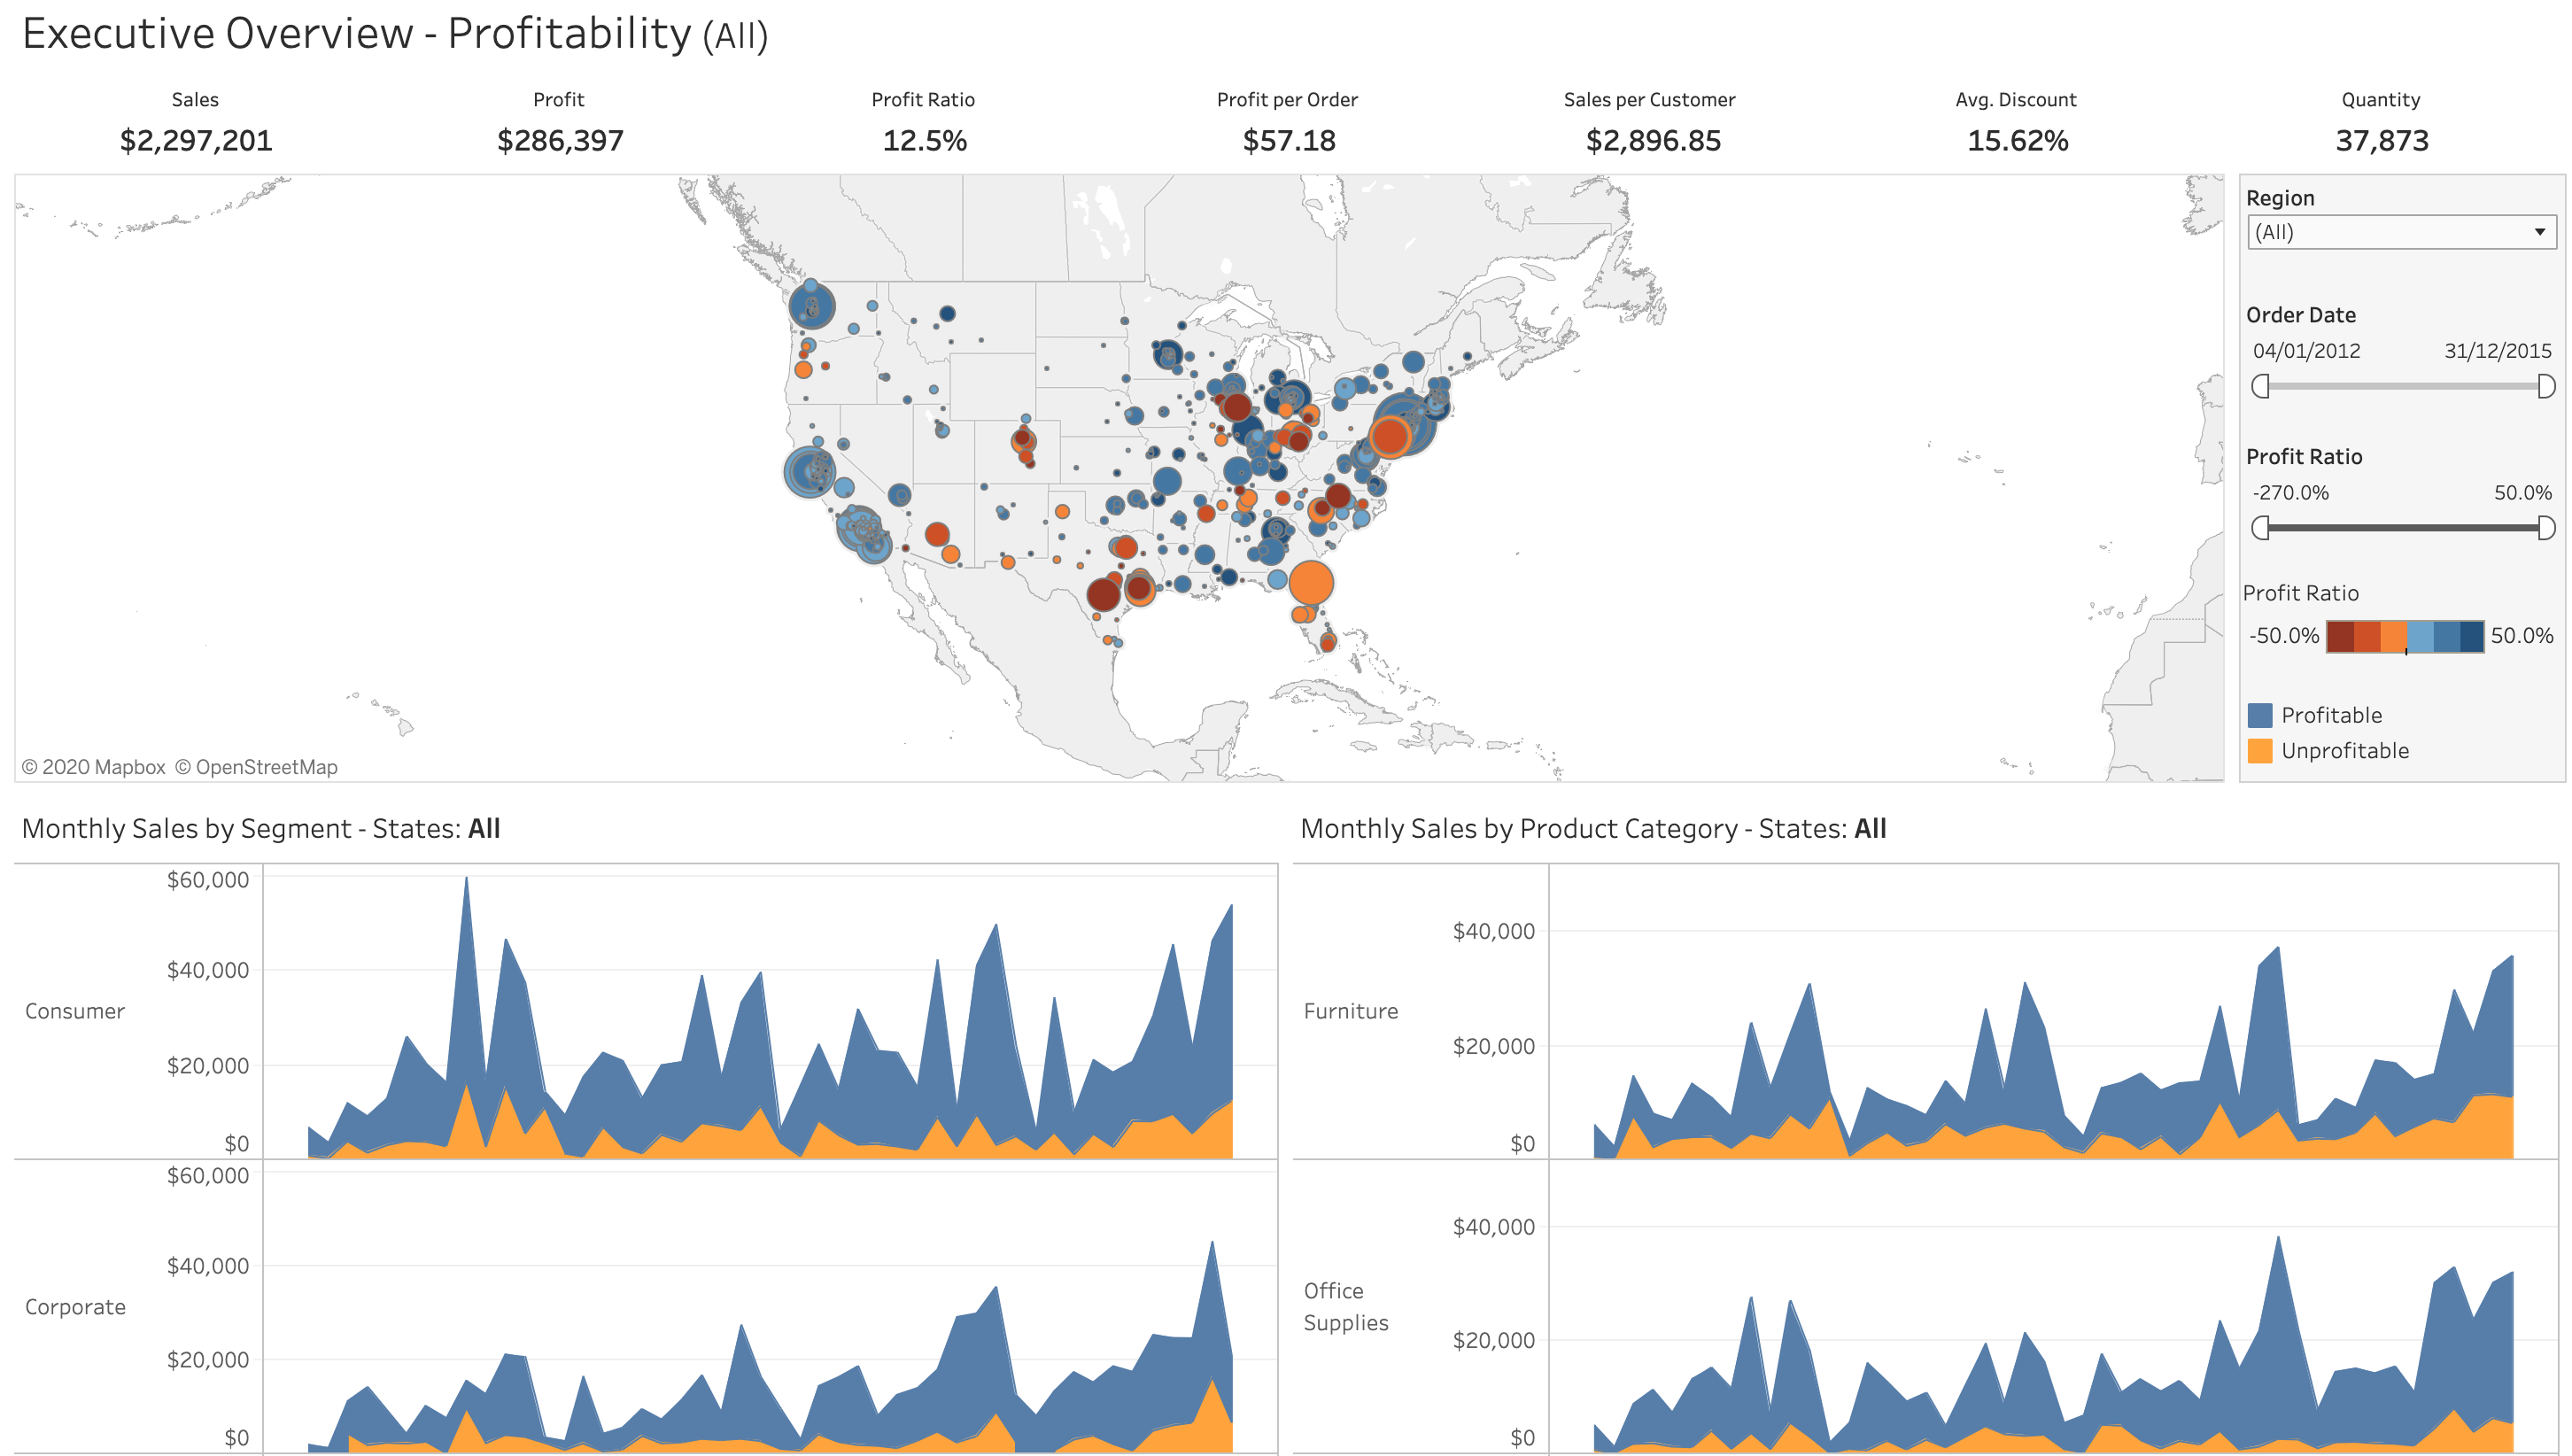
Criando dashboards
Criando dashboards no Tableau

Sara Billen
Curriculum Manager, DataCamp
1 https://www.tableau.com/solutions/gallery/superstore
Dashboards
$$
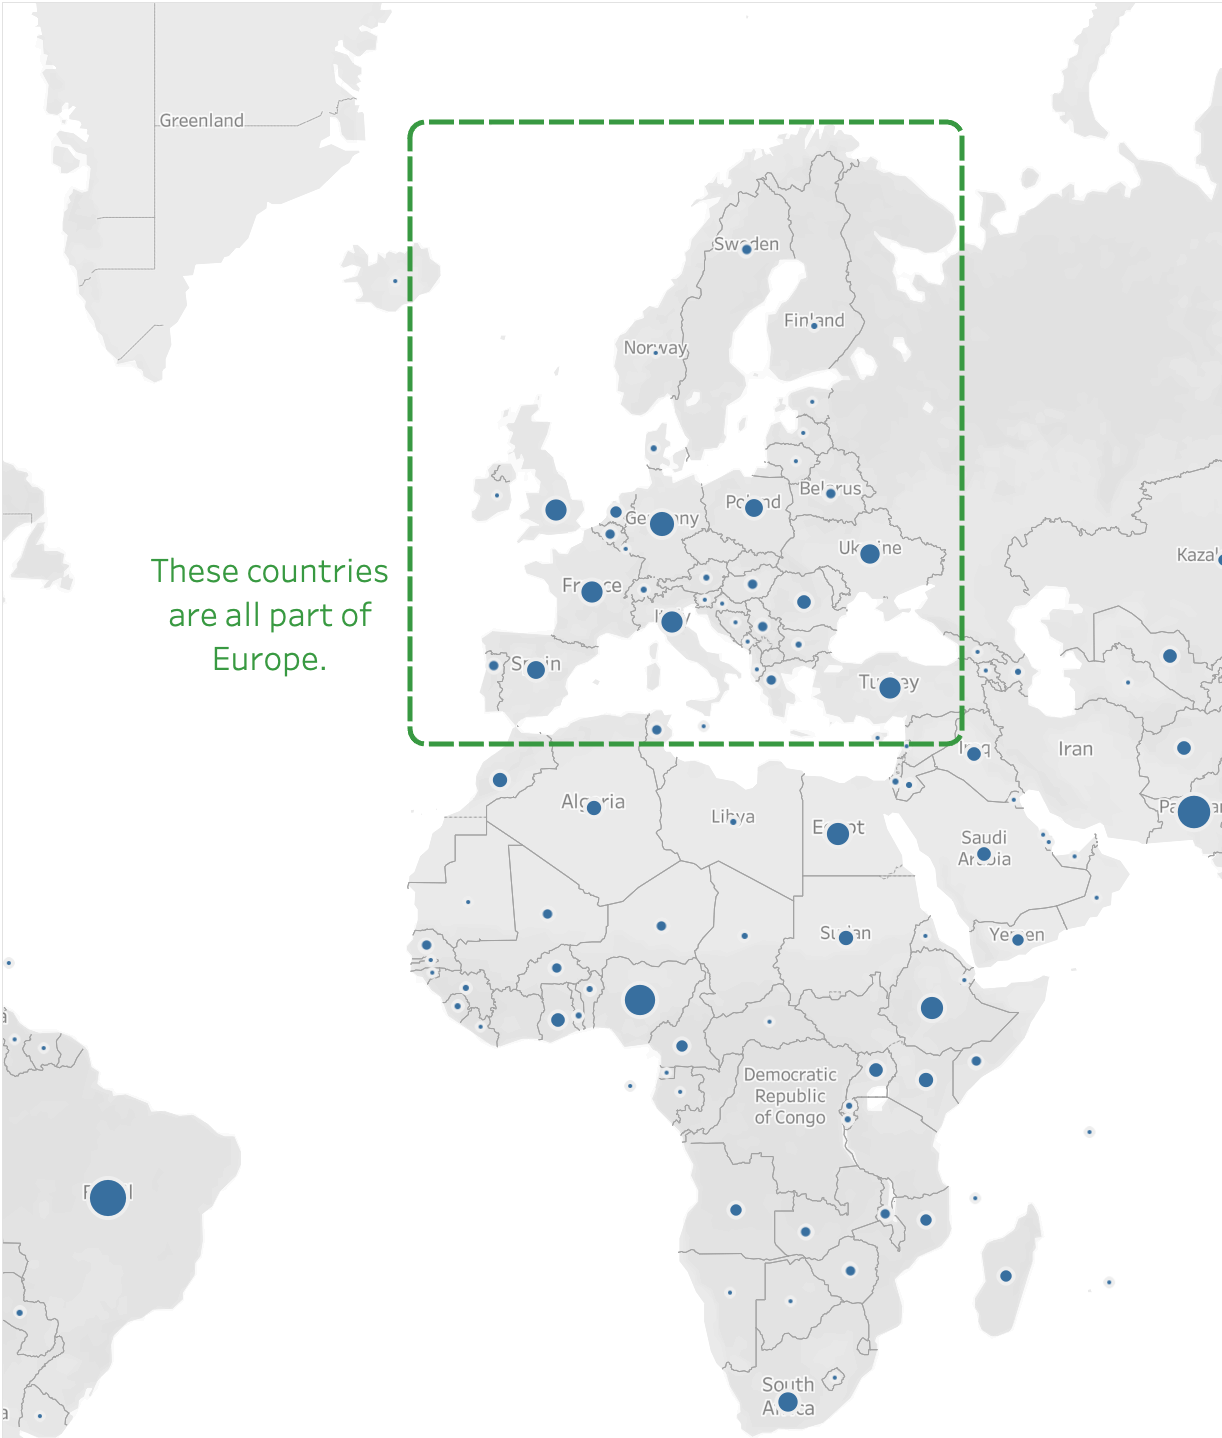
Anotando dashboards
Dados da Divvy

1 Crédito da foto: Arvell Dorsey Jr., Chicago, IL, Estados Unidos

