Distribuições e outliers
Análise Exploratória de Dados no Power BI

Jacob H. Marquez
Data Scientist at Microsoft
O que são histogramas?
O que são histogramas? - bins
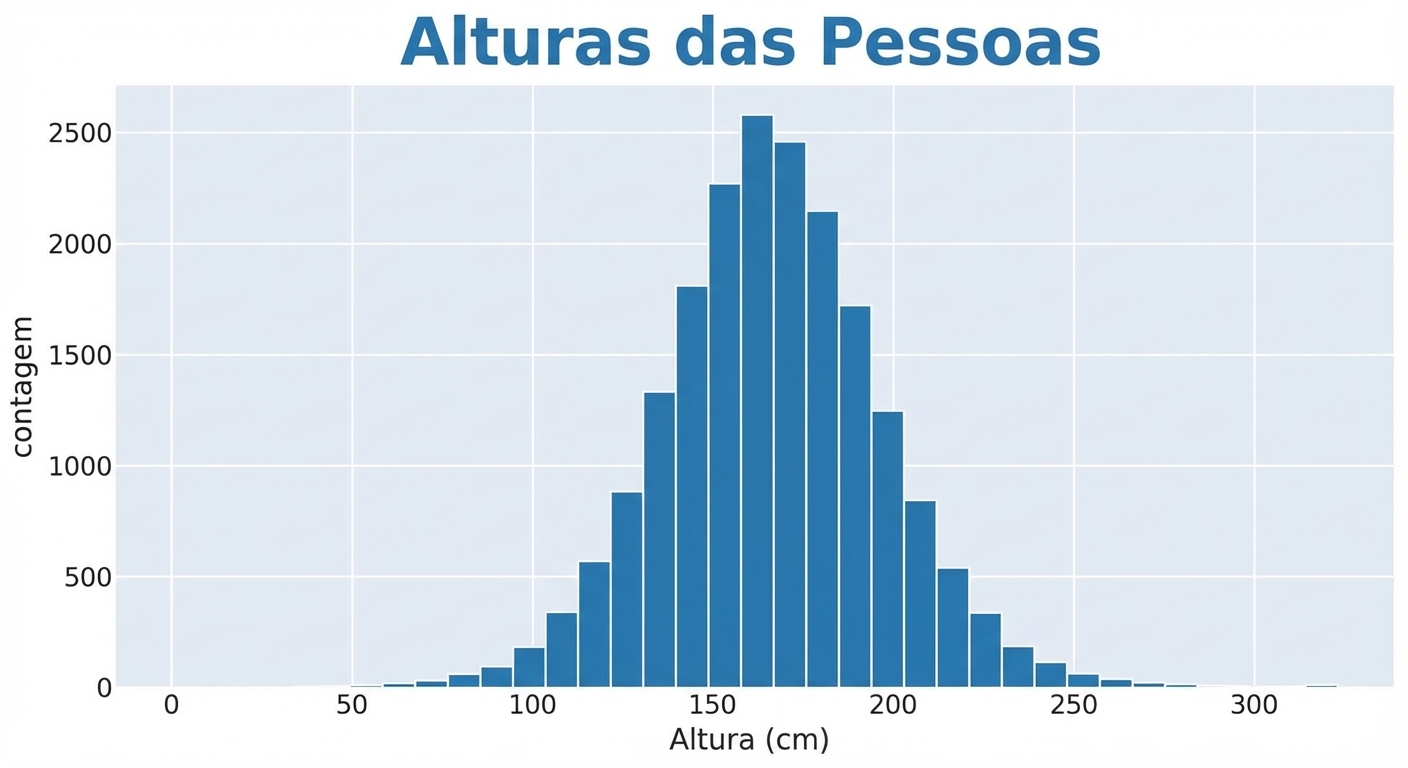
Histograma com 100 bins
Histograma com 20 bins
Lendo histogramas - centralidade e assimetria
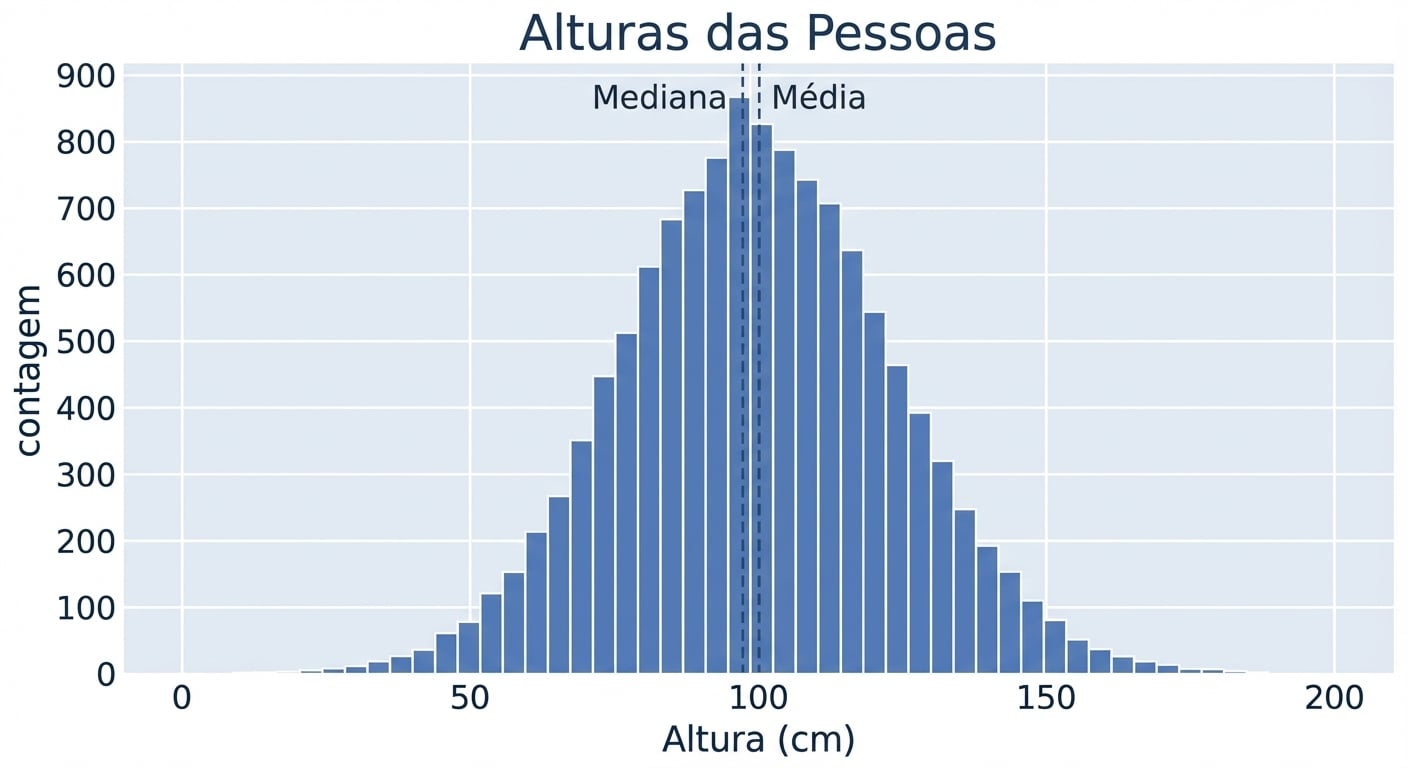
Distribuição normal
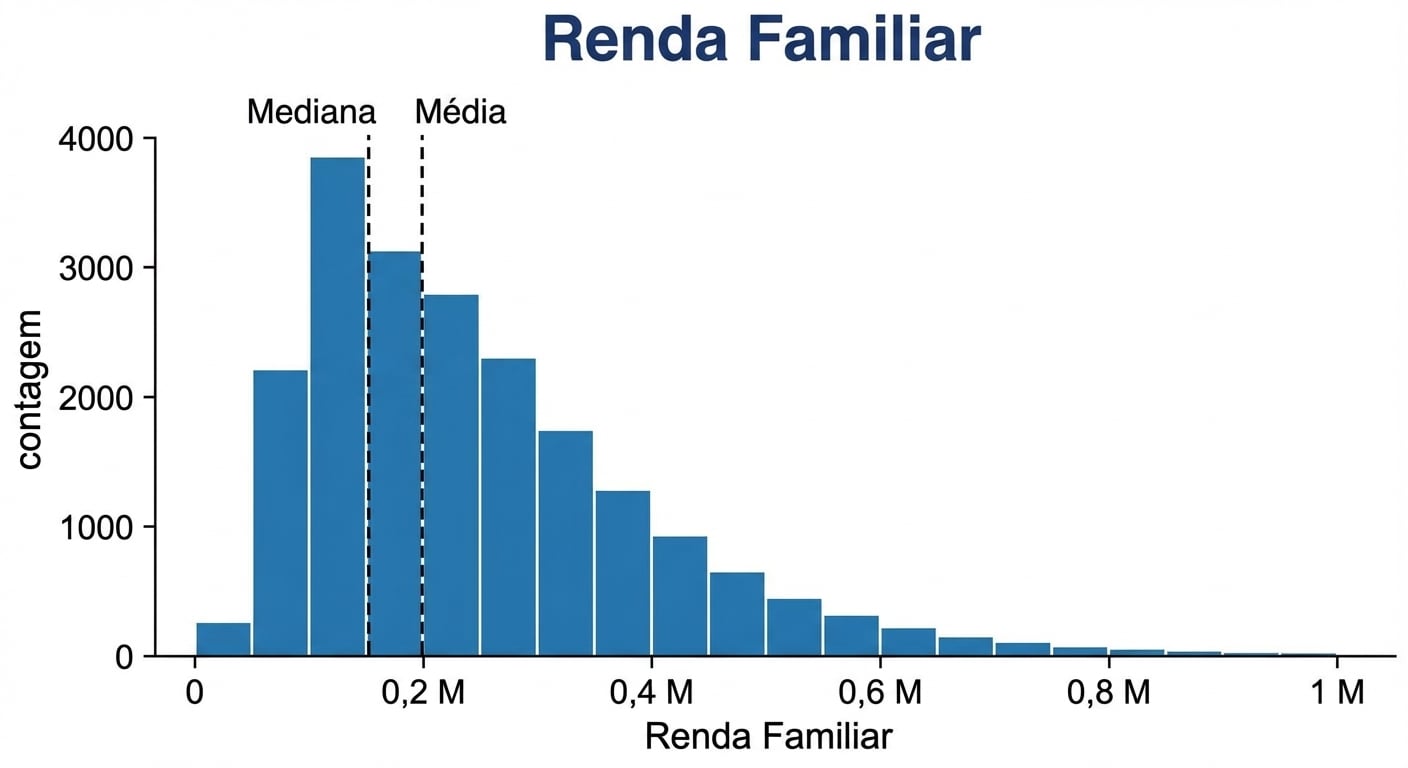
Distribuição com cauda à direita
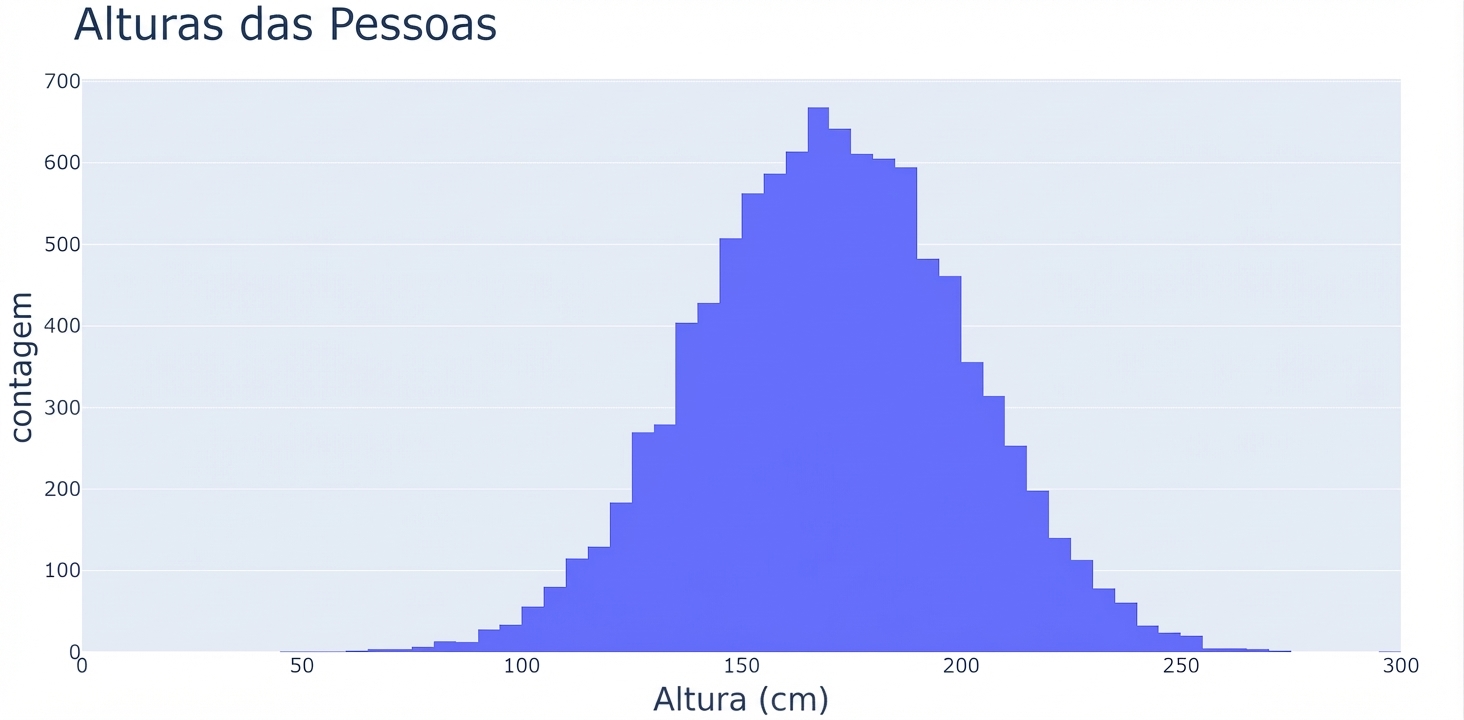
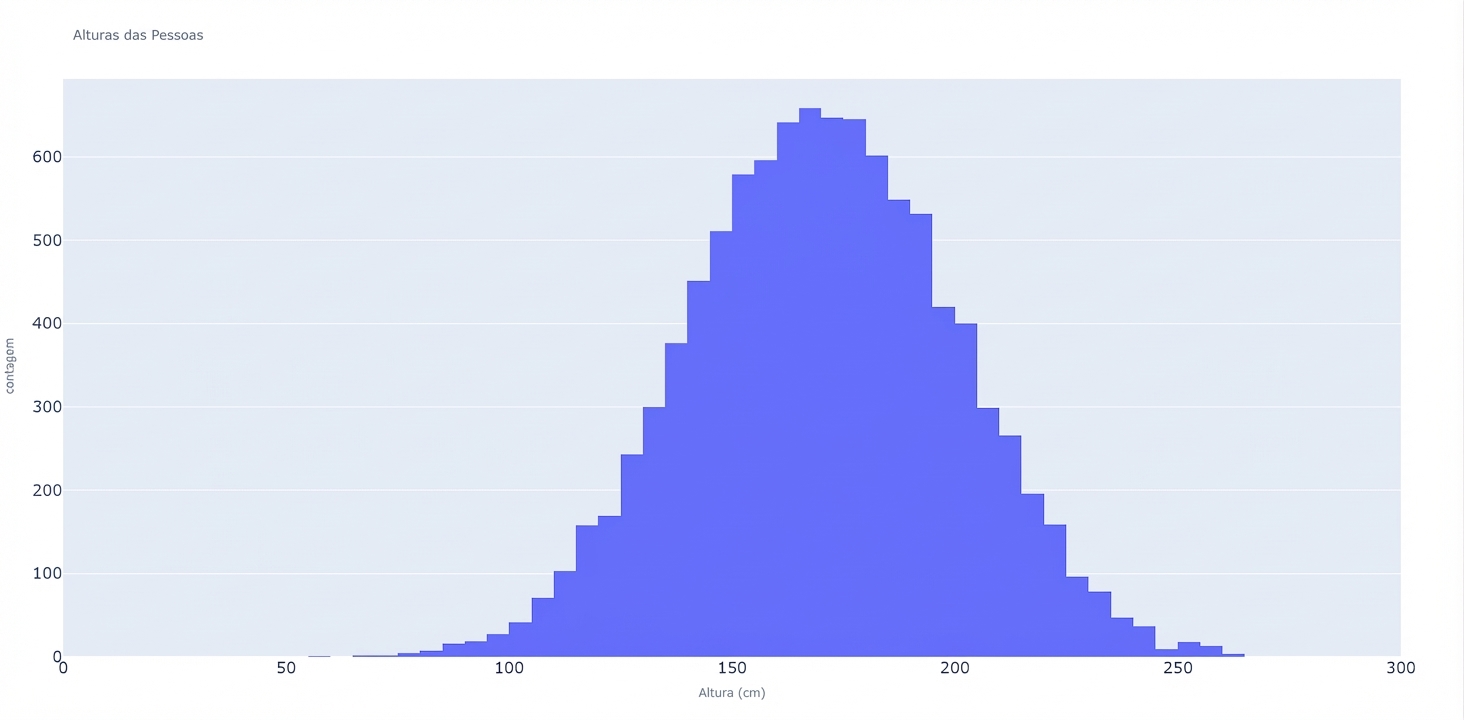
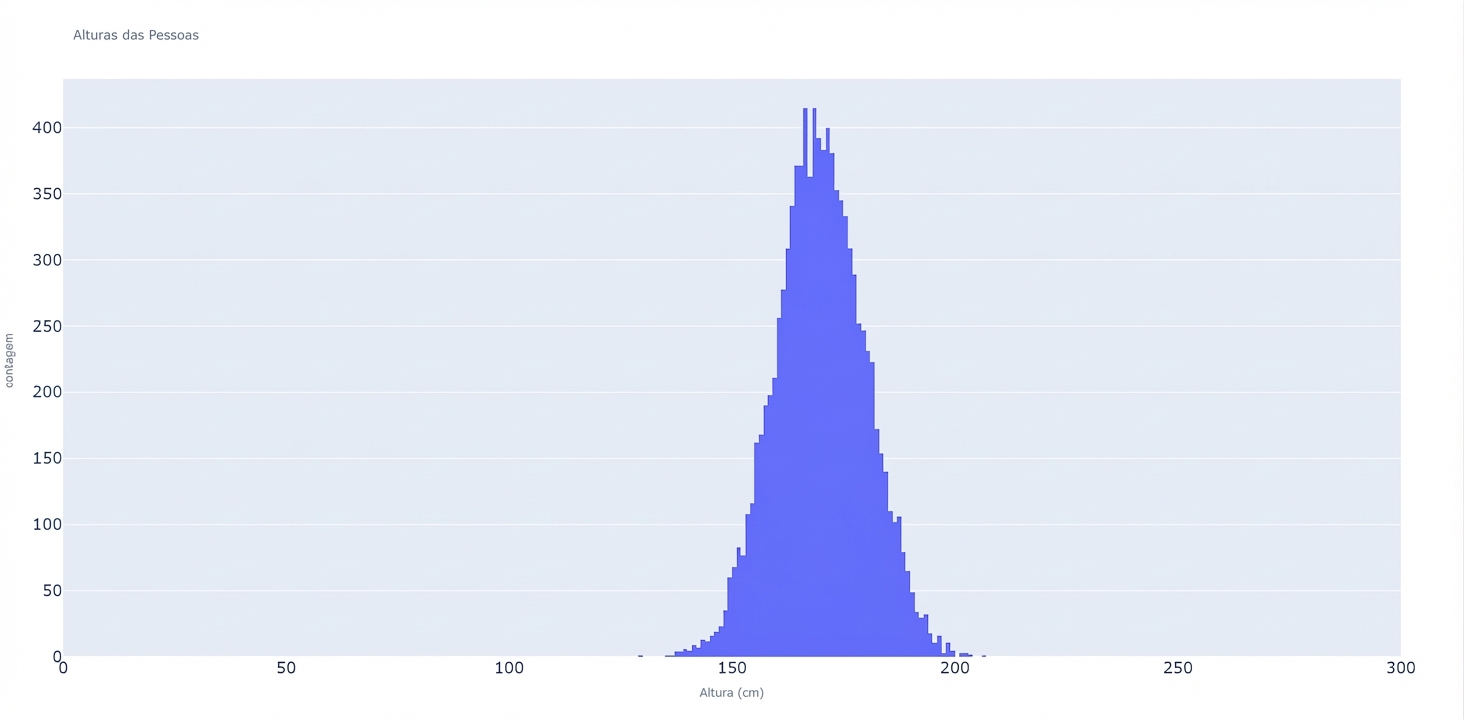
Lendo histogramas - dispersão
Desvio padrão maior
Desvio padrão menor
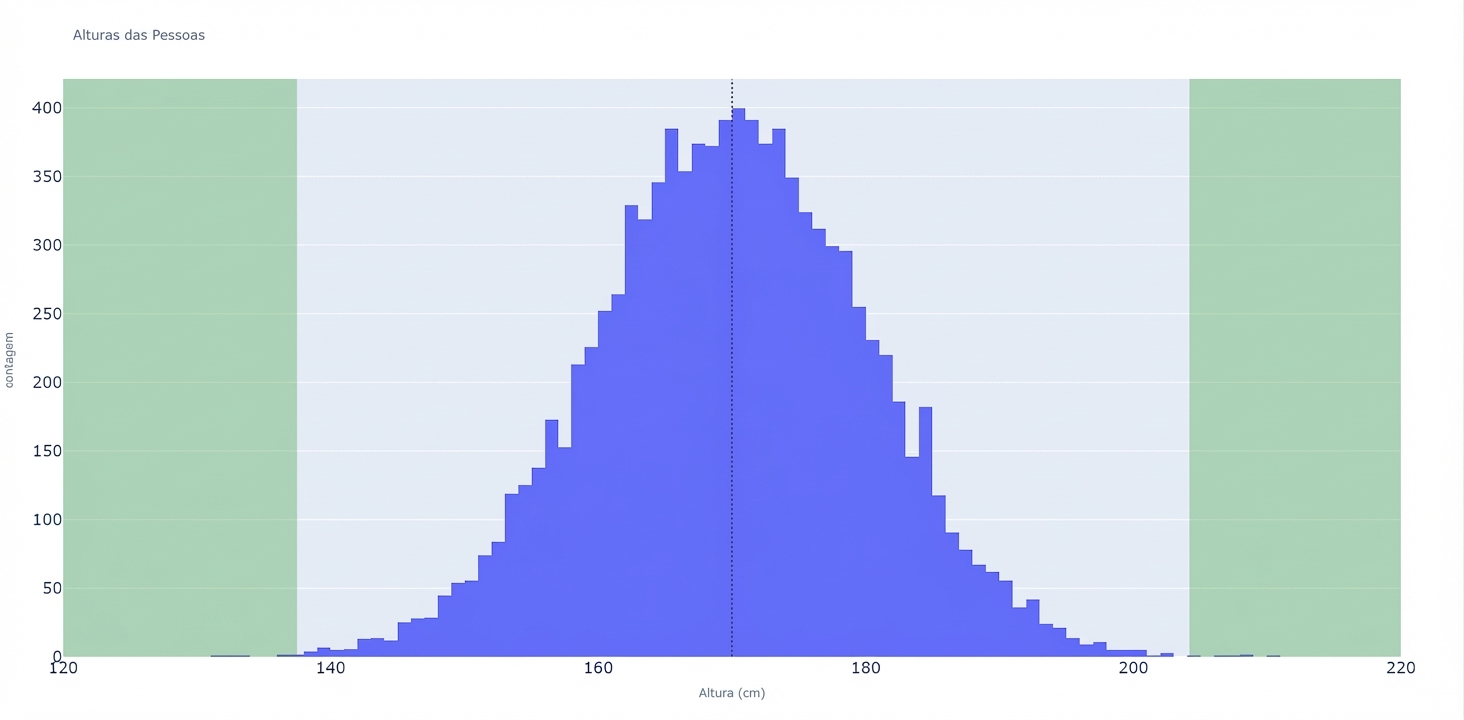
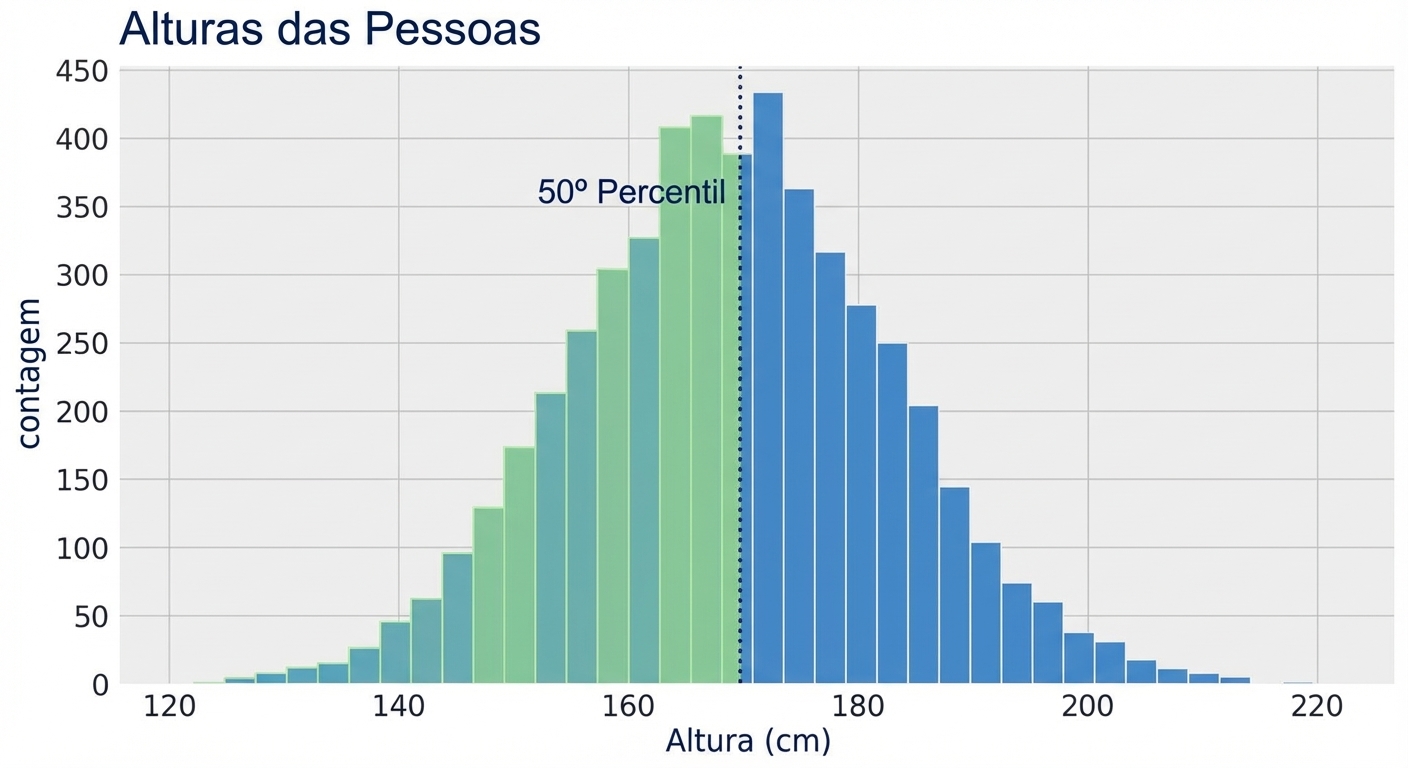
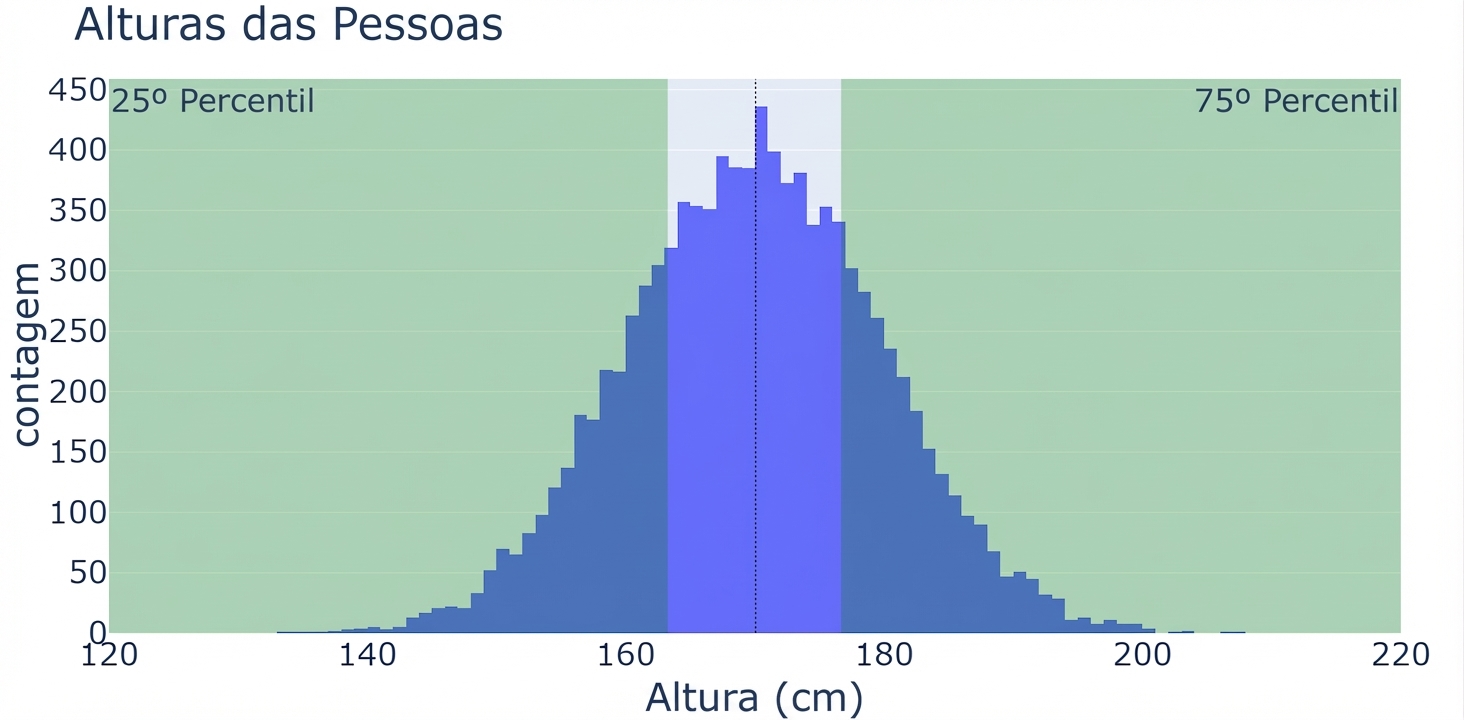
Lendo histogramas - percentis
Lendo histogramas - 25º e 75º percentis
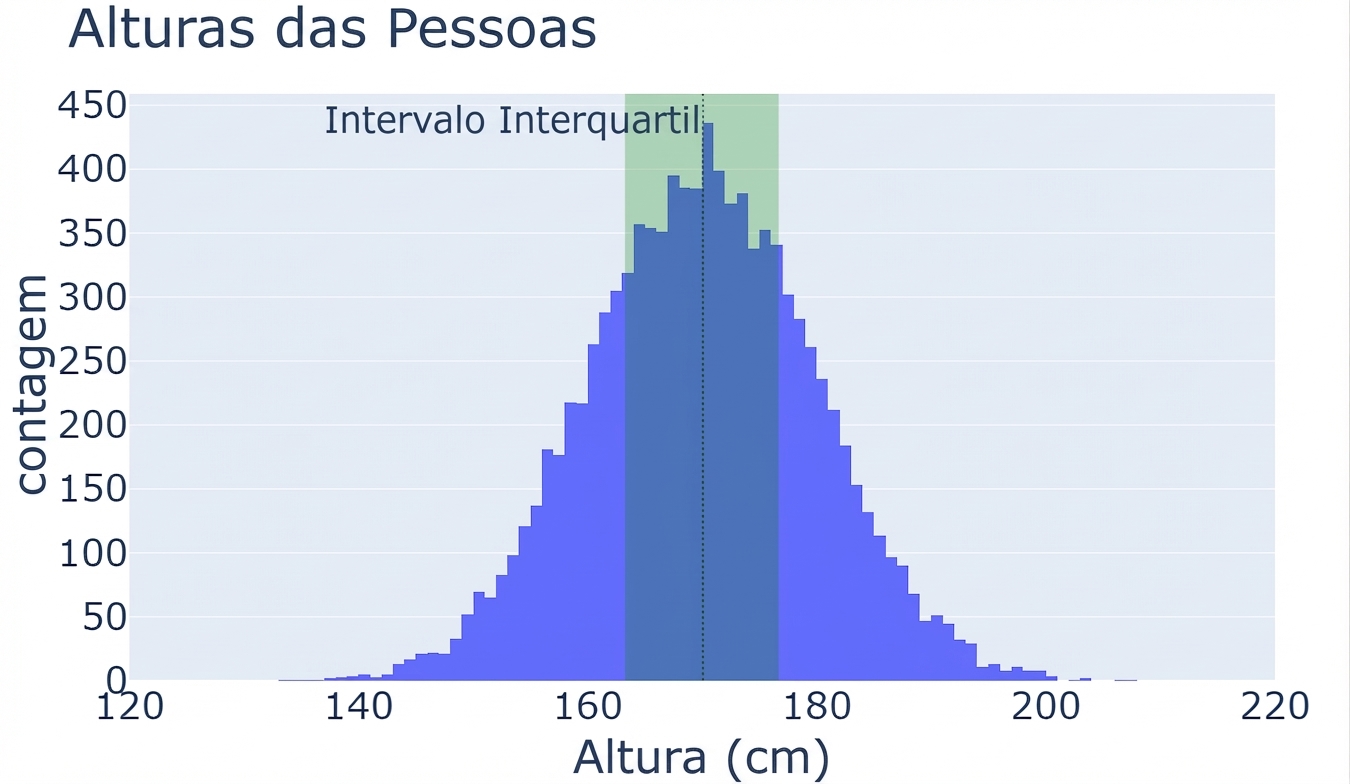
Lendo histogramas - intervalo interquartil
O que é um outlier?