Introduction to data visualization
Data Visualization in Databricks

Gang Wang
Senior Data Scientist
Your data visualization partner

What is data visualization?
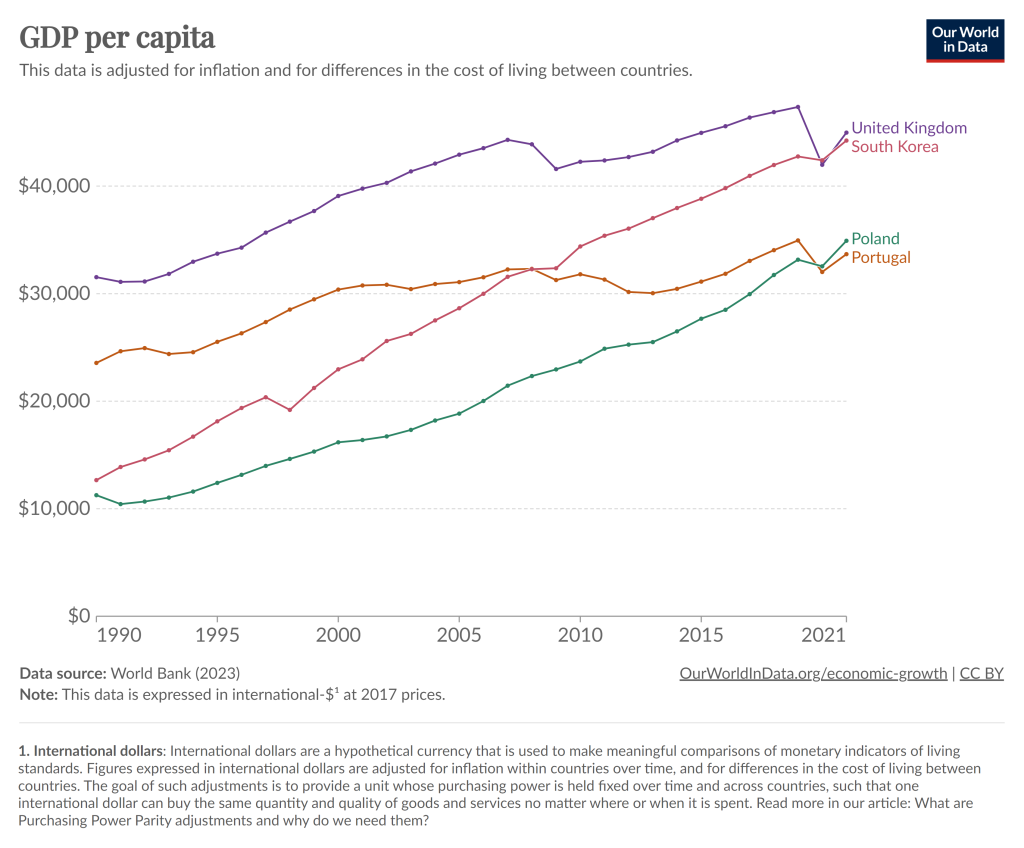
1 Pictures: Economist Writing Every Day, The Economist
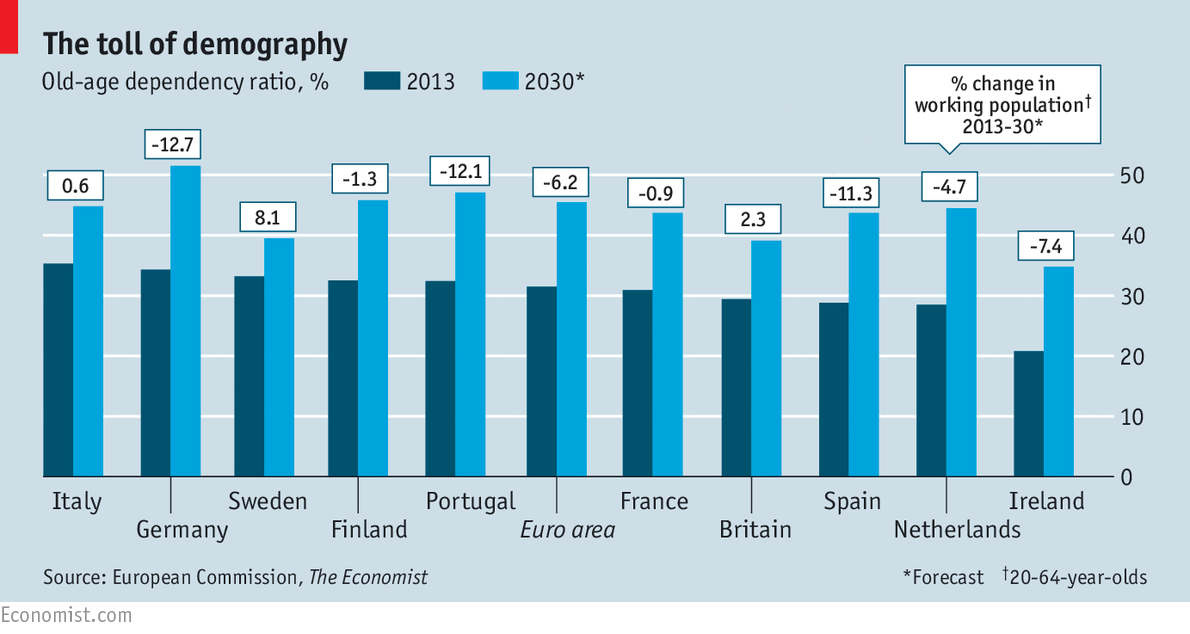
Why we need data visualization?
1 Pictures: Kovair
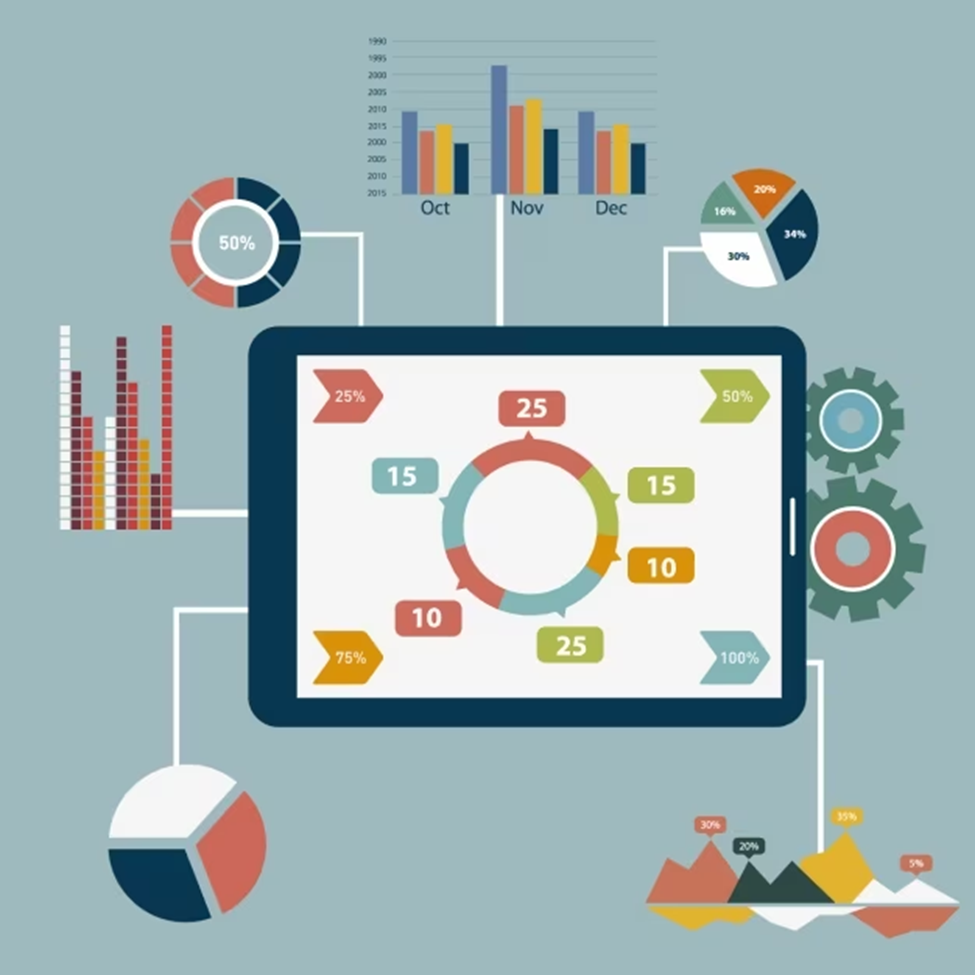
Key statistical concepts for visualization
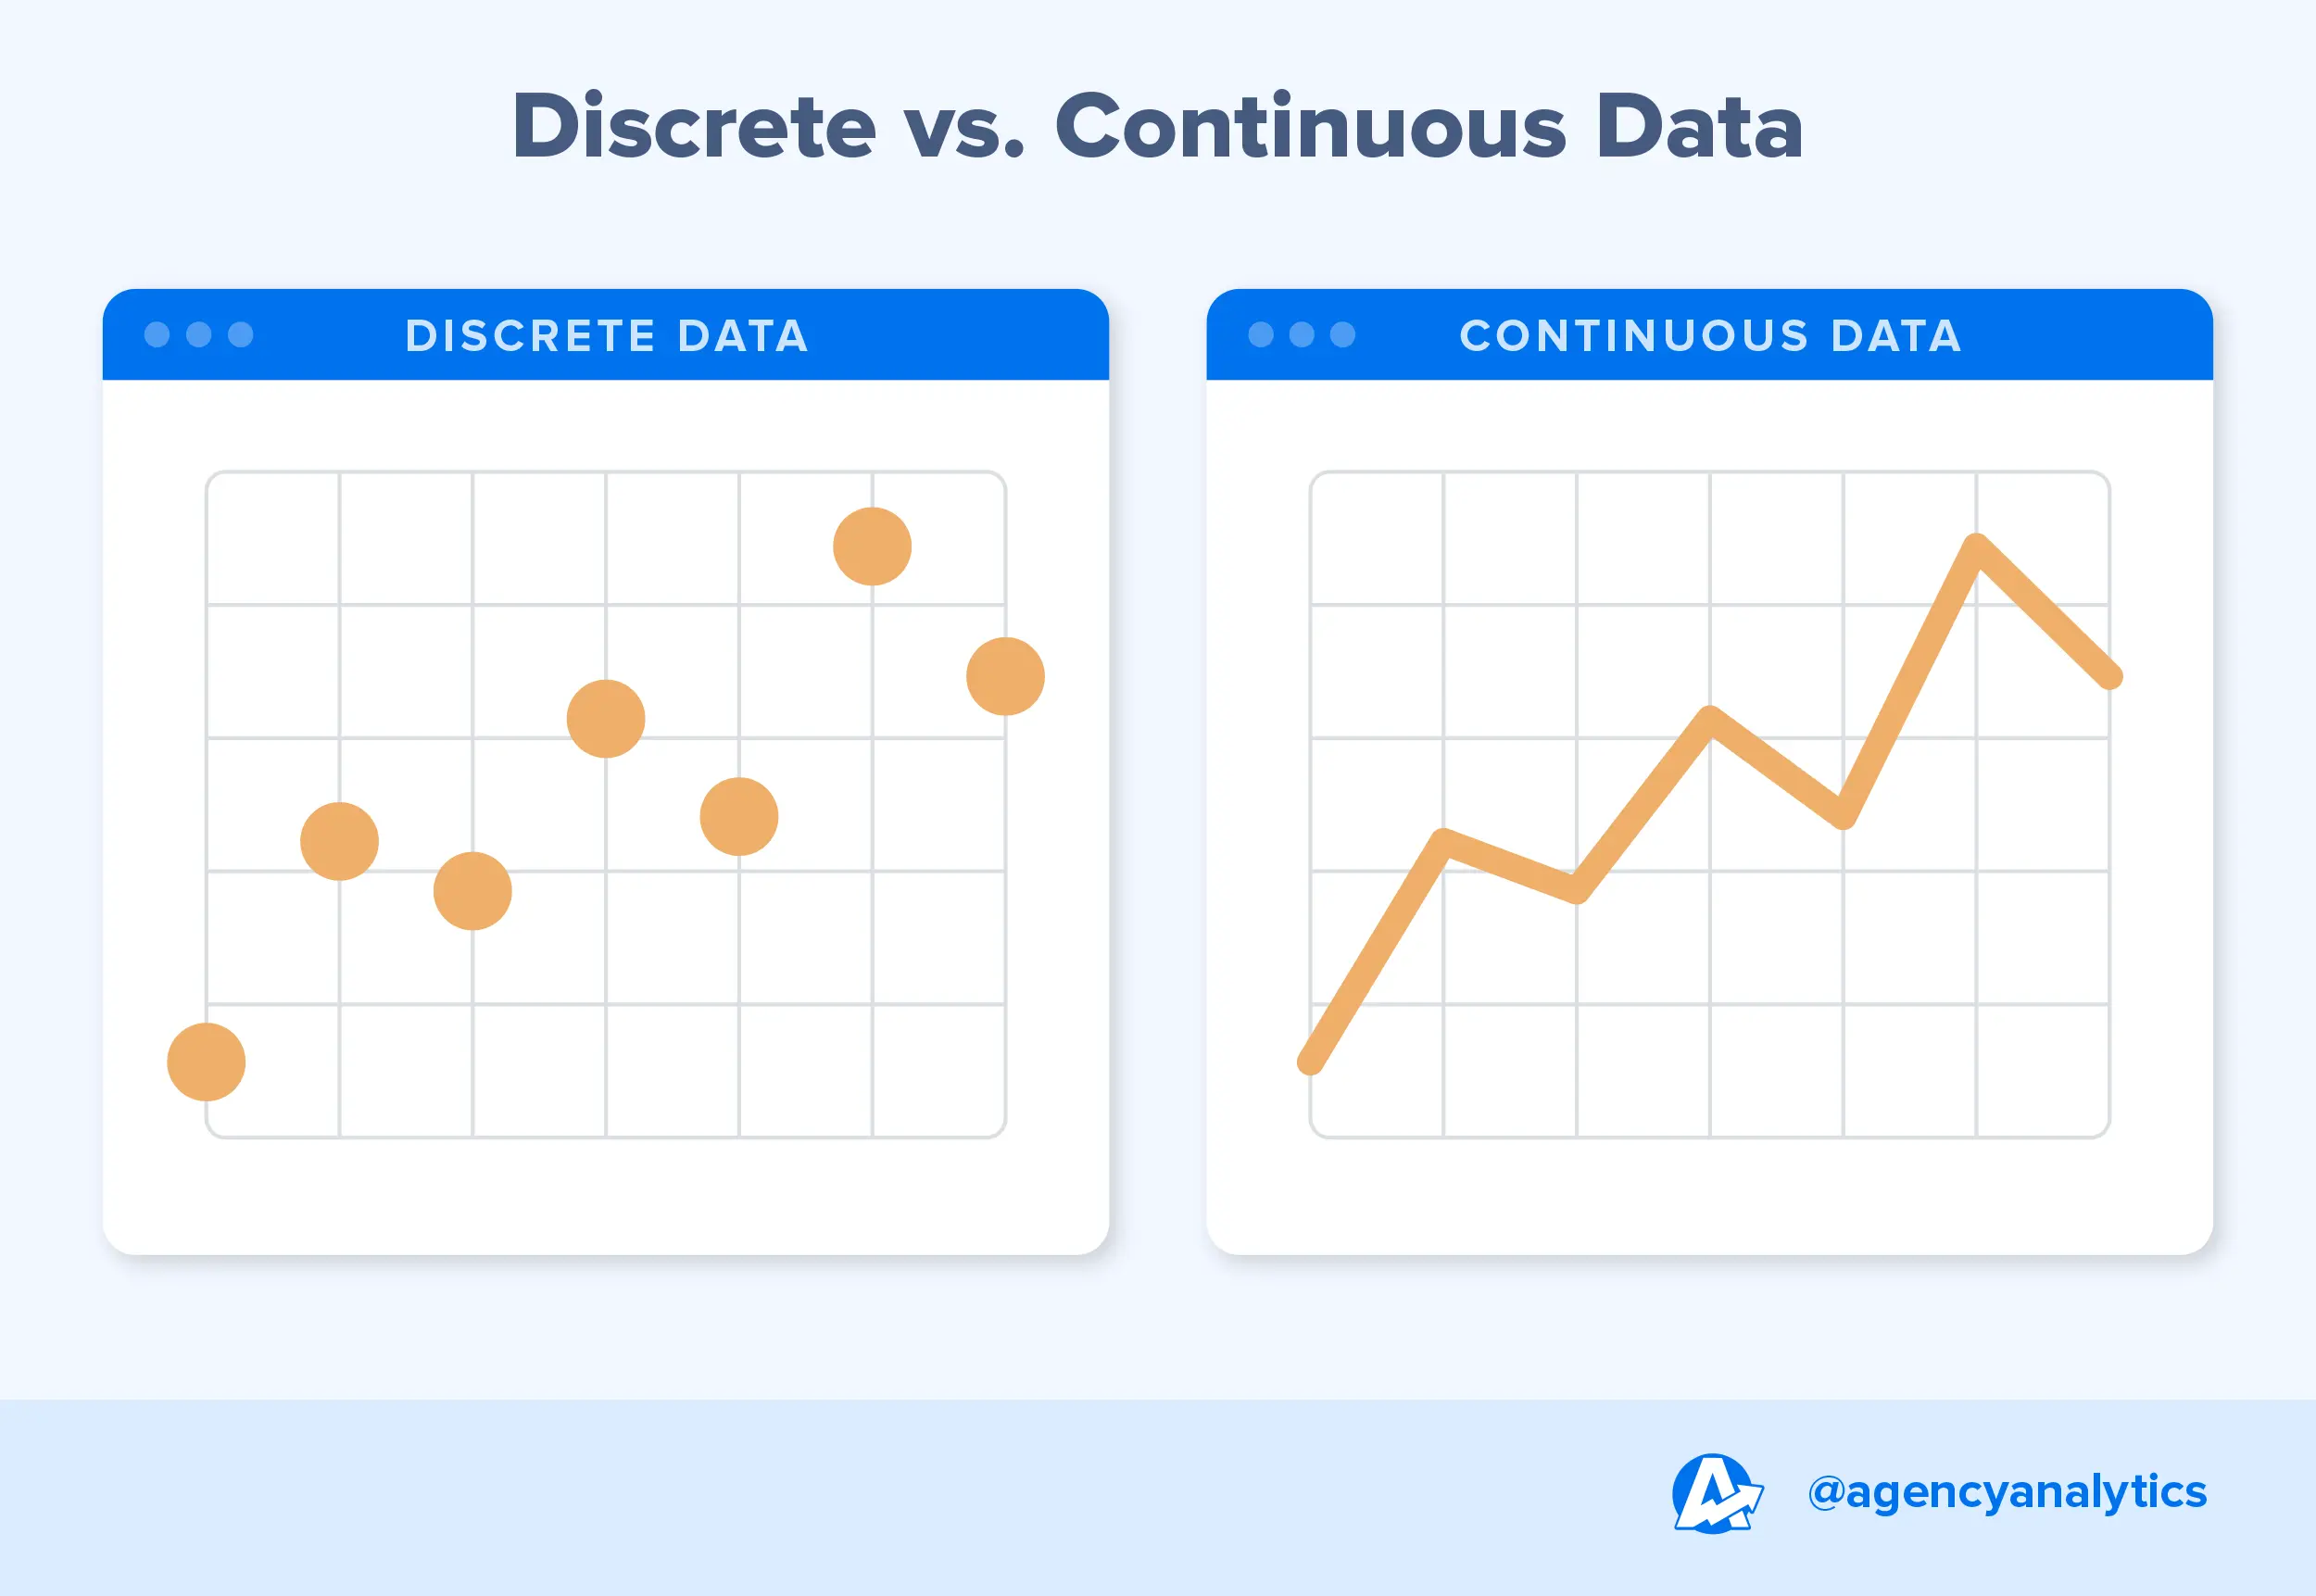
1 Pictures: AgencyAnalytics
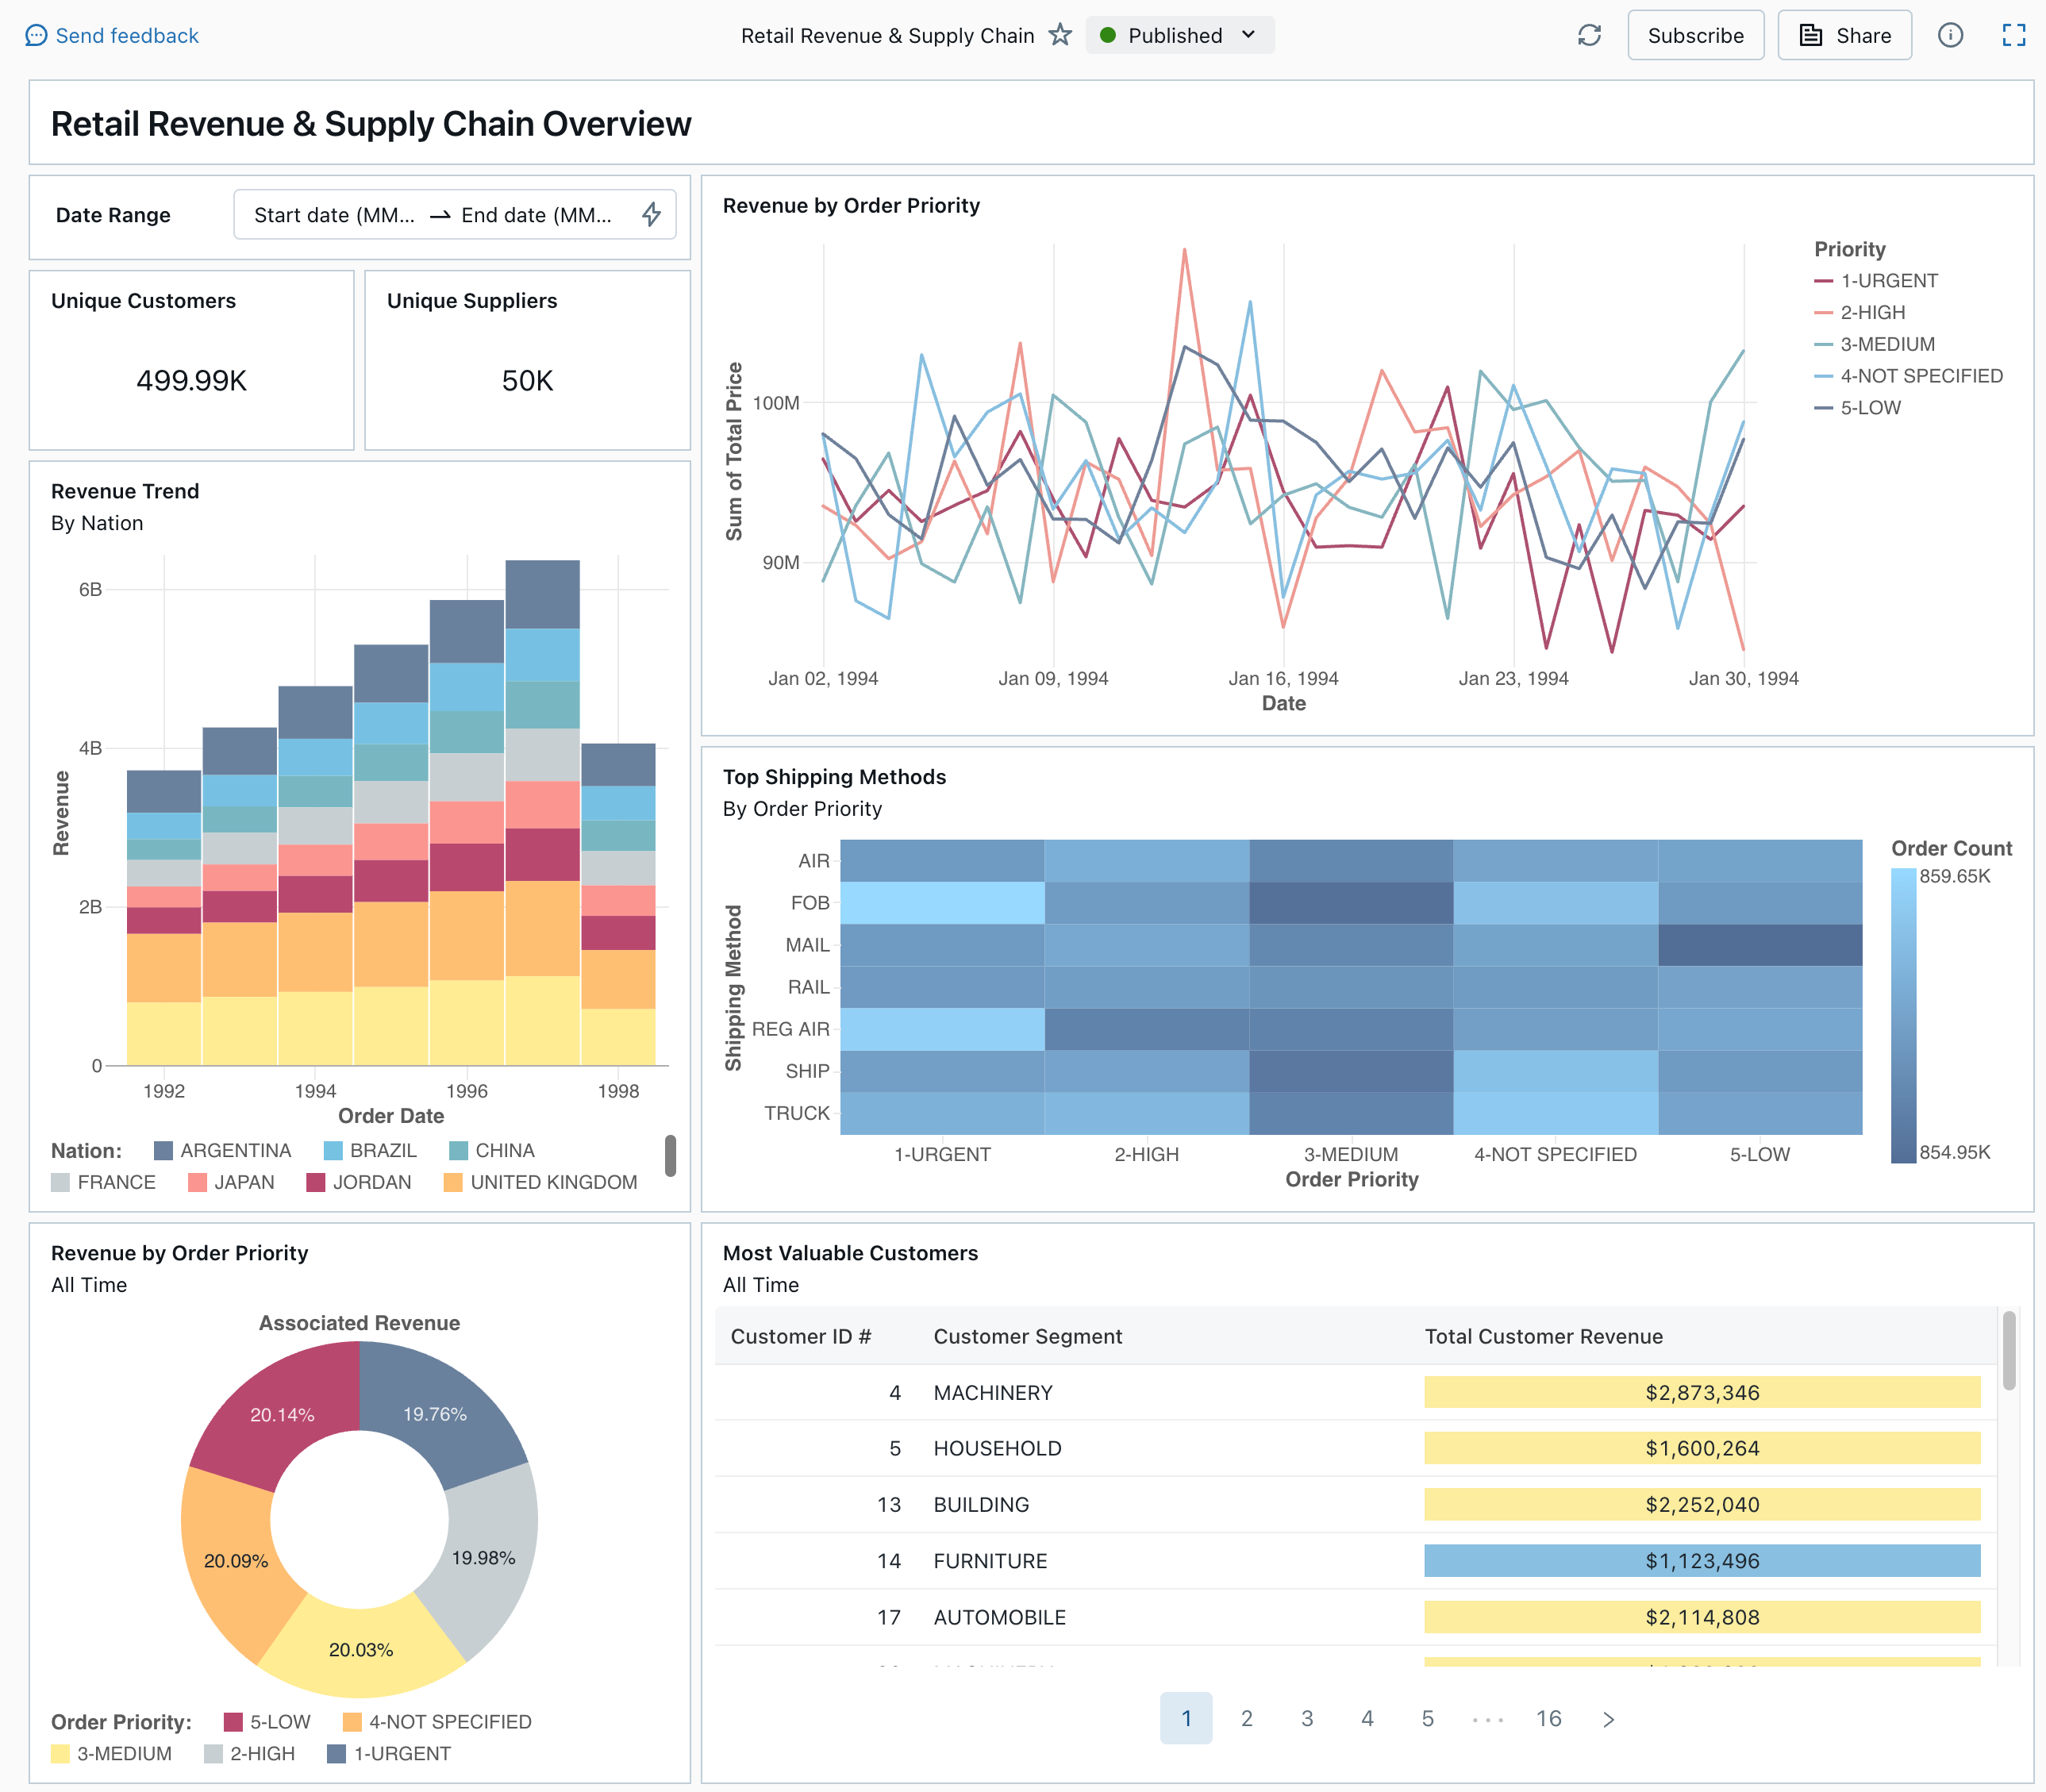
Databricks for data visualization