Introduction to dashboards

Data Visualization in Databricks

Gang Wang

Senior Data Scientist

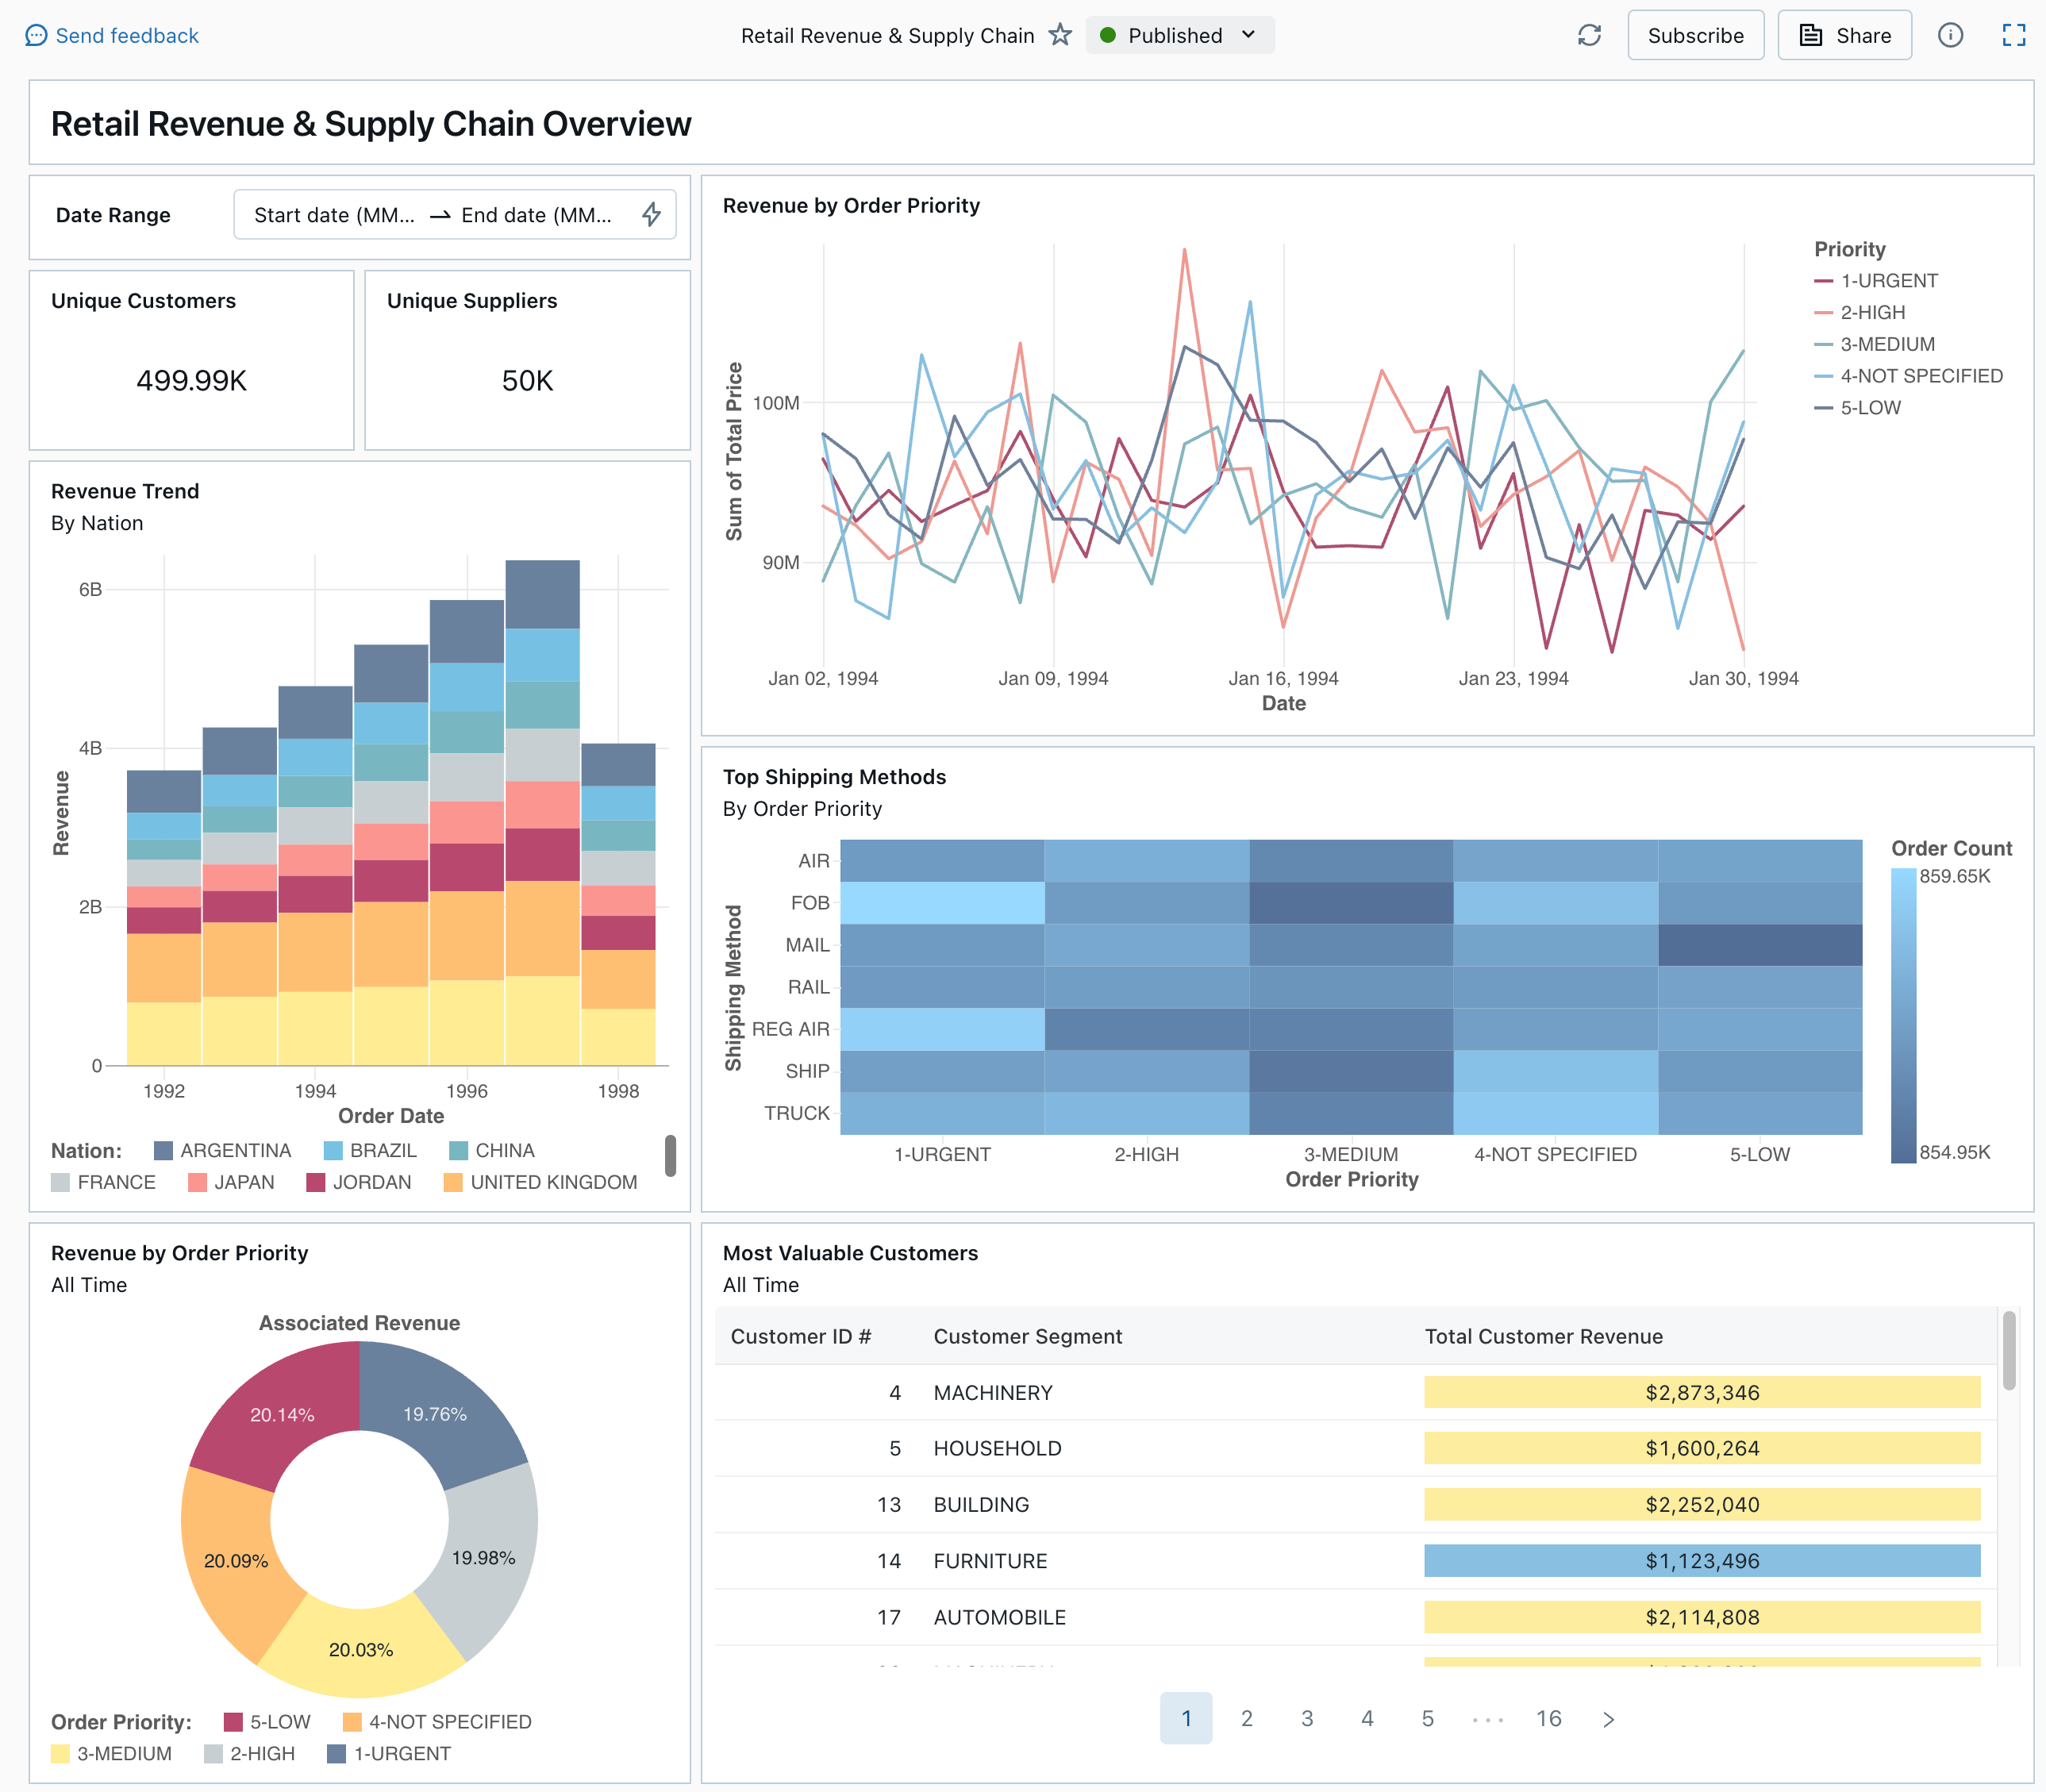
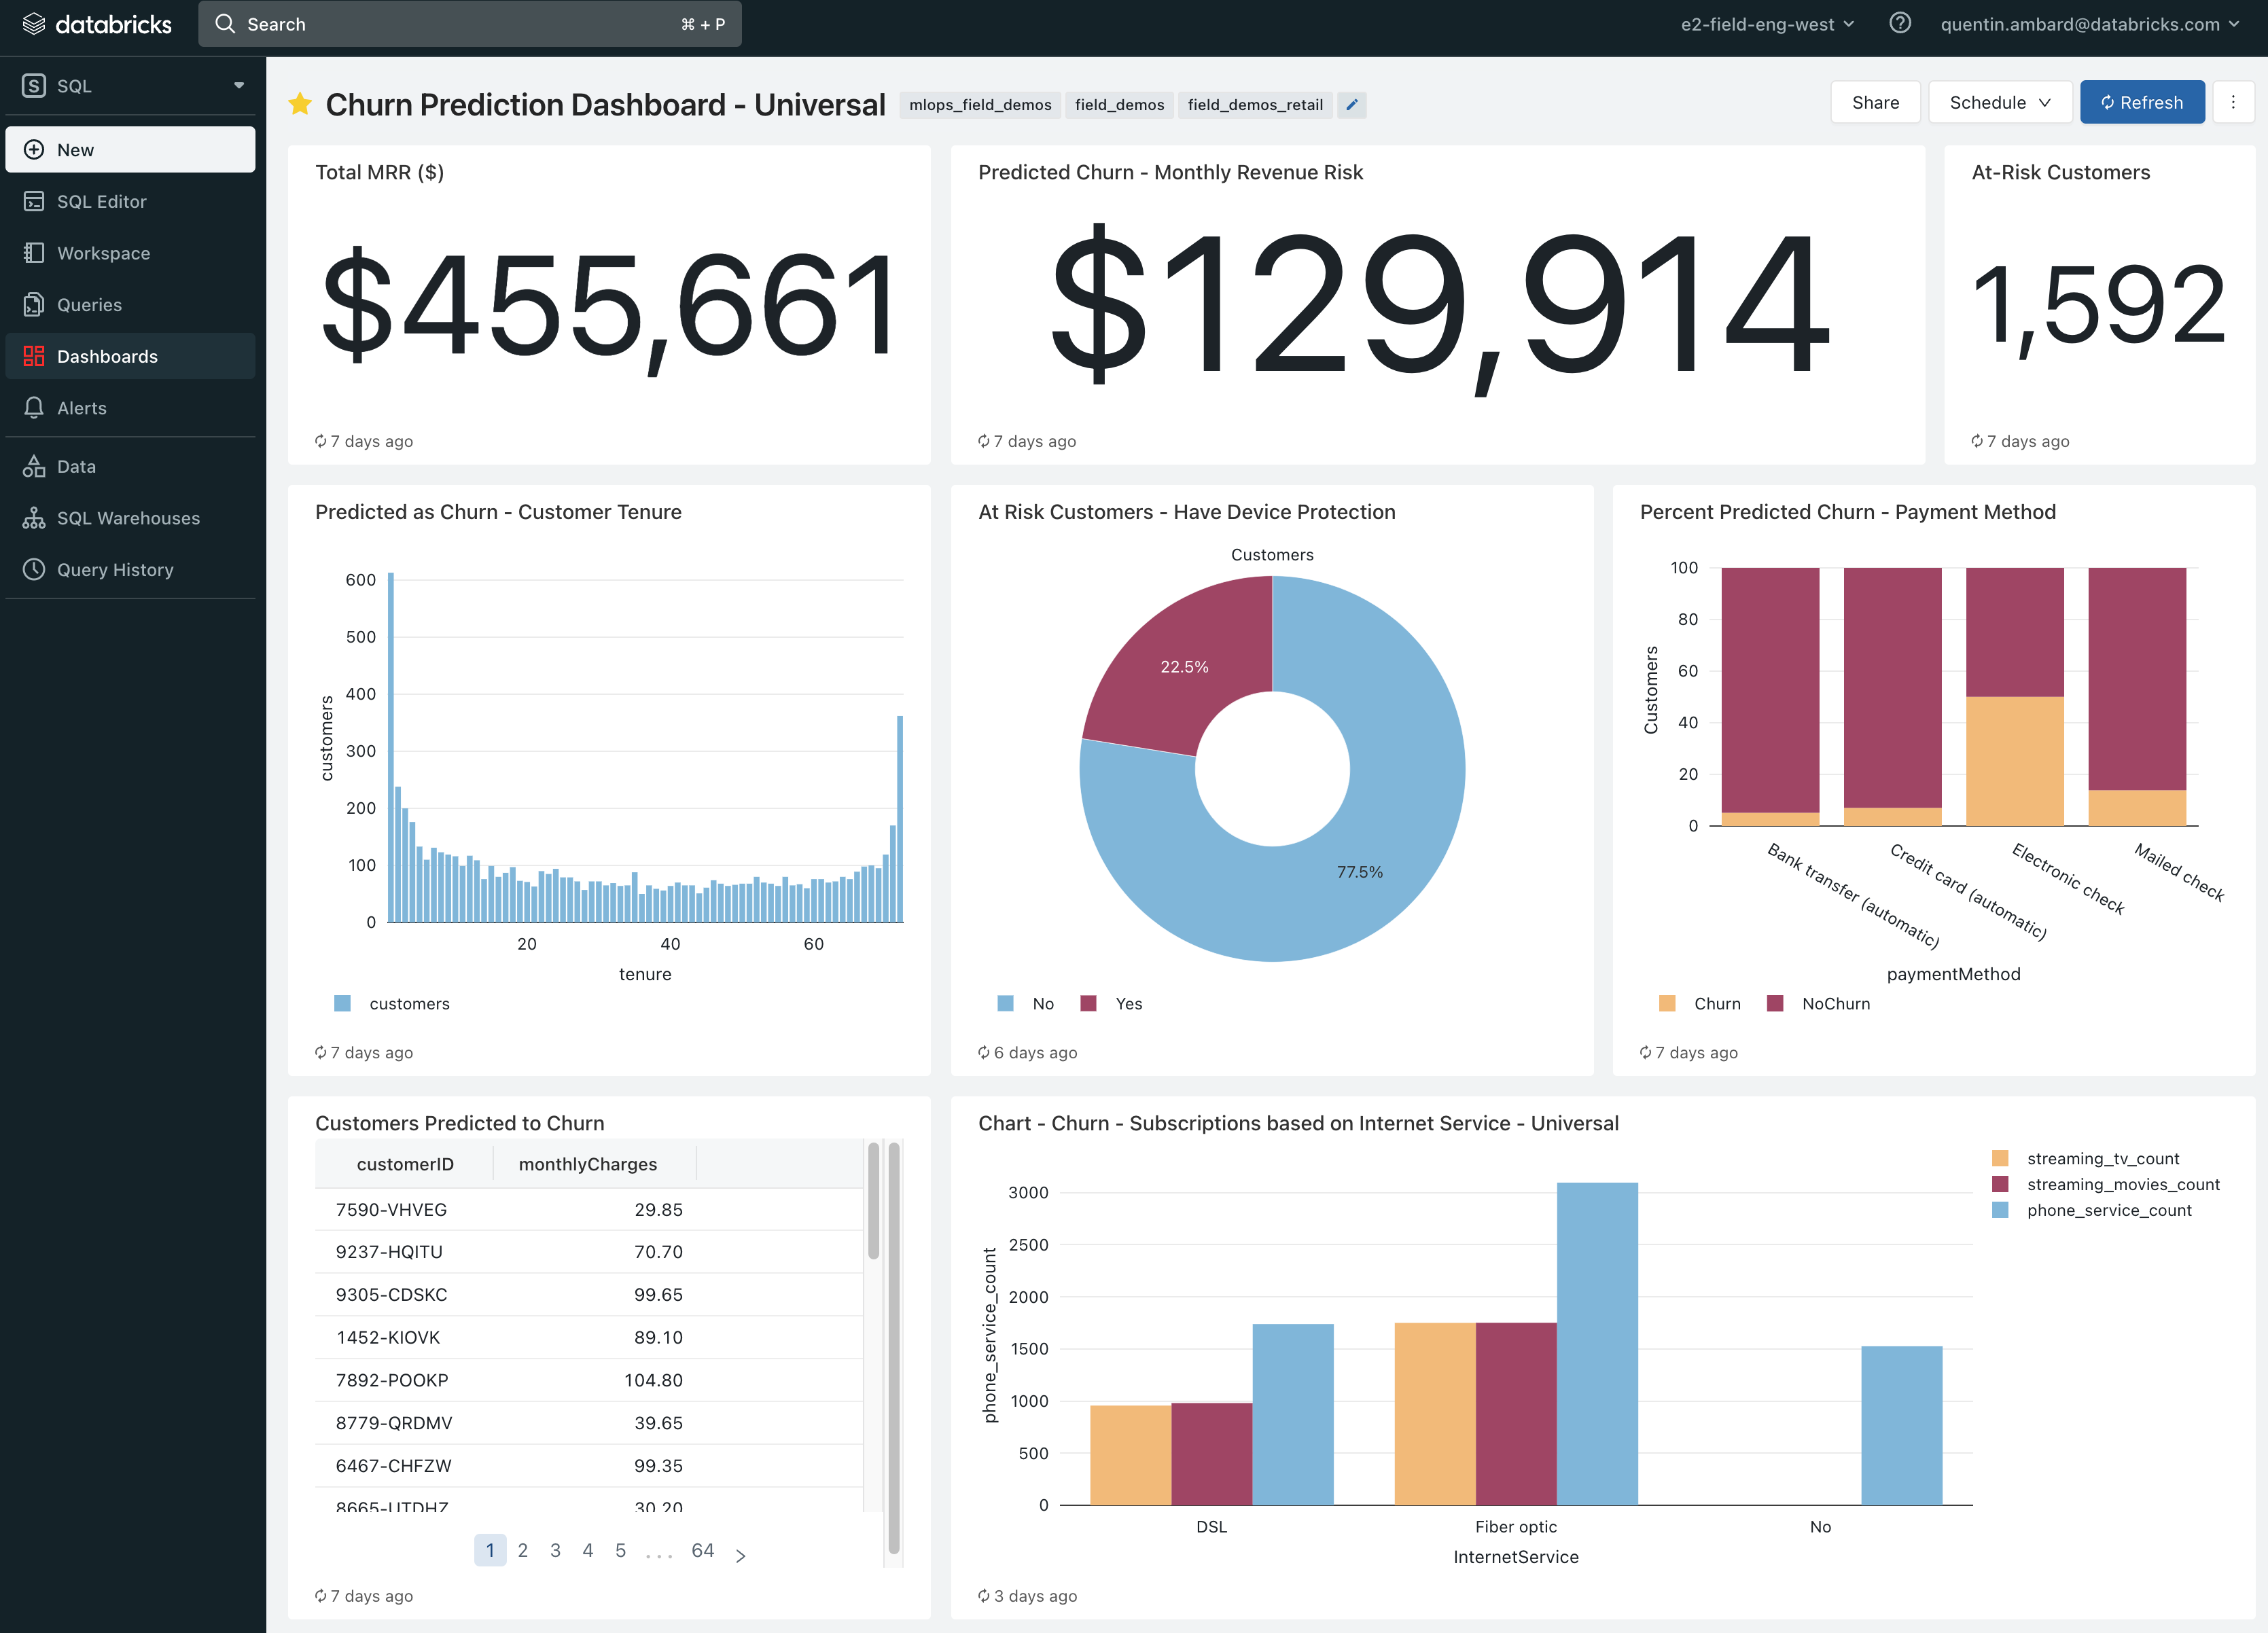
What is a dashboard?


  • Is a space for multiple visualizations
  • Displays related data together
  • Simplifies complex information
  • Helps compare metrics at a glance

Databricks dashboard example

Data Visualization in Databricks

Dashboards improve decision-making


Dashboards can:

  • Identify trends quickly
  • Track real-time data
  • Make faster, informed decisions
  • Support business strategy


Dashboard example

Data Visualization in Databricks

Key components of a dashboard


Components:

  • Bar Charts: compare values
  • Line Charts: show trends
  • Maps: visualize locations
  • Counter Plots: show key performance indicators (KPIs)
  • Filters and tools: customize views


Dashboard example

Data Visualization in Databricks

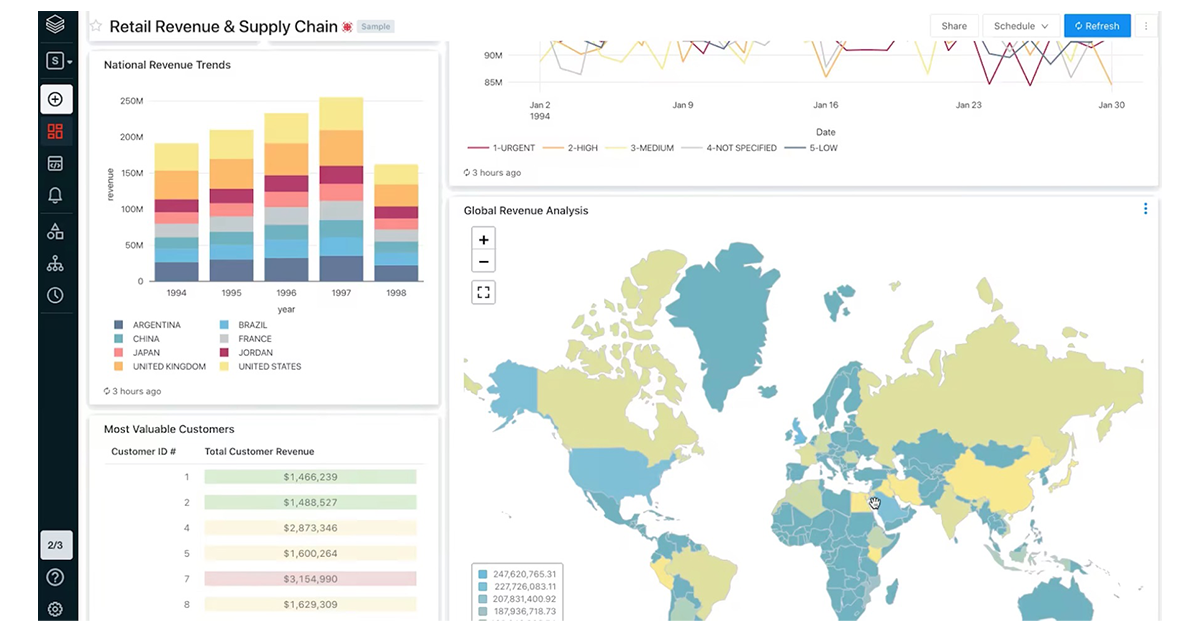
Dashboards bring insights together


Dashboards

  • Create clear views of your data
  • Combine visuals to tell a story


Next

  • Learn how to create dashboards
  • Customize layout and style

  Dashboard example

Data Visualization in Databricks

Let's practice!

Data Visualization in Databricks

Preparing Video For Download...