Map visualizations

Data Visualization in Databricks

Gang Wang

Senior Data Scientist

What are map visualizations?
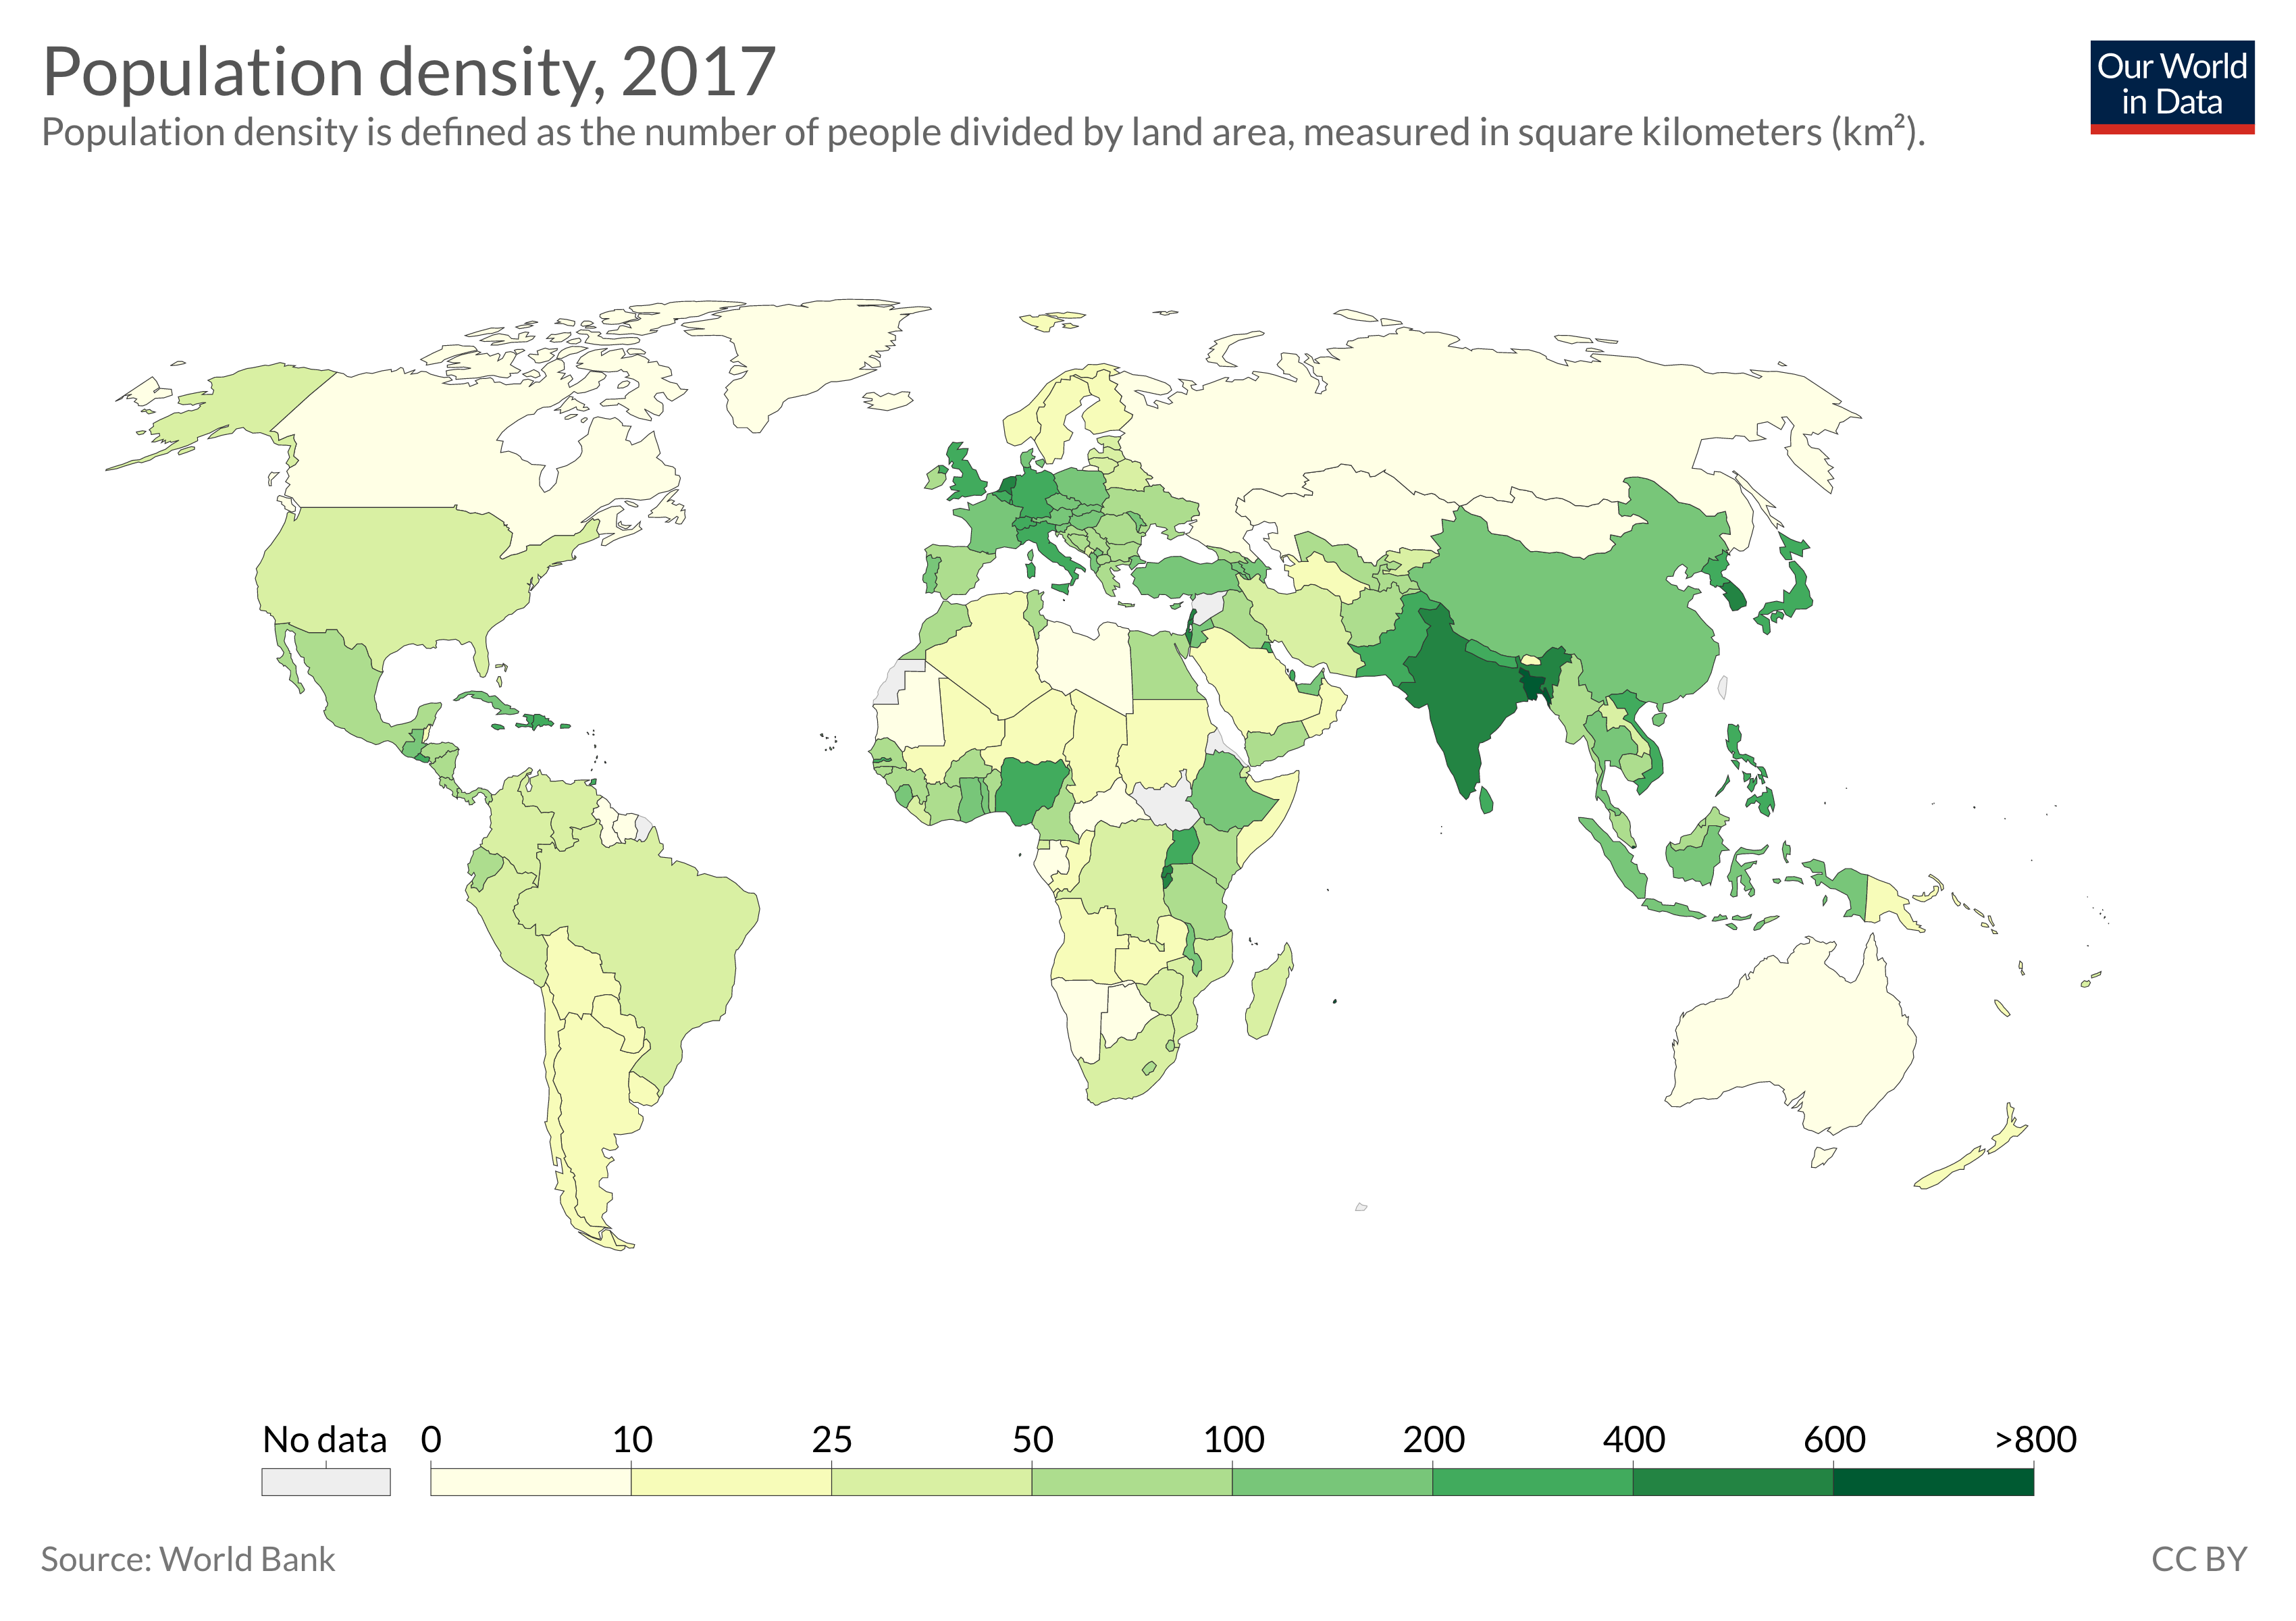
   

  • Visual representation of data on a map
  • Key tool for analyzing geographical data
  • Useful for identifying spatial patterns and trends

    A map visualization depicting the population density of countries around the world.

1 Our World in Data
Data Visualization in Databricks

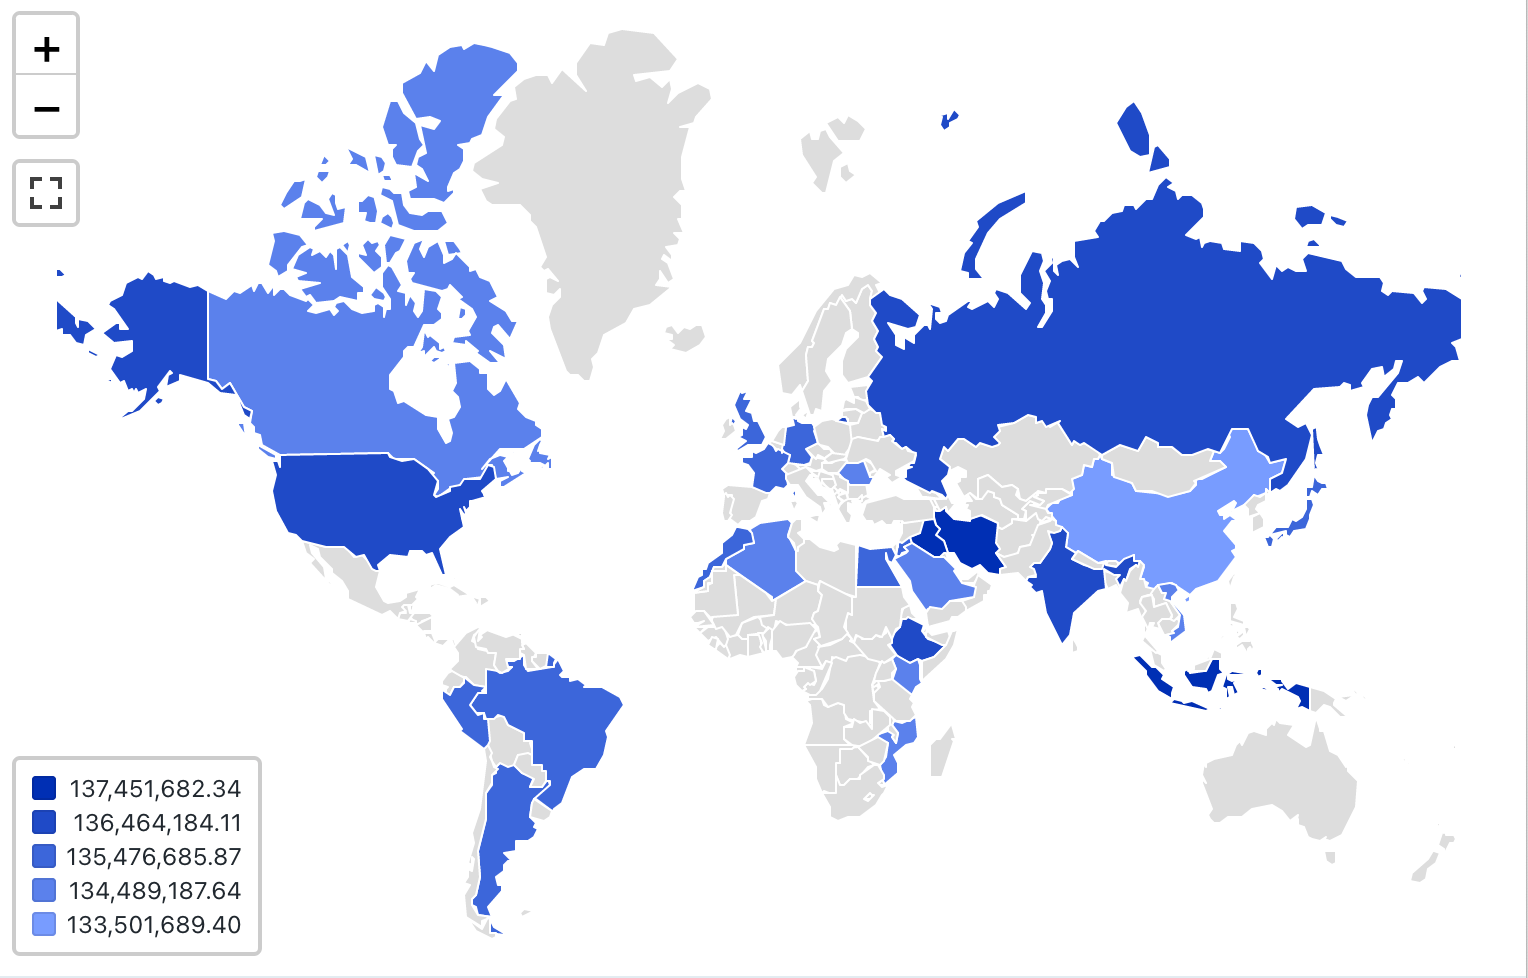
Examples - Choropleth Maps


Choropleth Maps

  • Uses color gradients to represent data density or values
  • Ideal for comparing data across regions
  • Highlights regional differences clearly


A Choropleth map displaying total sales revenue by country, with darker shades representing higher revenue values.

Data Visualization in Databricks

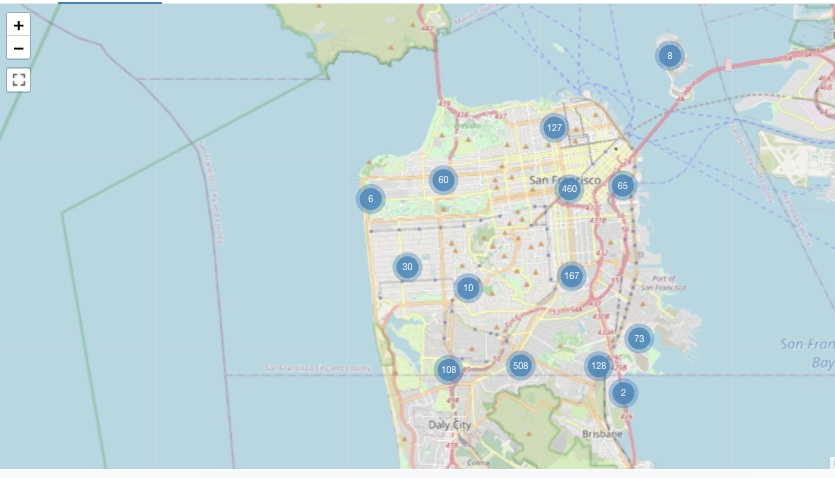
Examples - Marker Maps


Marker Maps

  • Represents individual data points with markers
  • Ideal for visualizing specific locations
  • Provides clear, location-based insights


A Marker map displaying crime incidents in San Francisco, with each circle indicating the total number of incidents in that area.

Data Visualization in Databricks

Understanding our dataset

Dataset: Online retail dataset from Databricks

Column Name Details
InvoiceNo Unique identifier for each invoice
StockCode Identifier for the stock item purchased
Quantity Number of units of the stock item purchased in the transaction
InvoiceDate Date and time when the transaction occurred
UnitPrice Price per unit of the stock item
CustomerID Unique identifier for the customer making the purchase
Country Geographical location where the purchase was made
Latitude/Longitude Latitude/Longitude coordinate of the transaction location
Data Visualization in Databricks

Let's practice!

Data Visualization in Databricks

Preparing Video For Download...