Dominant colors in images
Cluster Analysis in Python

Shaumik Daityari
Business Analyst
Dominant colors in images

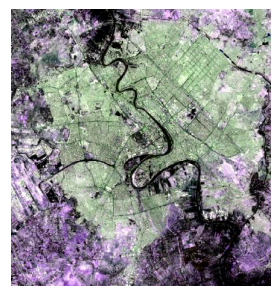
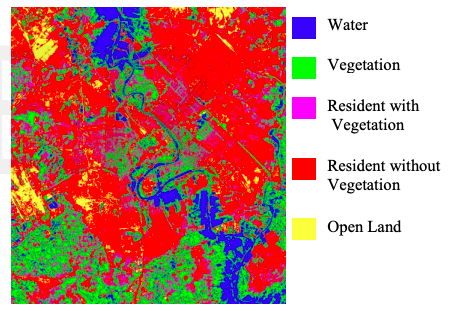
Feature identification in satellite images

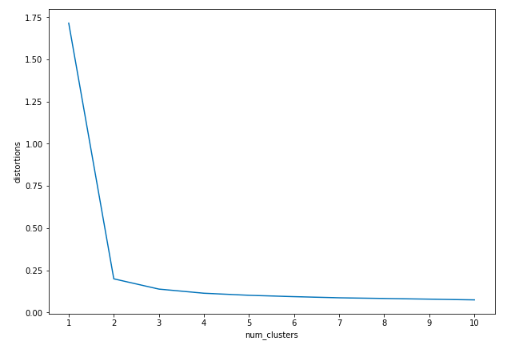
Elbow plot
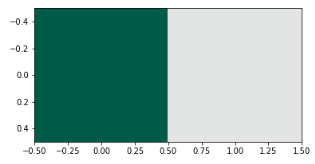
Display dominant colors
#Dimensions: 2 x 3 (N X 3 matrix)
print(colors)
[(0.08192923122023911, 0.34205845943857993, 0.2824002984155429),
 (0.893281510956742, 0.899818770315129, 0.8979114272960784)]
#Dimensions: 1 x 2 x 3 (1 X N x 3 matrix)
plt.imshow([colors])
plt.show()