Manipulating Time Series Data in Python
Stefan Jansen
Founder & Lead Data Scientist at Applied Artificial Intelligence
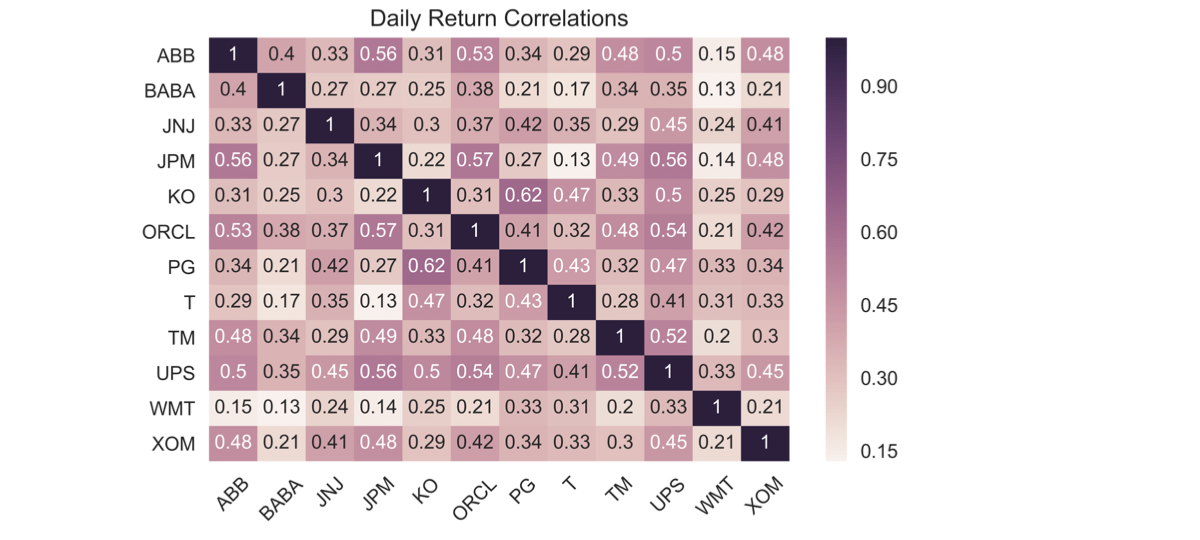
Daily return correlations:
Calculate among all components
Visualize the result as heatmap
Write results to excel using .xls and .xlsx formats:
Single worksheet
Multiple worksheets
data = DataReader(tickers, 'google', start='2016', end='2017')['Close']data.info()
DatetimeIndex: 252 entries, 2016-01-04 to 2016-12-30
Data columns (total 12 columns):
ABB     252 non-null float64
BABA    252 non-null float64
JNJ     252 non-null float64
JPM     252 non-null float64
KO      252 non-null float64
ORCL    252 non-null float64
PG      252 non-null float64
T       252 non-null float64
TM      252 non-null float64
UPS     252 non-null float64
WMT     252 non-null float64
XOM     252 non-null float64
  daily_returns = data.pct_change()correlations = daily_returns.corr()
ABB  BABA  JNJ  JPM   KO  ORCL   PG    T   TM  UPS  WMT  XOM
ABB  1.00  0.40 0.33 0.56 0.31  0.53 0.34 0.29 0.48 0.50 0.15 0.48
BABA 0.40  1.00 0.27 0.27 0.25  0.38 0.21 0.17 0.34 0.35 0.13 0.21
JNJ  0.33  0.27 1.00 0.34 0.30  0.37 0.42 0.35 0.29 0.45 0.24 0.41
JPM  0.56  0.27 0.34 1.00 0.22  0.57 0.27 0.13 0.49 0.56 0.14 0.48
KO   0.31  0.25 0.30 0.22 1.00  0.31 0.62 0.47 0.33 0.50 0.25 0.29
ORCL 0.53  0.38 0.37 0.57 0.31  1.00 0.41 0.32 0.48 0.54 0.21 0.42
PG   0.34  0.21 0.42 0.27 0.62  0.41 1.00 0.43 0.32 0.47 0.33 0.34
T    0.29  0.17 0.35 0.13 0.47  0.32 0.43 1.00 0.28 0.41 0.31 0.33
TM   0.48  0.34 0.29 0.49 0.33  0.48 0.32 0.28 1.00 0.52 0.20 0.30
UPS  0.50  0.35 0.45 0.56 0.50  0.54 0.47 0.41 0.52 1.00 0.33 0.45
WMT  0.15  0.13 0.24 0.14 0.25  0.21 0.33 0.31 0.20 0.33 1.00 0.21
XOM  0.48  0.21 0.41 0.48 0.29  0.42 0.34 0.33 0.30 0.45 0.21 1.00
  sns.heatmap(correlations, annot=True)
plt.xticks(rotation=45)
plt.title('Daily Return Correlations')
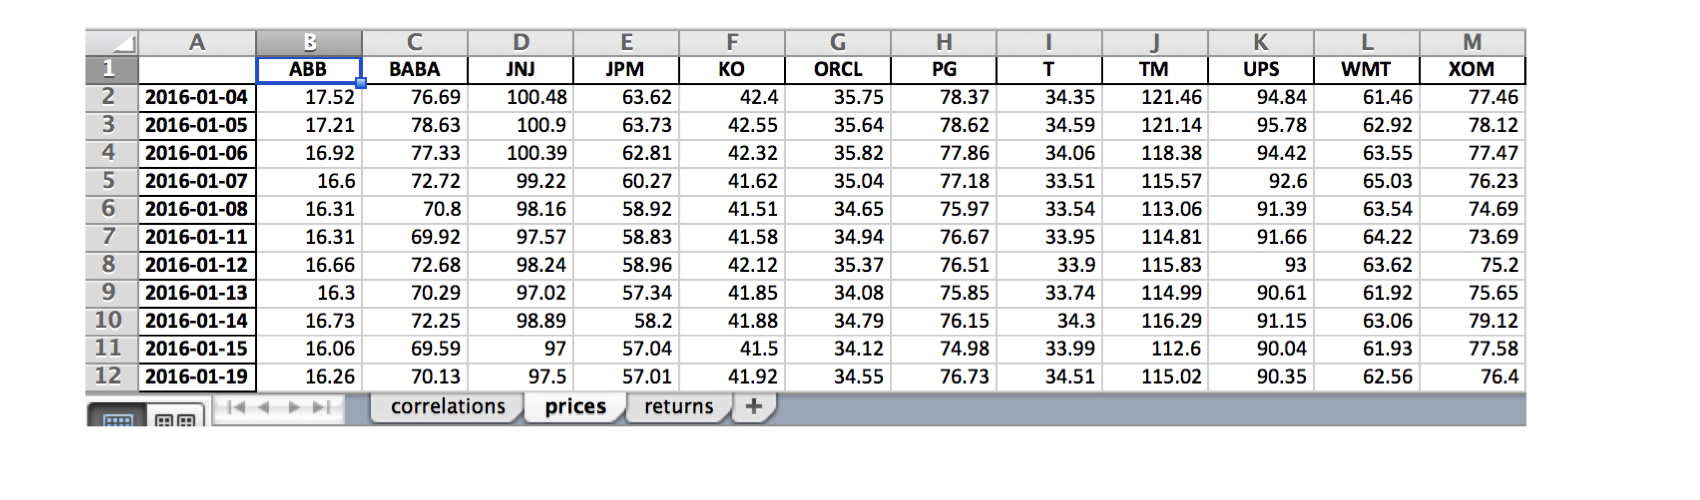
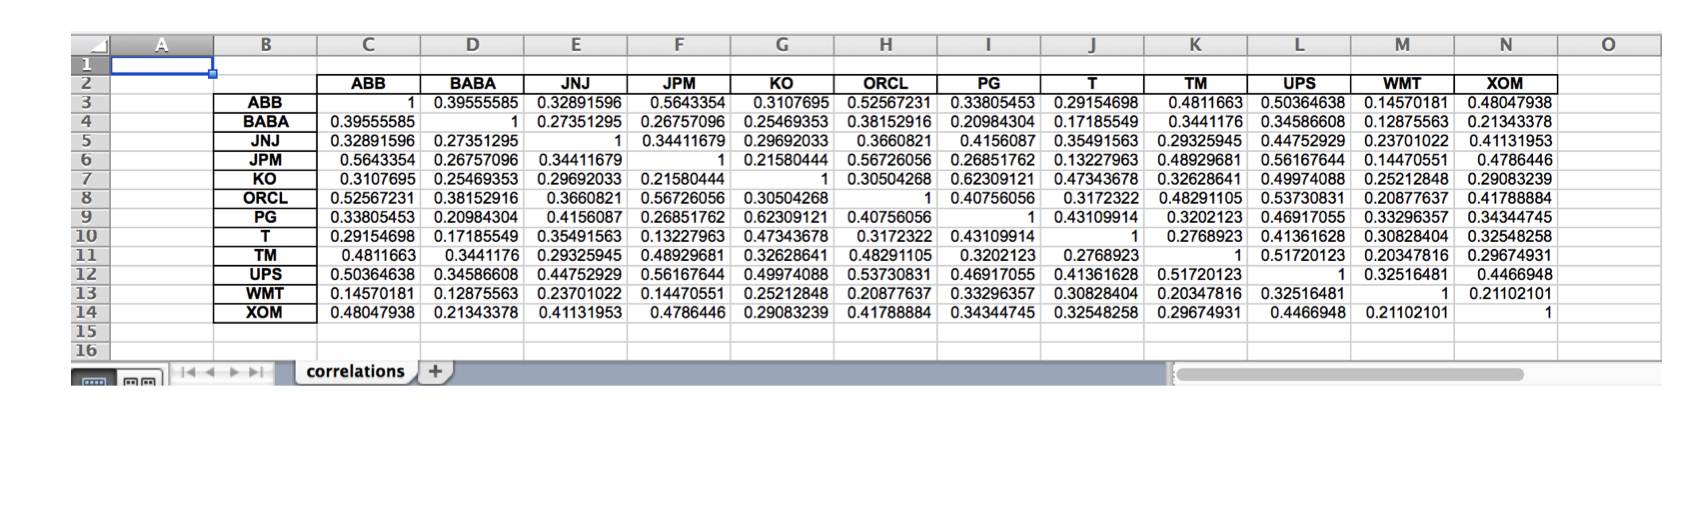
correlations.to_excel(excel_writer= 'correlations.xls',
                      sheet_name='correlations',
                      startrow=1,
                      startcol=1)

data.index = data.index.date # Keep only date componentwith pd.ExcelWriter('stock_data.xlsx') as writer:corr.to_excel(excel_writer=writer, sheet_name='correlations')data.to_excel(excel_writer=writer, sheet_name='prices')data.pct_change().to_excel(writer, sheet_name='returns')

Manipulating Time Series Data in Python