Manipulating Time Series Data in Python
Stefan Jansen
Founder & Lead Data Scientist at Applied Artificial Intelligence
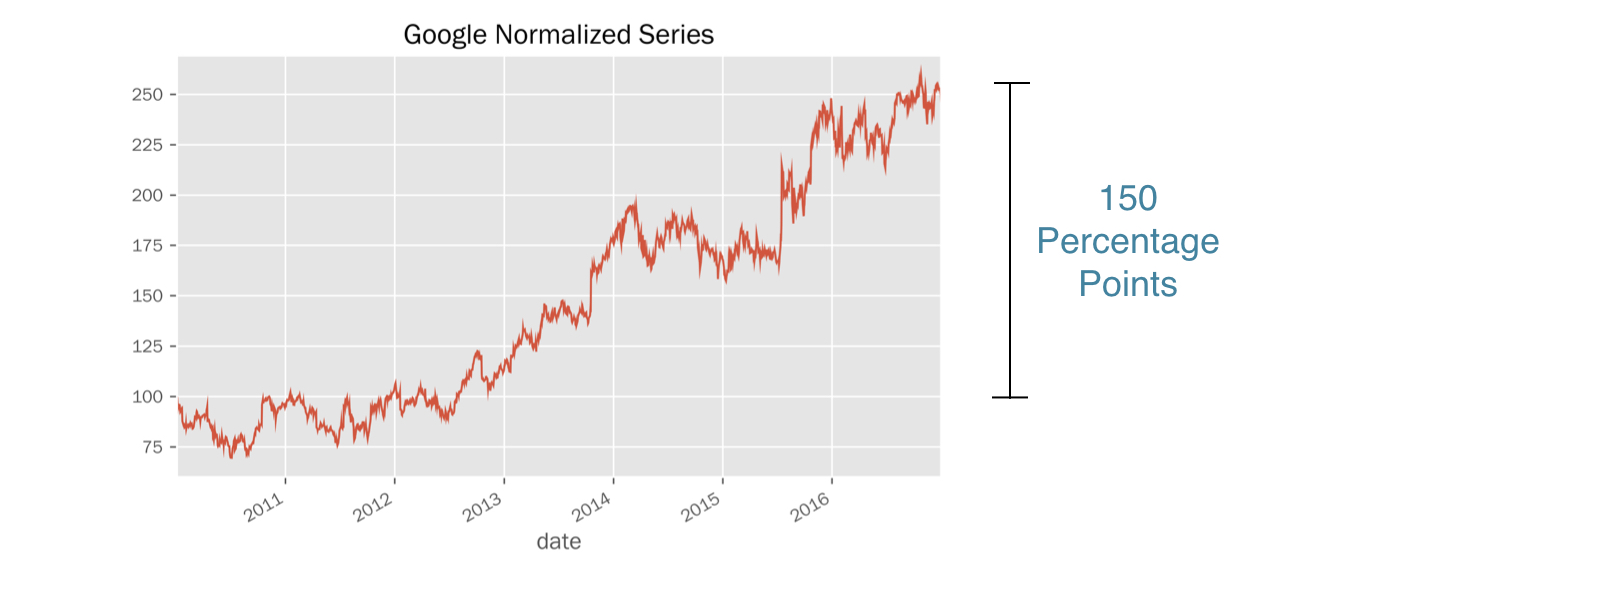
Stock price series: hard to compare at different levels
Simple solution: normalize price series to start at 100
Divide all prices by first in series, multiply by 100
Same starting point
All prices relative to starting point
Difference to starting point in percentage points
google = pd.read_csv('google.csv', parse_dates=['date'], index_col='date')google.head(3)
             price
date
2010-01-04  313.06
2010-01-05  311.68
2010-01-06  303.83
first_price = google.price.iloc[0] # int-based selectionfirst_price
313.06
first_price == google.loc['2010-01-04', 'price']
True
  normalized = google.price.div(first_price).mul(100)normalized.plot(title='Google Normalized Series')
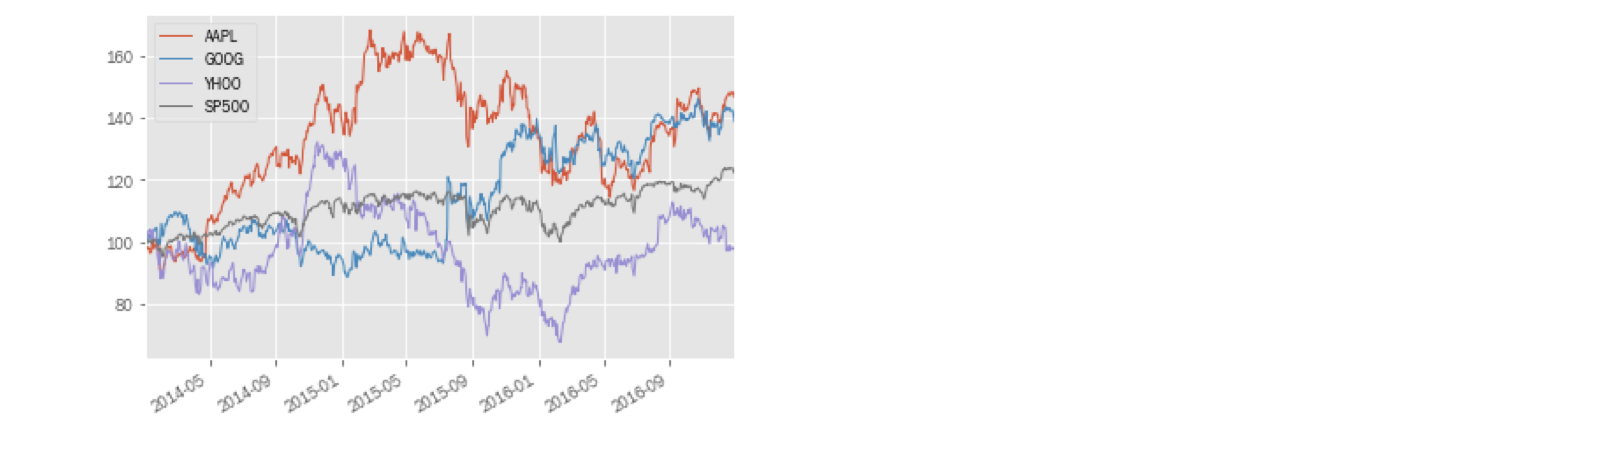
prices = pd.read_csv('stock_prices.csv', parse_dates=['date'], index_col='date')prices.info()
DatetimeIndex: 1761 entries, 2010-01-04 to 2016-12-30
Data columns (total 3 columns):
AAPL    1761 non-null float64
GOOG    1761 non-null float64
YHOO    1761 non-null float64
dtypes: float64(3)
prices.head(2)
             AAPL    GOOG   YHOO
Date
2010-01-04  30.57  313.06  17.10
2010-01-05  30.63  311.68  17.23
  prices.iloc[0]
AAPL     30.57
GOOG    313.06
YHOO     17.10
Name: 2010-01-04 00:00:00, dtype: float64
normalized = prices.div(prices.iloc[0])normalized.head(3)
                AAPL      GOOG      YHOO
Date
2010-01-04  1.000000  1.000000  1.000000
2010-01-05  1.001963  0.995592  1.007602
2010-01-06  0.985934  0.970517  1.004094
.div(): automatic alignment of Series index & DataFrame columnsindex = pd.read_csv('benchmark.csv', parse_dates=['date'], index_col='date')index.info()
DatetimeIndex: 1826 entries, 2010-01-01 to 2016-12-30
Data columns (total 1 columns):
SP500    1762 non-null float64
dtypes: float64(1)
prices = pd.concat([prices, index], axis=1).dropna()prices.info()
DatetimeIndex: 1761 entries, 2010-01-04 to 2016-12-30
Data columns (total 4 columns):
AAPL     1761 non-null float64
GOOG     1761 non-null float64
YHOO     1761 non-null float64
SP500    1761 non-null float64
dtypes: float64(4)
  prices.head(1)
             AAPL    GOOG   YHOO    SP500
2010-01-04  30.57  313.06  17.10  1132.99
normalized = prices.div(prices.iloc[0]).mul(100)normalized.plot()
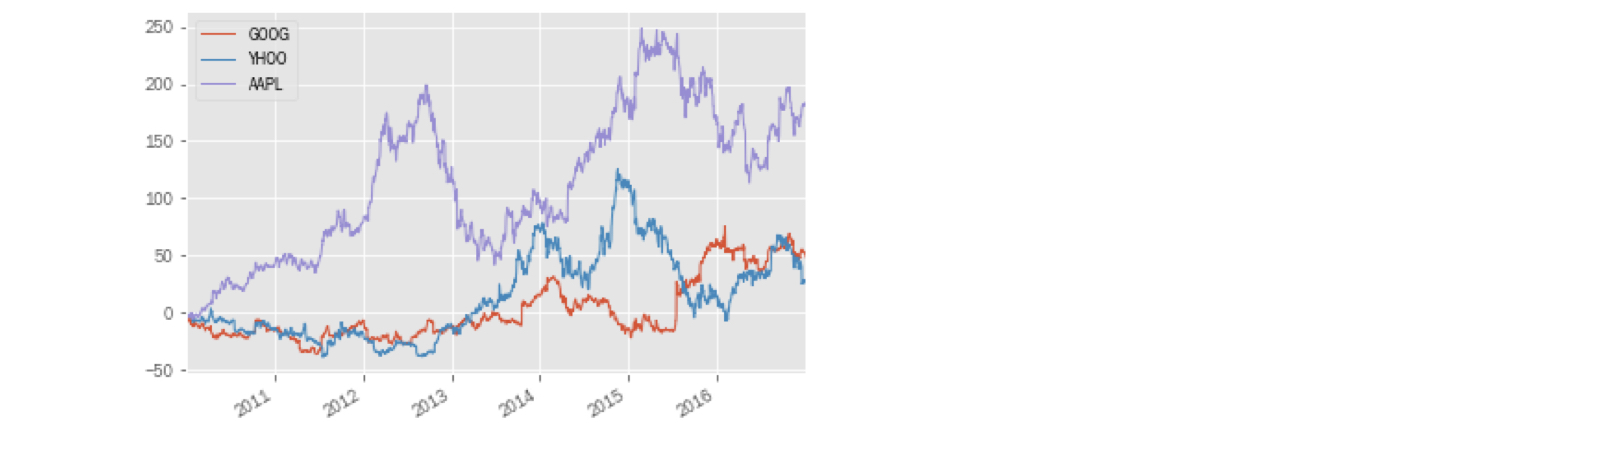
diff = normalized[tickers].sub(normalized['SP500'], axis=0)
                GOOG      YHOO      AAPL
2010-01-04  0.000000  0.000000  0.000000
2010-01-05 -0.752375  0.448669 -0.115294
2010-01-06 -3.314604  0.043069 -1.772895
.sub(..., axis=0): Subtract a Series from each DataFrame column by aligning indexesdiff.plot()

Manipulating Time Series Data in Python