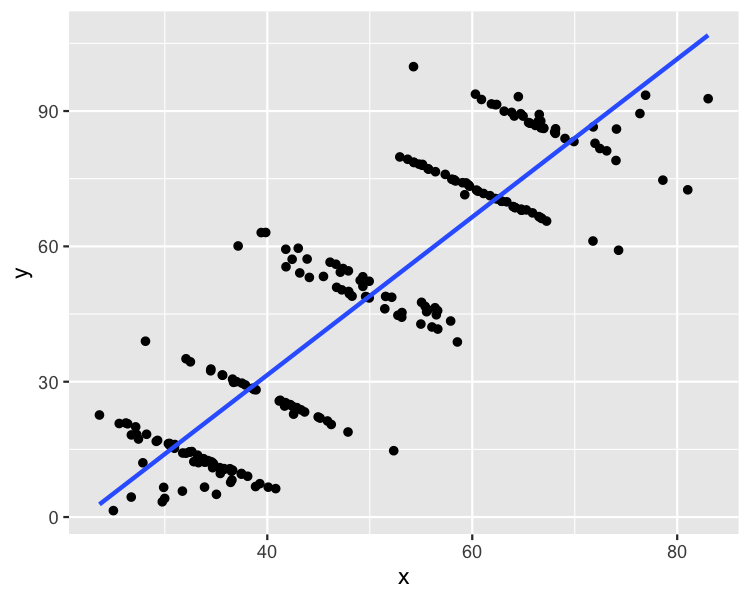
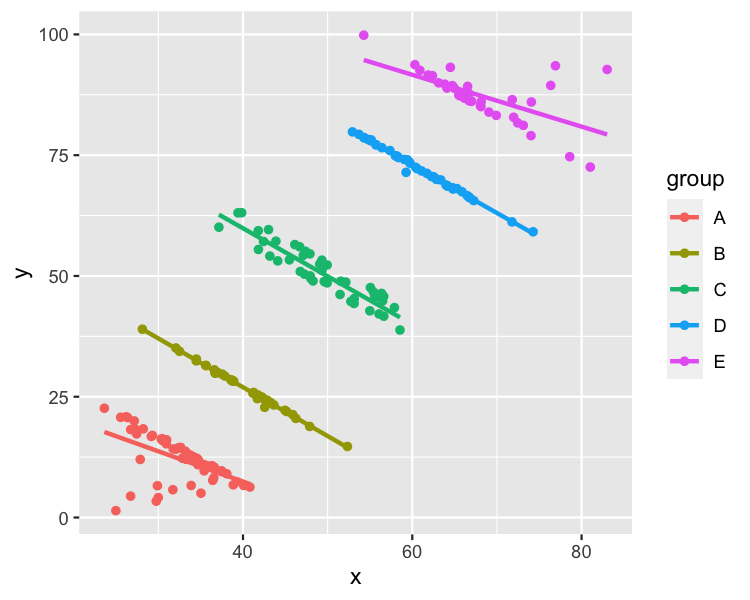
Simpson's Paradox
Intermediate Regression in R

Richie Cotton
Data Evangelist at DataCamp
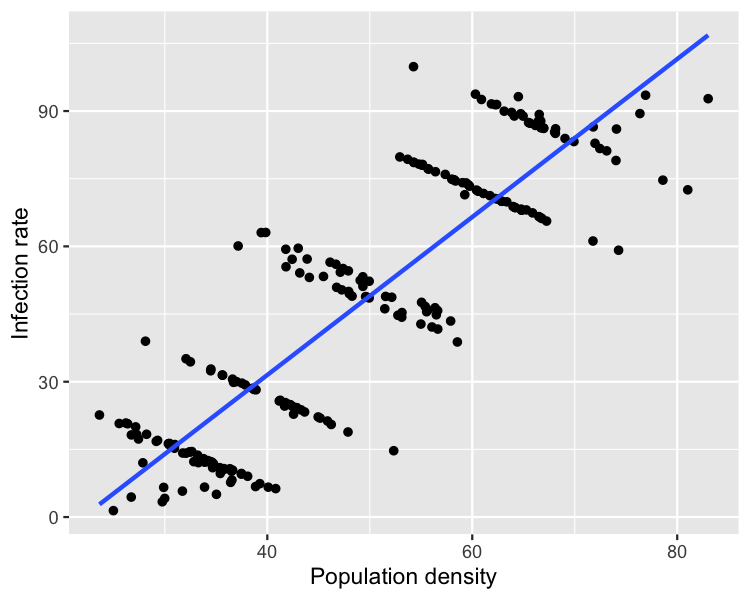
Plotting the whole dataset
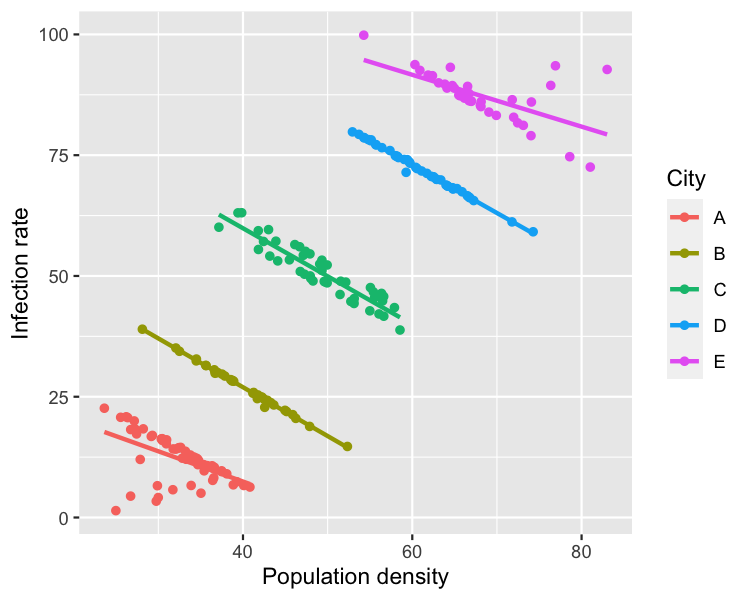
Plotting by group
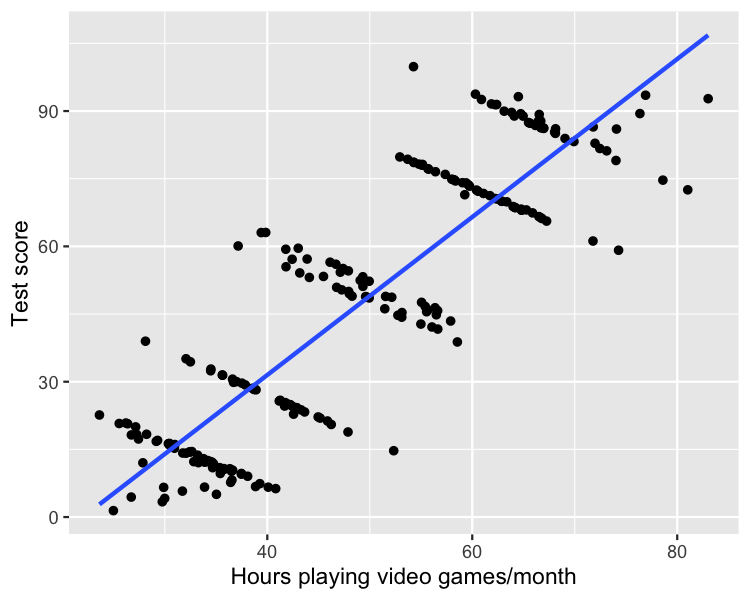
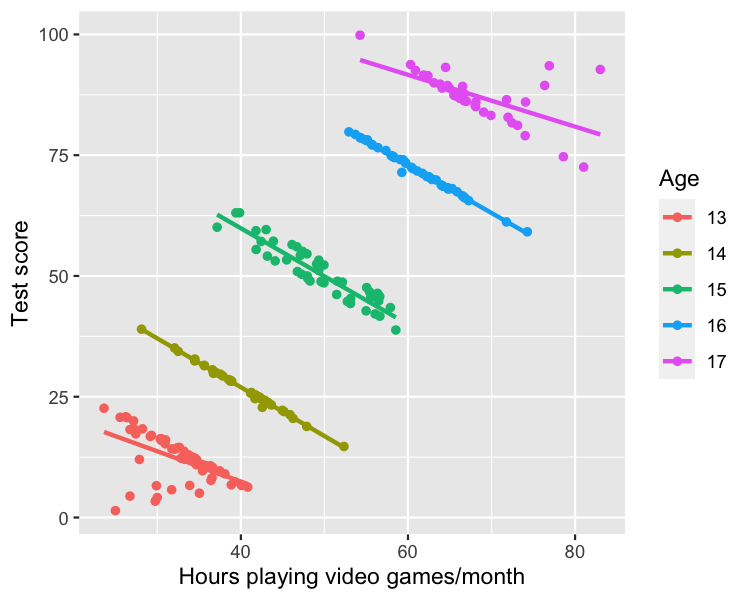
Test score example
Infectious disease example
1 https://stats.stackexchange.com/questions/478463/examples-of-simpsons-paradox-being-resolved-by-choosing-the-aggregate-data

