Predicting parallel slopes
Intermediate Regression in R

Richie Cotton
Data Evangelist
The prediction workflow 1
library(dplyr)

explanatory_data <- tibble(
  length_cm = seq(5, 60, 5)
)
glimpse(explanatory_data)
Rows: 12
Columns: 1
$ length_cm <dbl> 5, 10, 15, 20, 25, 30, 35, 40...
library(dplyr)
library(tidyr)
explanatory_data <- expand_grid(
  length_cm = seq(5, 60, 5),
  species = unique(fish$species)
)
glimpse(explanatory_data)
Rows: 48
Columns: 2
$ length_cm <dbl> 5, 5, 5, 5, 10, 10, 10, 10, 1...
$ species   <chr> "Bream", "Roach", "Perch", "P...
The prediction workflow 2
library(dplyr)

explanatory_data <- tibble(
  length_cm = seq(5, 60, 5)
)
prediction_data <- explanatory_data %>%
  mutate(
    mass_g = predict(
      mdl_mass_vs_length, explanatory_data
    )
  )
library(dplyr)
library(tidyr)
explanatory_data <- expand_grid(
  length_cm = seq(5, 60, 5),
  species = unique(fish$species)
)
prediction_data <- explanatory_data %>%
  mutate(
    mass_g = predict(
      mdl_mass_vs_both, explanatory_data
    )
  )
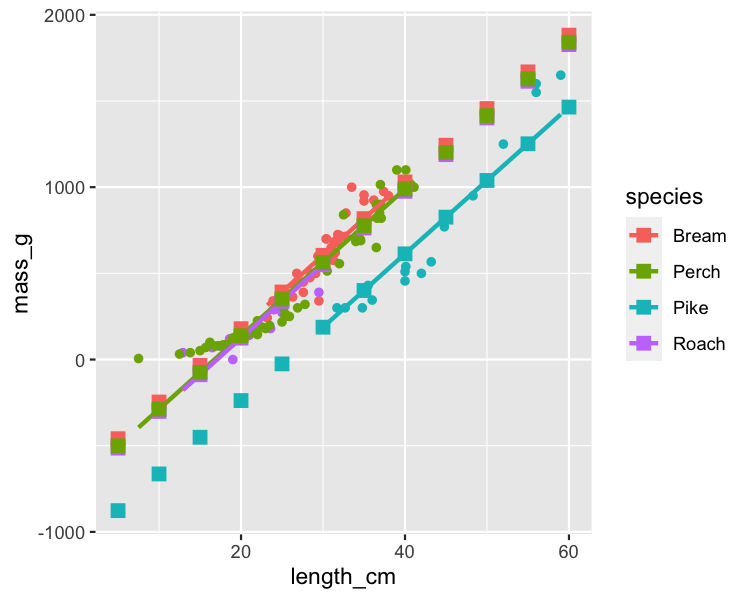
Visualizing the predictions
library(ggplot2)
library(moderndive)
ggplot(fish, aes(length_cm, mass_g, color = species)) +
  geom_point() +
  geom_parallel_slopes(se = FALSE) +
  geom_point(
    data = prediction_data,
    size = 3, shape = 15
  )
Manually calculating predictions
coeffs <- coefficients(mdl_price_vs_length)
(Intercept)   length_cm
     -536.2        34.9
intercept <- coeffs[1]
slope <- coeffs[2]
explanatory_data %>%
  mutate(
    mass_g = intercept + slope * length_cm
  )
| length_cm | mass_g |
|---|---|
| 5 | -361.73 |
| 10 | -187.23 |
| 15 | -12.74 |
| 20 | 161.76 |
| 25 | 336.26 |
| 30 | 510.75 |
Coefficients for parallel slopes
coefficients(mdl_mass_vs_both)
length_cm speciesBream speciesPerch  speciesPike speciesRoach
    42.57      -672.24      -713.29     -1089.46      -726.78
slope <- coeffs[1]
intercept_bream <- coeffs[2]
intercept_perch <- coeffs[3]
intercept_pike <- coeffs[4]
intercept_roach <- coeffs[5]
Choosing an intercept with ifelse()
explanatory_data %>%
  mutate(
    intercept = ifelse(
      species == "Bream",
      intercept_bream,
      ifelse(
        species == "Perch",
        intercept_perch,
        ifelse(
          species == "Pike",
          intercept_pike,
          intercept_roach
        )
      )
    )
  )
case_when()
dataframe %>%
  mutate(
    case_when(
      condition_1 ~ value_1,
      condition_2 ~ value_2,
      # ...
      condition_n ~ value_n
    )
  )
Choosing an intercept with case_when()
explanatory_data %>%
  mutate(
    intercept = case_when(
      species == "Bream" ~ intercept_bream,
      species == "Perch" ~ intercept_perch,
      species == "Pike" ~ intercept_pike,
      species == "Roach" ~ intercept_roach
    )
  )
The final prediction step
explanatory_data %>%
  mutate(
    intercept = case_when(
      species == "Bream" ~ intercept_bream,
      species == "Perch" ~ intercept_perch,
      species == "Pike" ~ intercept_pike,
      species == "Roach" ~ intercept_roach
    ),
    mass_g = intercept + slope * length_cm
  )
# A tibble: 48 x 4
   length_cm species intercept mass_g
       <dbl> <chr>       <dbl>  <dbl>
 1         5 Bream       -672. -459.
 2         5 Roach       -727. -514.
 3         5 Perch       -713. -500.
 4         5 Pike       -1089. -877.
 5        10 Bream       -672. -247.
 6        10 Roach       -727. -301.
 7        10 Perch       -713. -288.
 8        10 Pike       -1089. -664.
 9        15 Bream       -672.  -33.7
10        15 Roach       -727.  -88.2
# ... with 38 more rows
Compare to predict()
predict(mdl_mass_vs_both, explanatory_data)
         1          2          3          4
-459.39910 -513.93503 -500.45009 -876.61328
         5          6          7          8
-246.55633 -301.09226 -287.60732 -663.77051
# ...
# A tibble: 48 x 4
   length_cm species intercept mass_g
       <dbl> <chr>       <dbl>  <dbl>
 1         5 Bream       -672. -459.
 2         5 Roach       -727. -514.
 3         5 Perch       -713. -500.
 4         5 Pike       -1089. -877.
 5        10 Bream       -672. -247.
 6        10 Roach       -727. -301.
 7        10 Perch       -713. -288.
 8        10 Pike       -1089. -664.
 9        15 Bream       -672.  -33.7
10        15 Roach       -727.  -88.2
# ... with 38 more rows
Let's practice!
Intermediate Regression in R

