Rótulos e ordem nas facetas
Visualização de Dados Intermediária com ggplot2

Rick Scavetta
Founder, Scavetta Academy
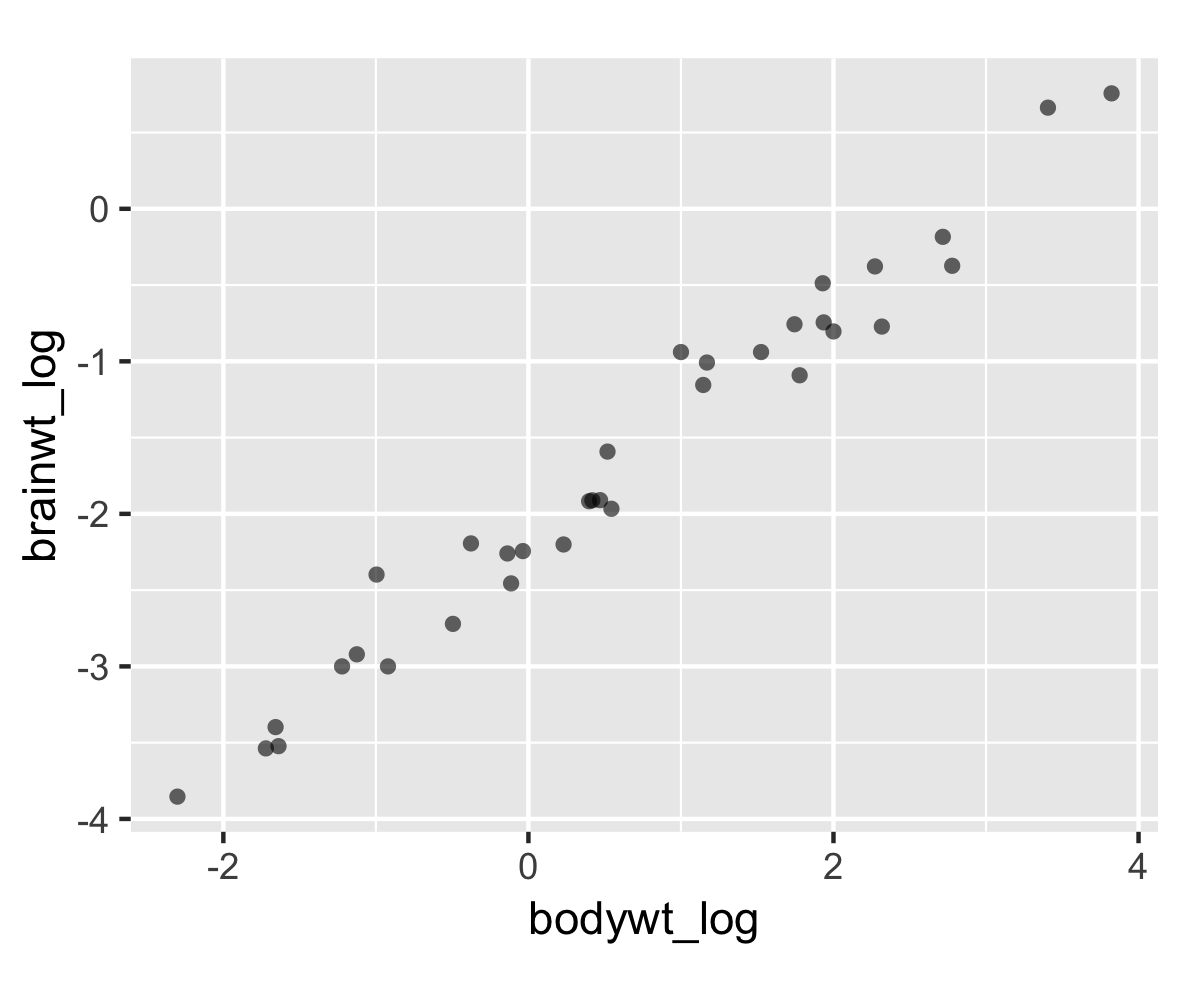
Um novo dataframe
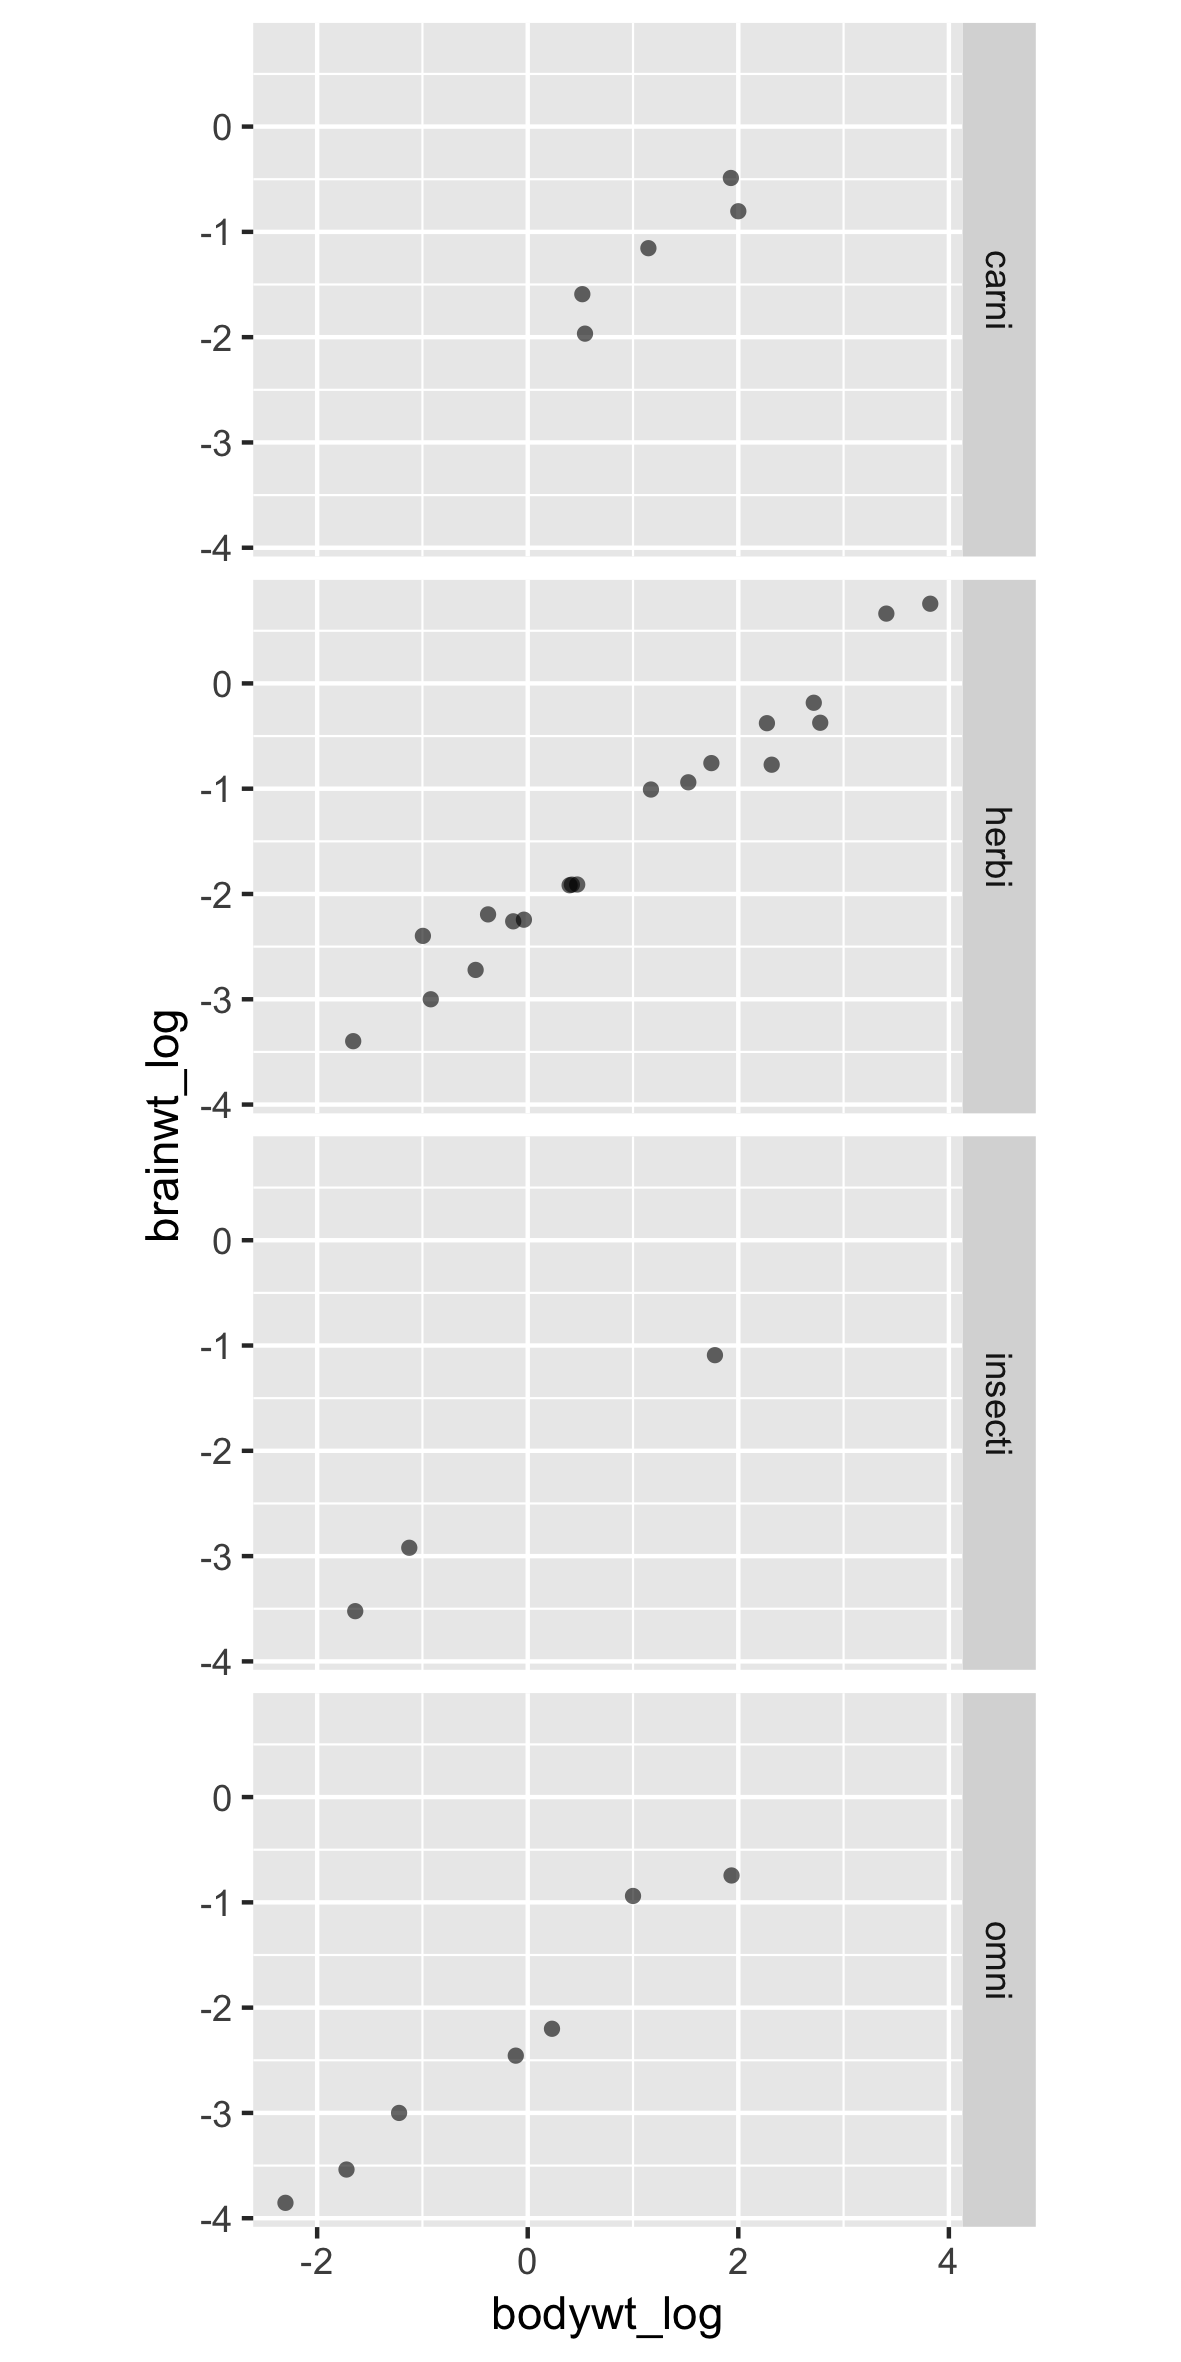
Um novo dataframe, com facetas

Um novo dataframe, com facetas
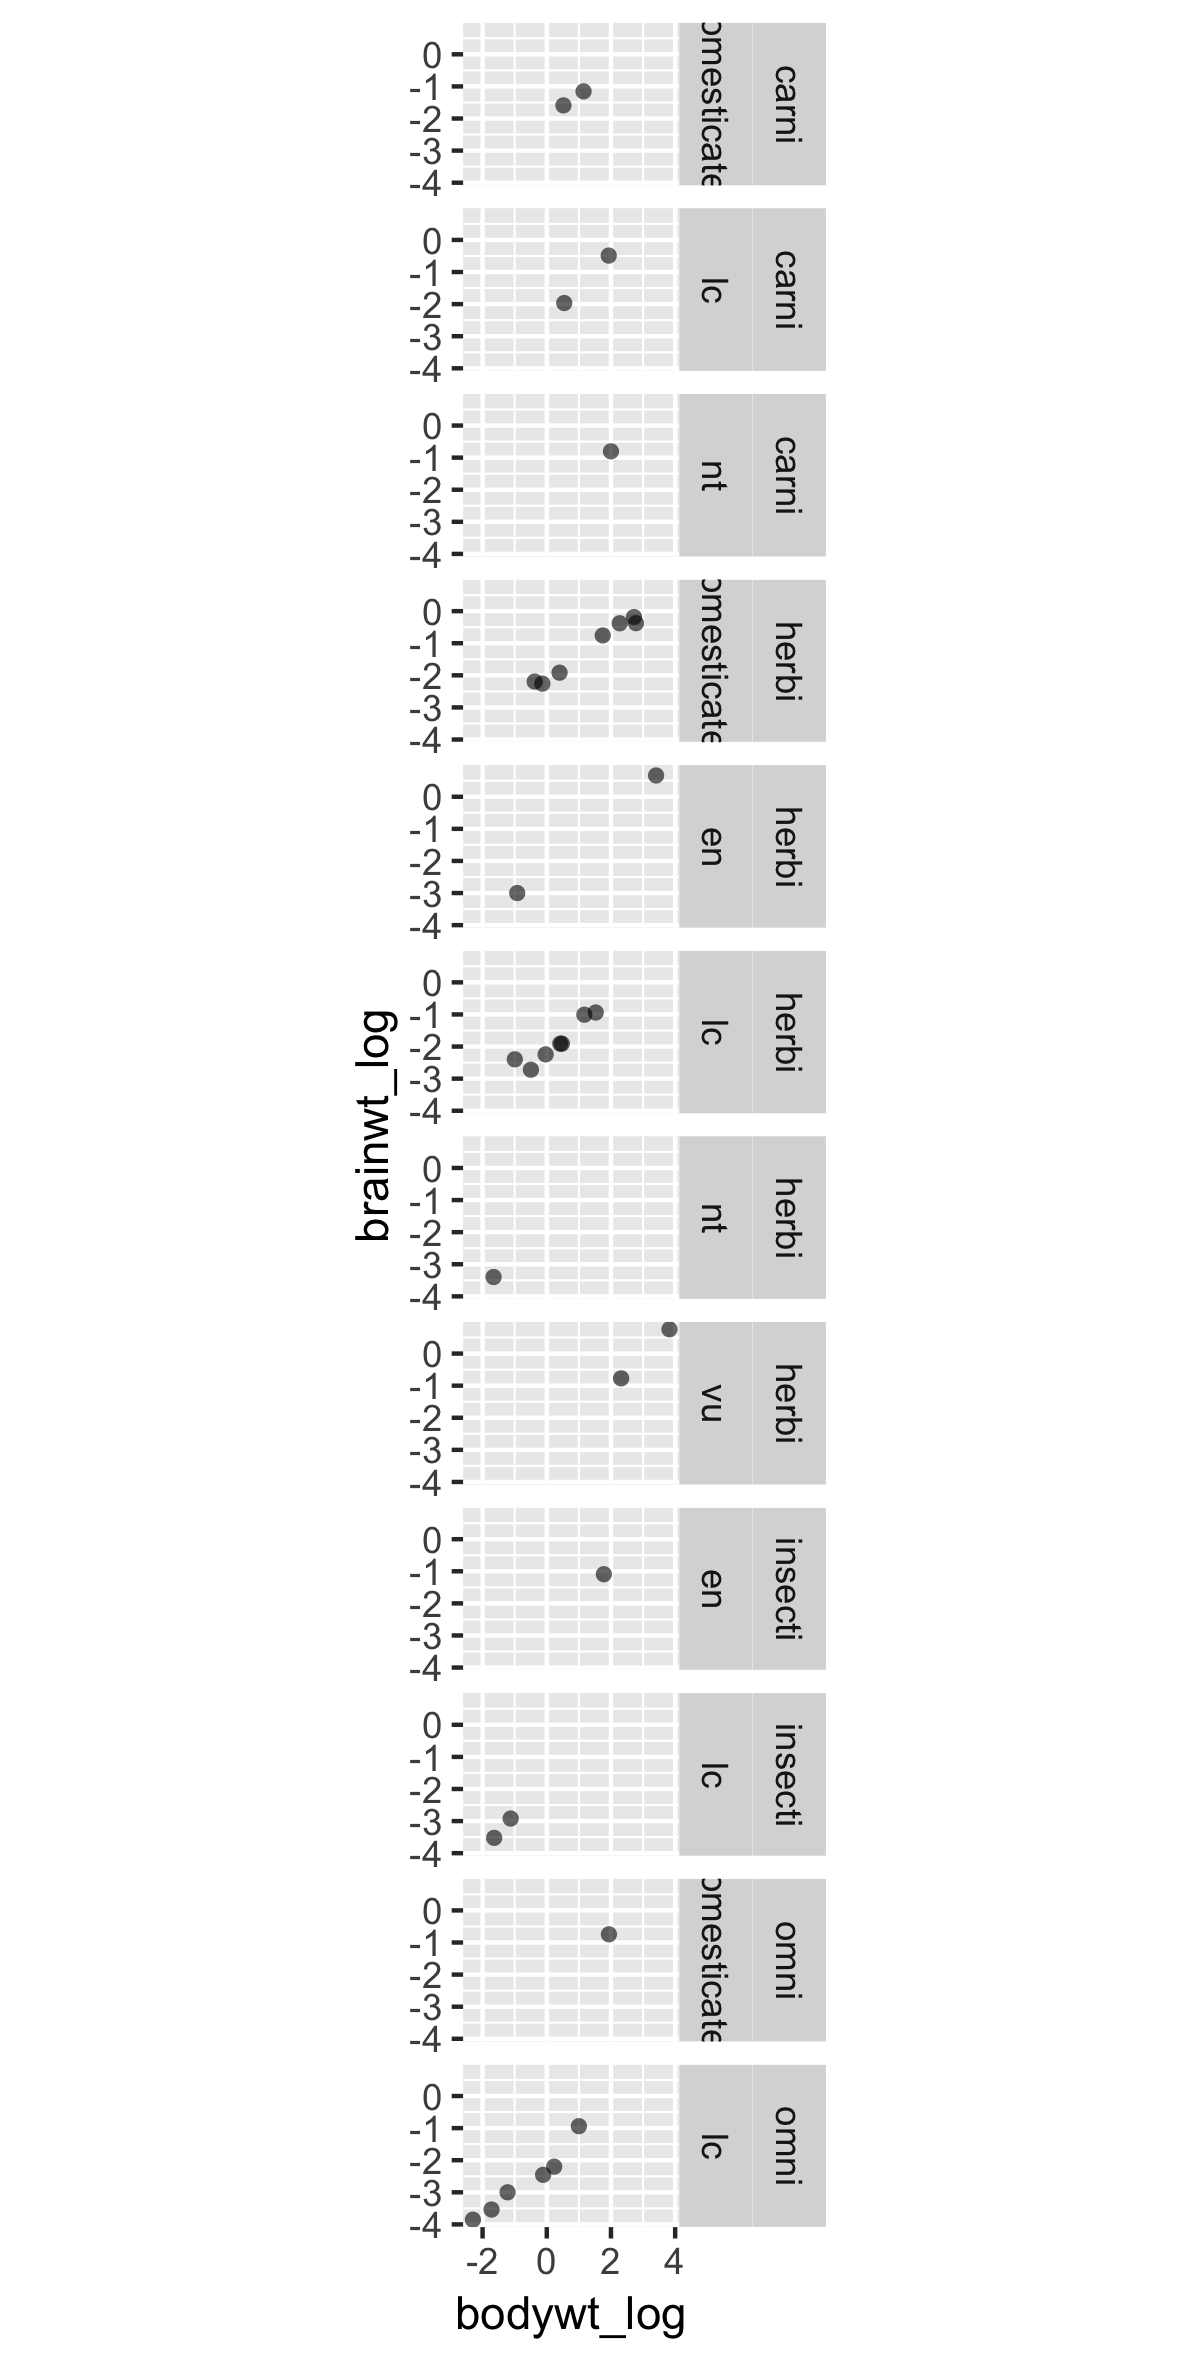
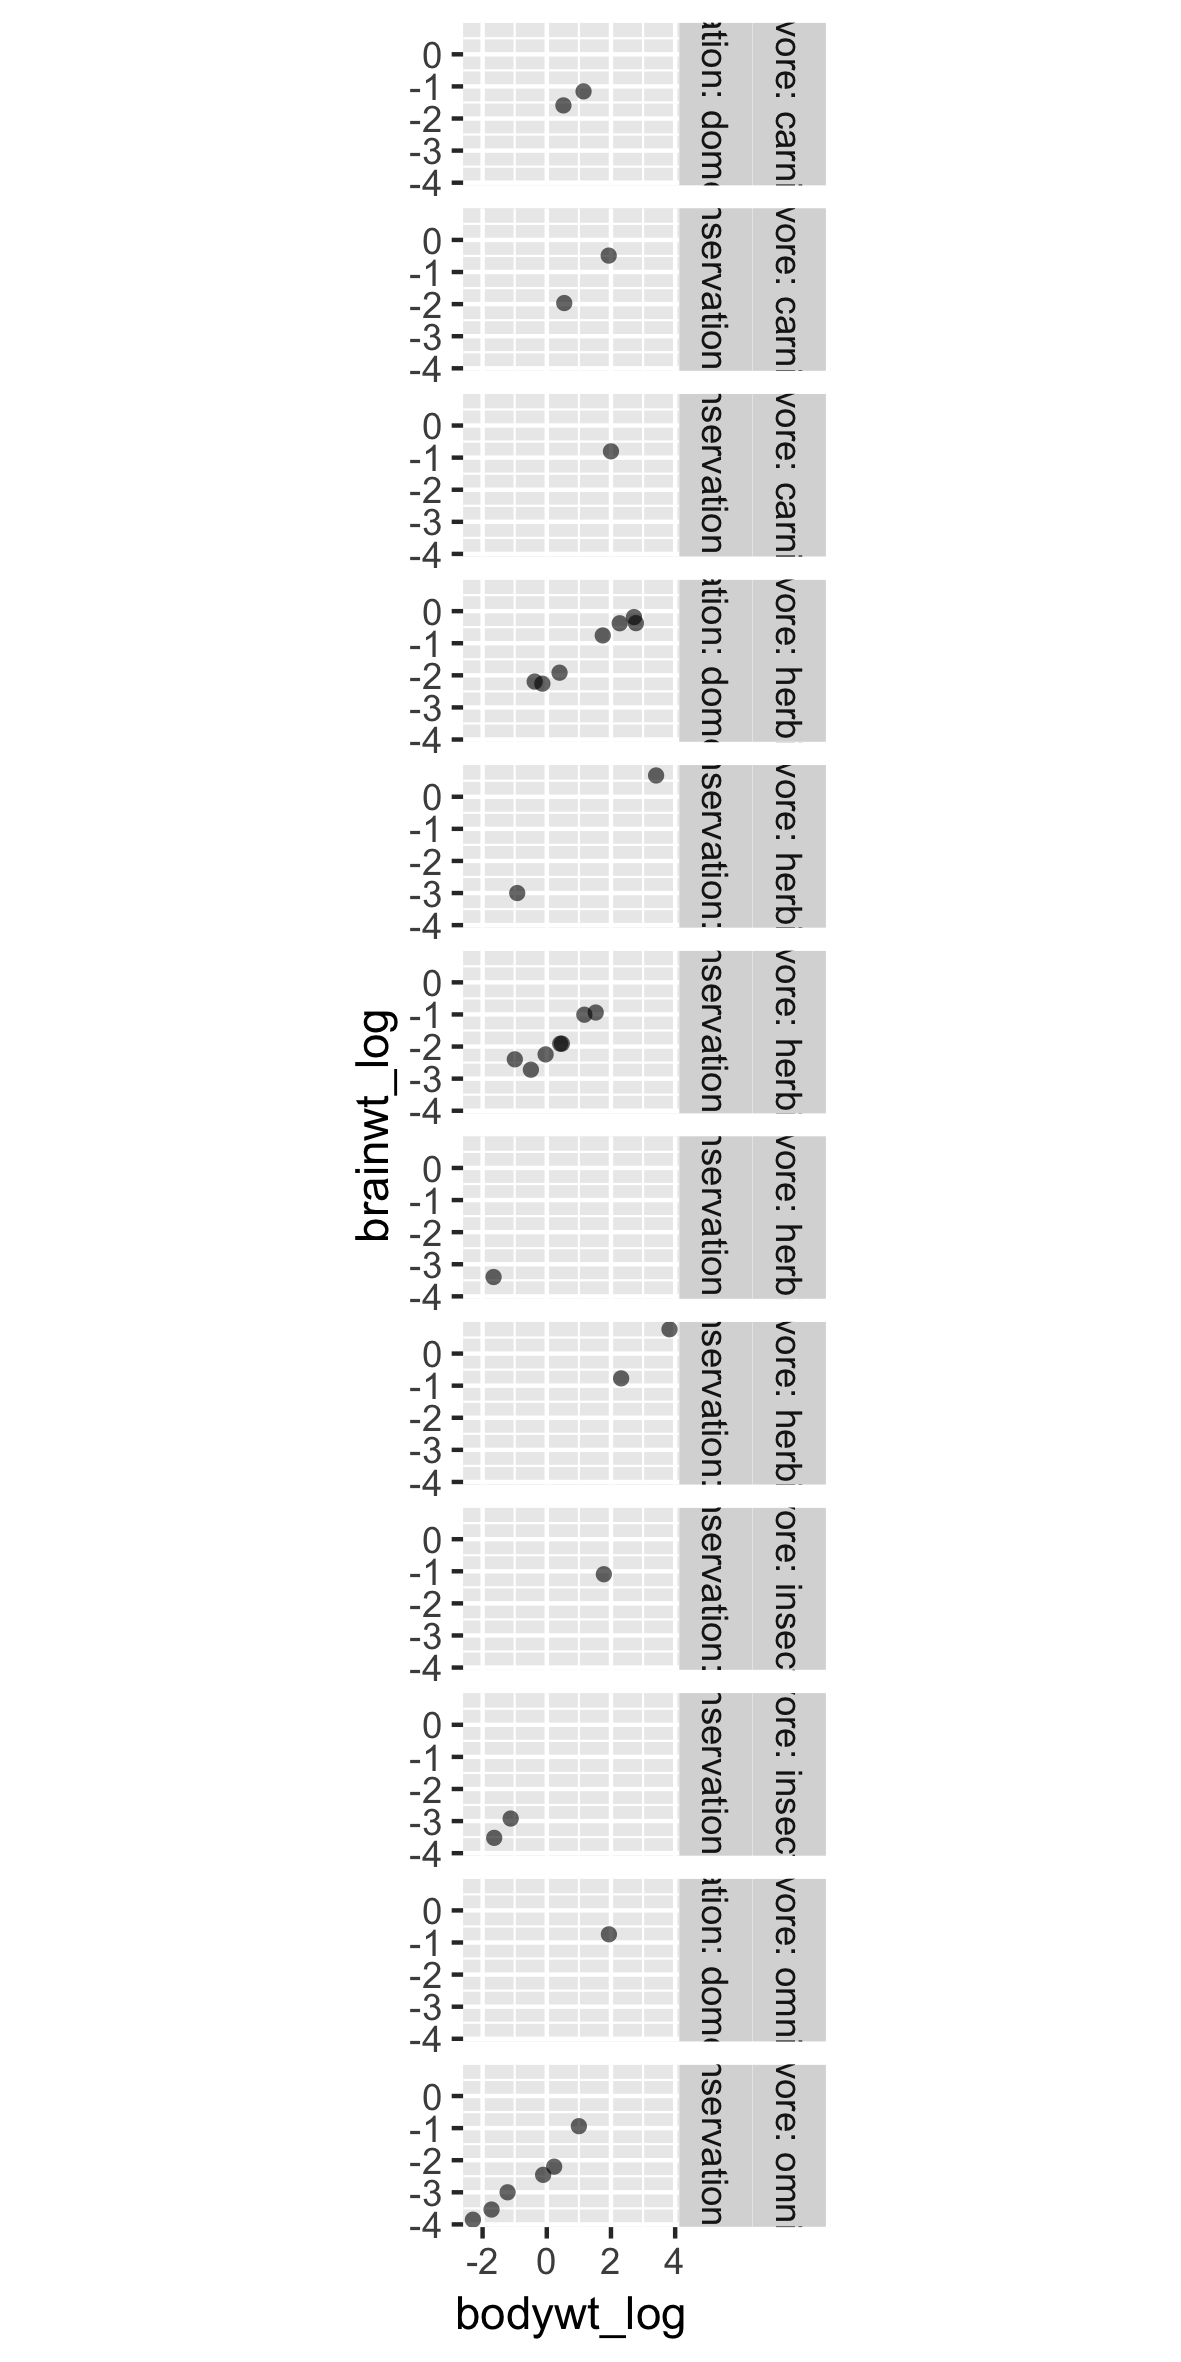
Rótulos e ordem ruins
Rótulos e ordem ruins
O argumento labeller
Usar label_both adiciona o nome da variável

Duas variáveis de um lado
label_context evita ambiguidade
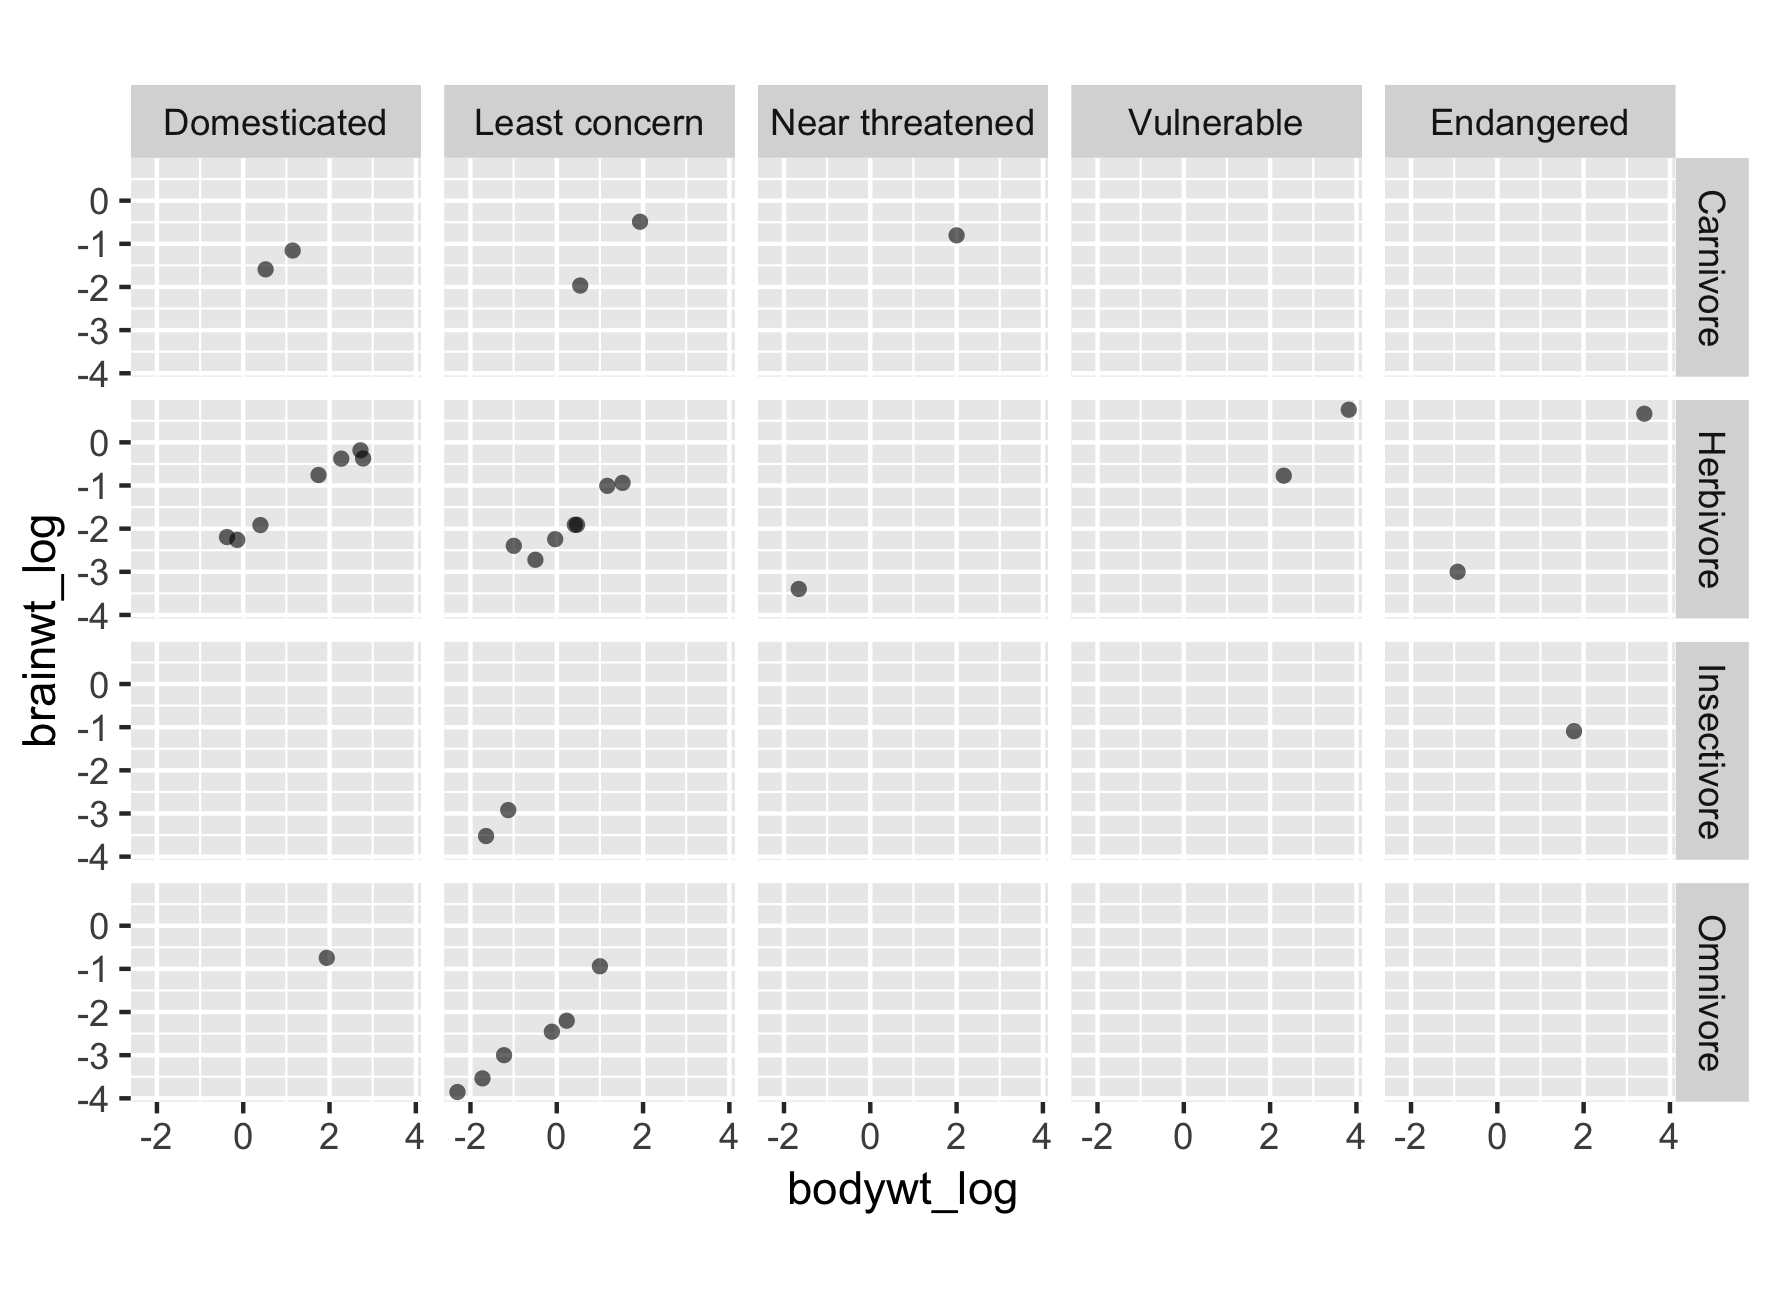
Use linhas e colunas quando fizer sentido
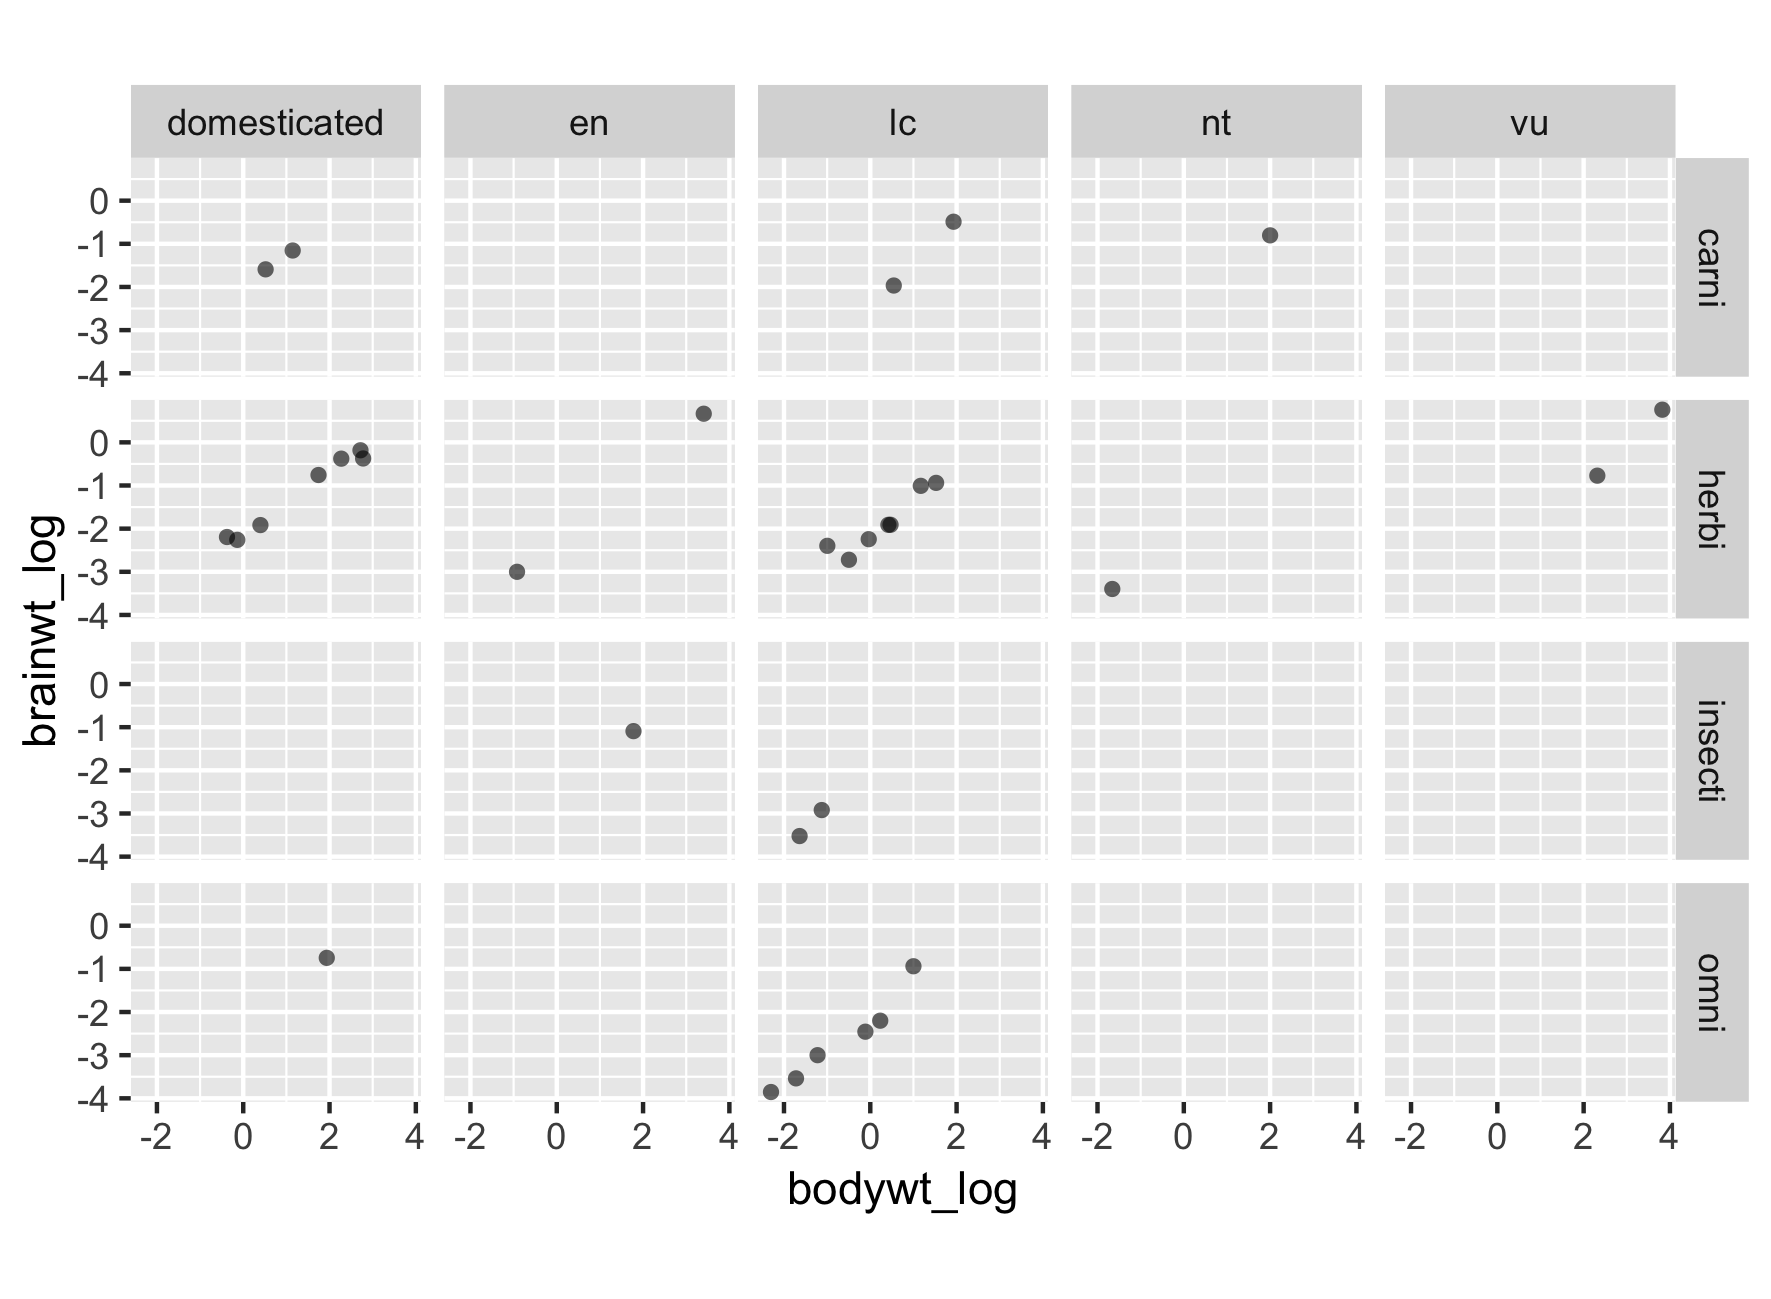
Use linhas e colunas quando fizer sentido
Use linhas e colunas quando fizer sentido
Reinicializar gráfico com novos rótulos
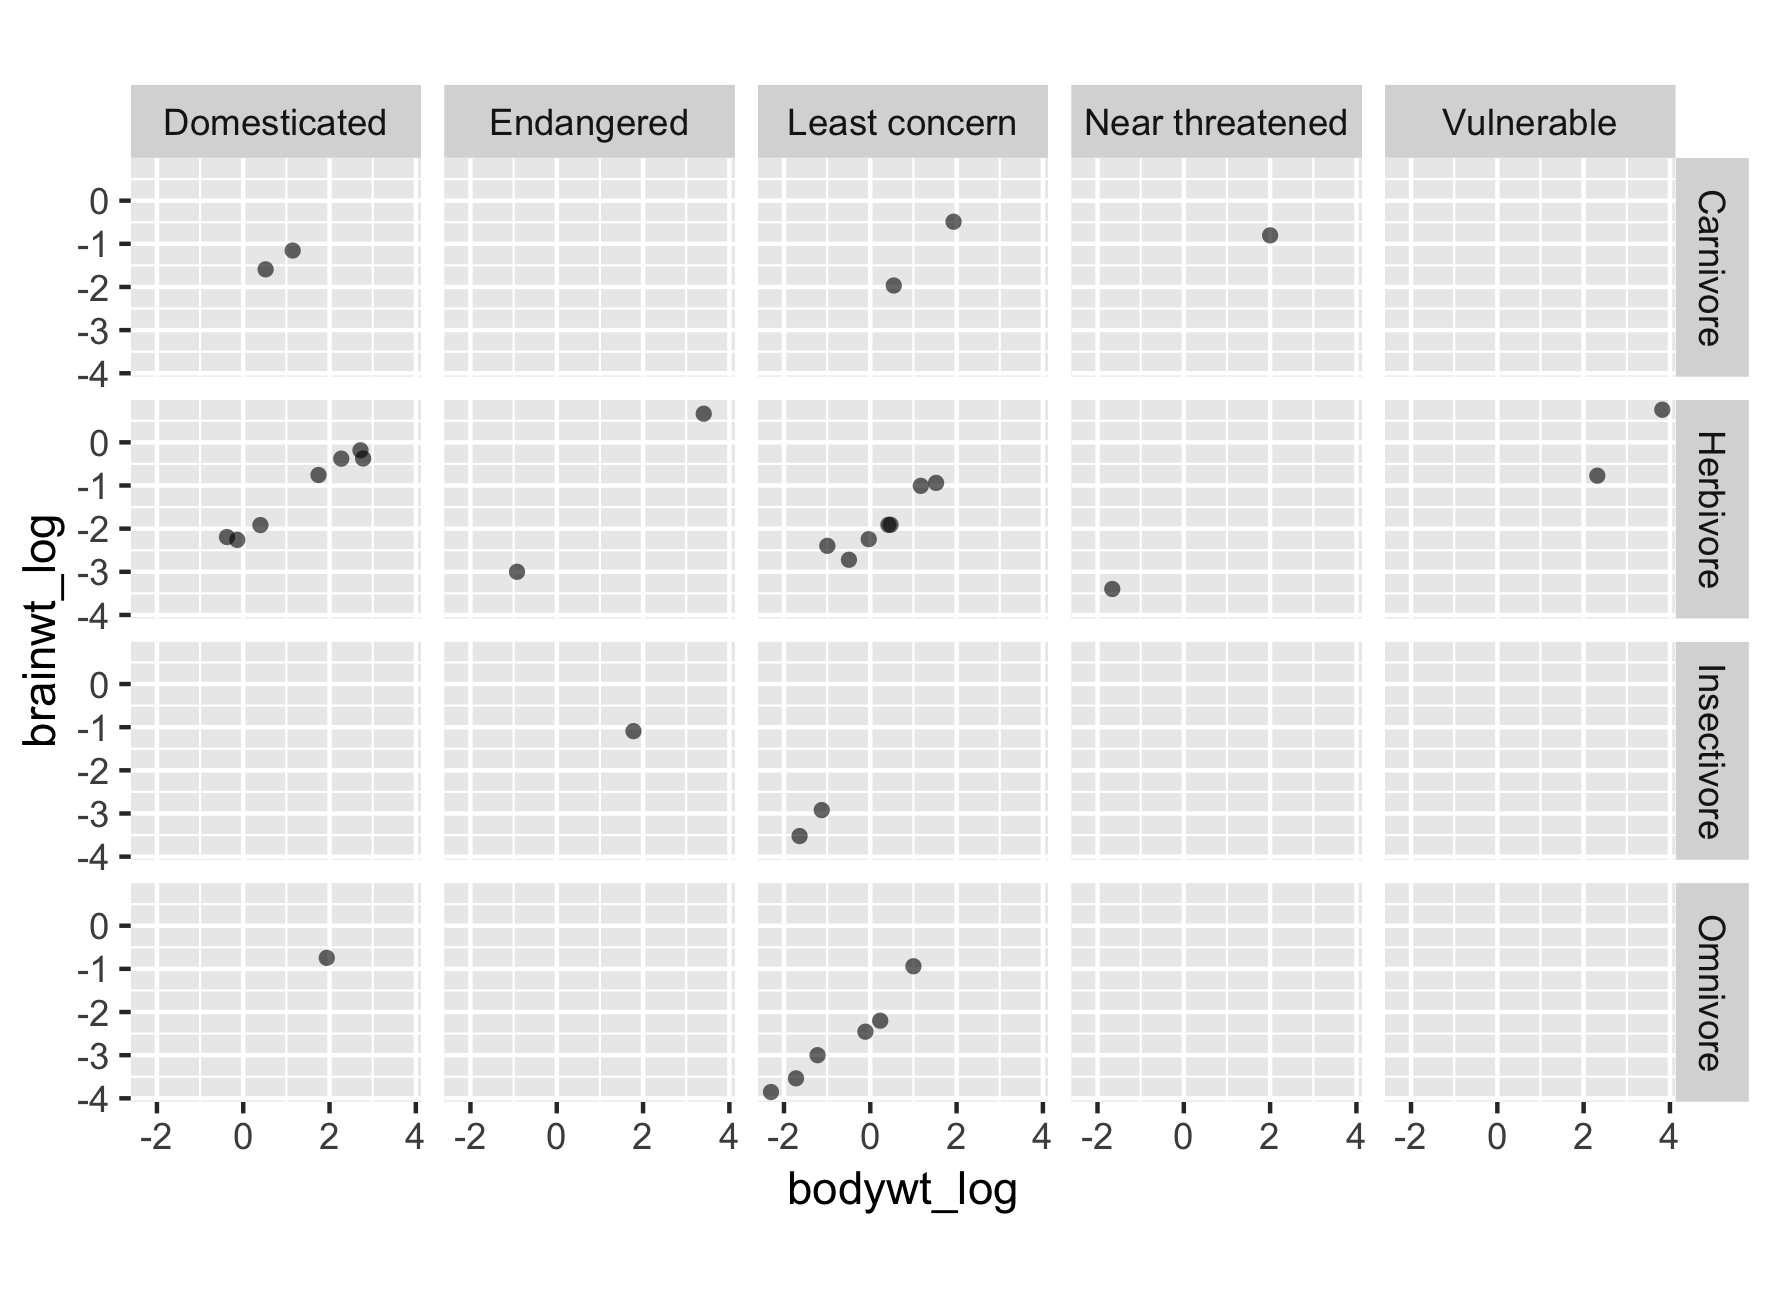
Reinicializar gráfico com novos rótulos
Reinicializar gráfico com nova ordem