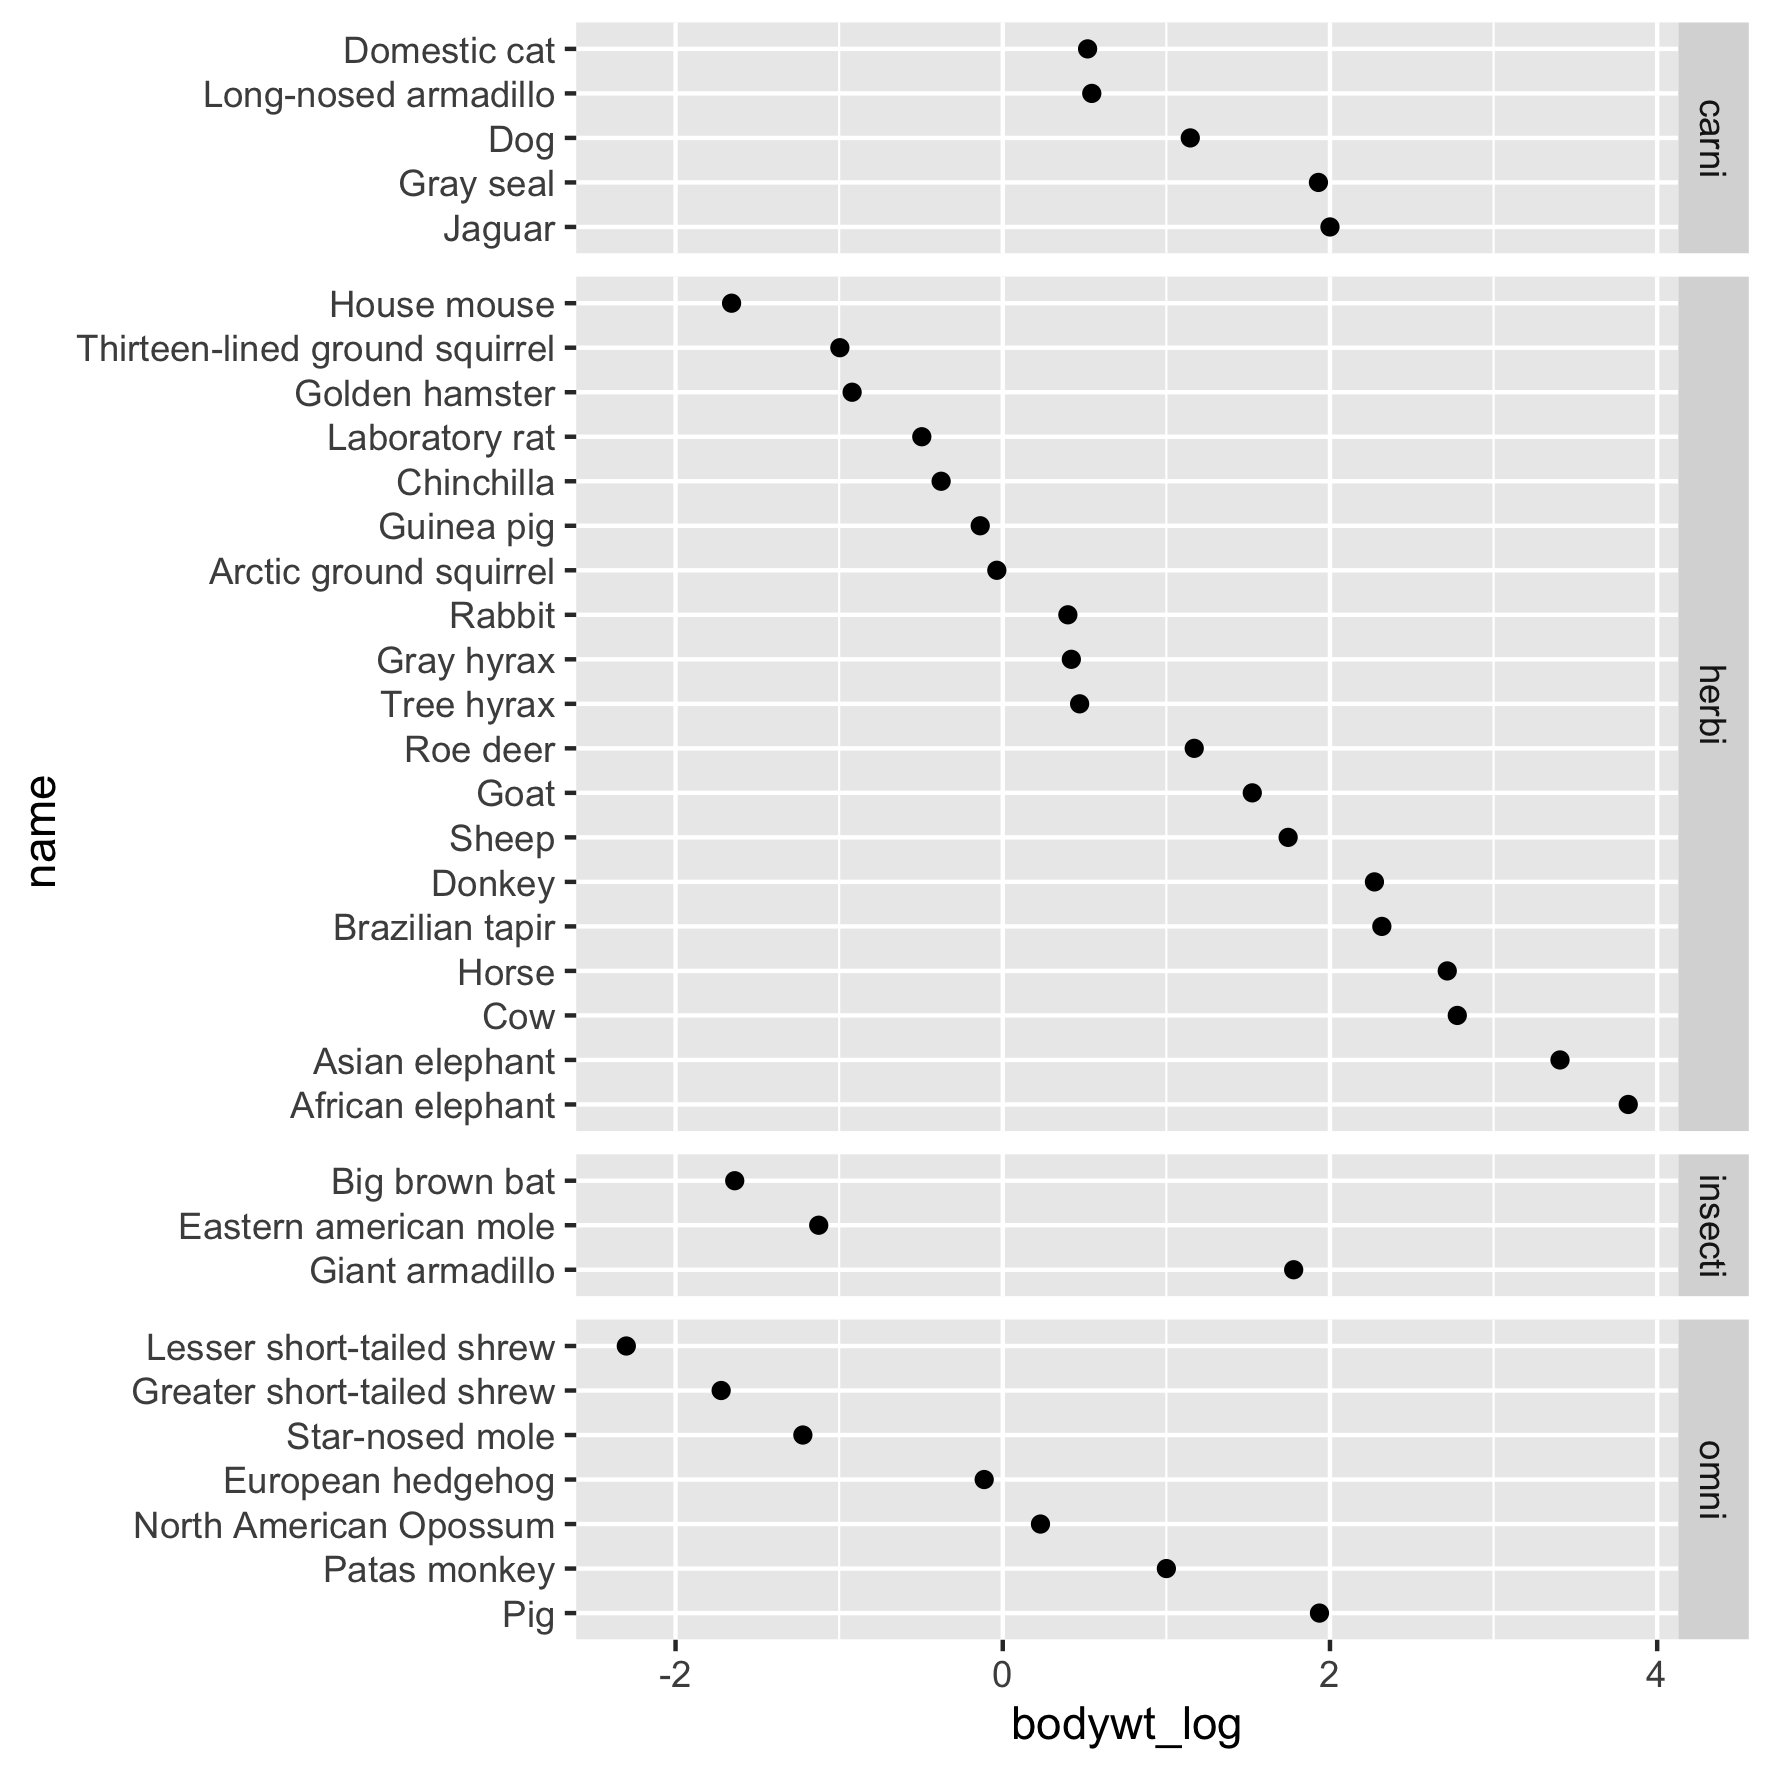
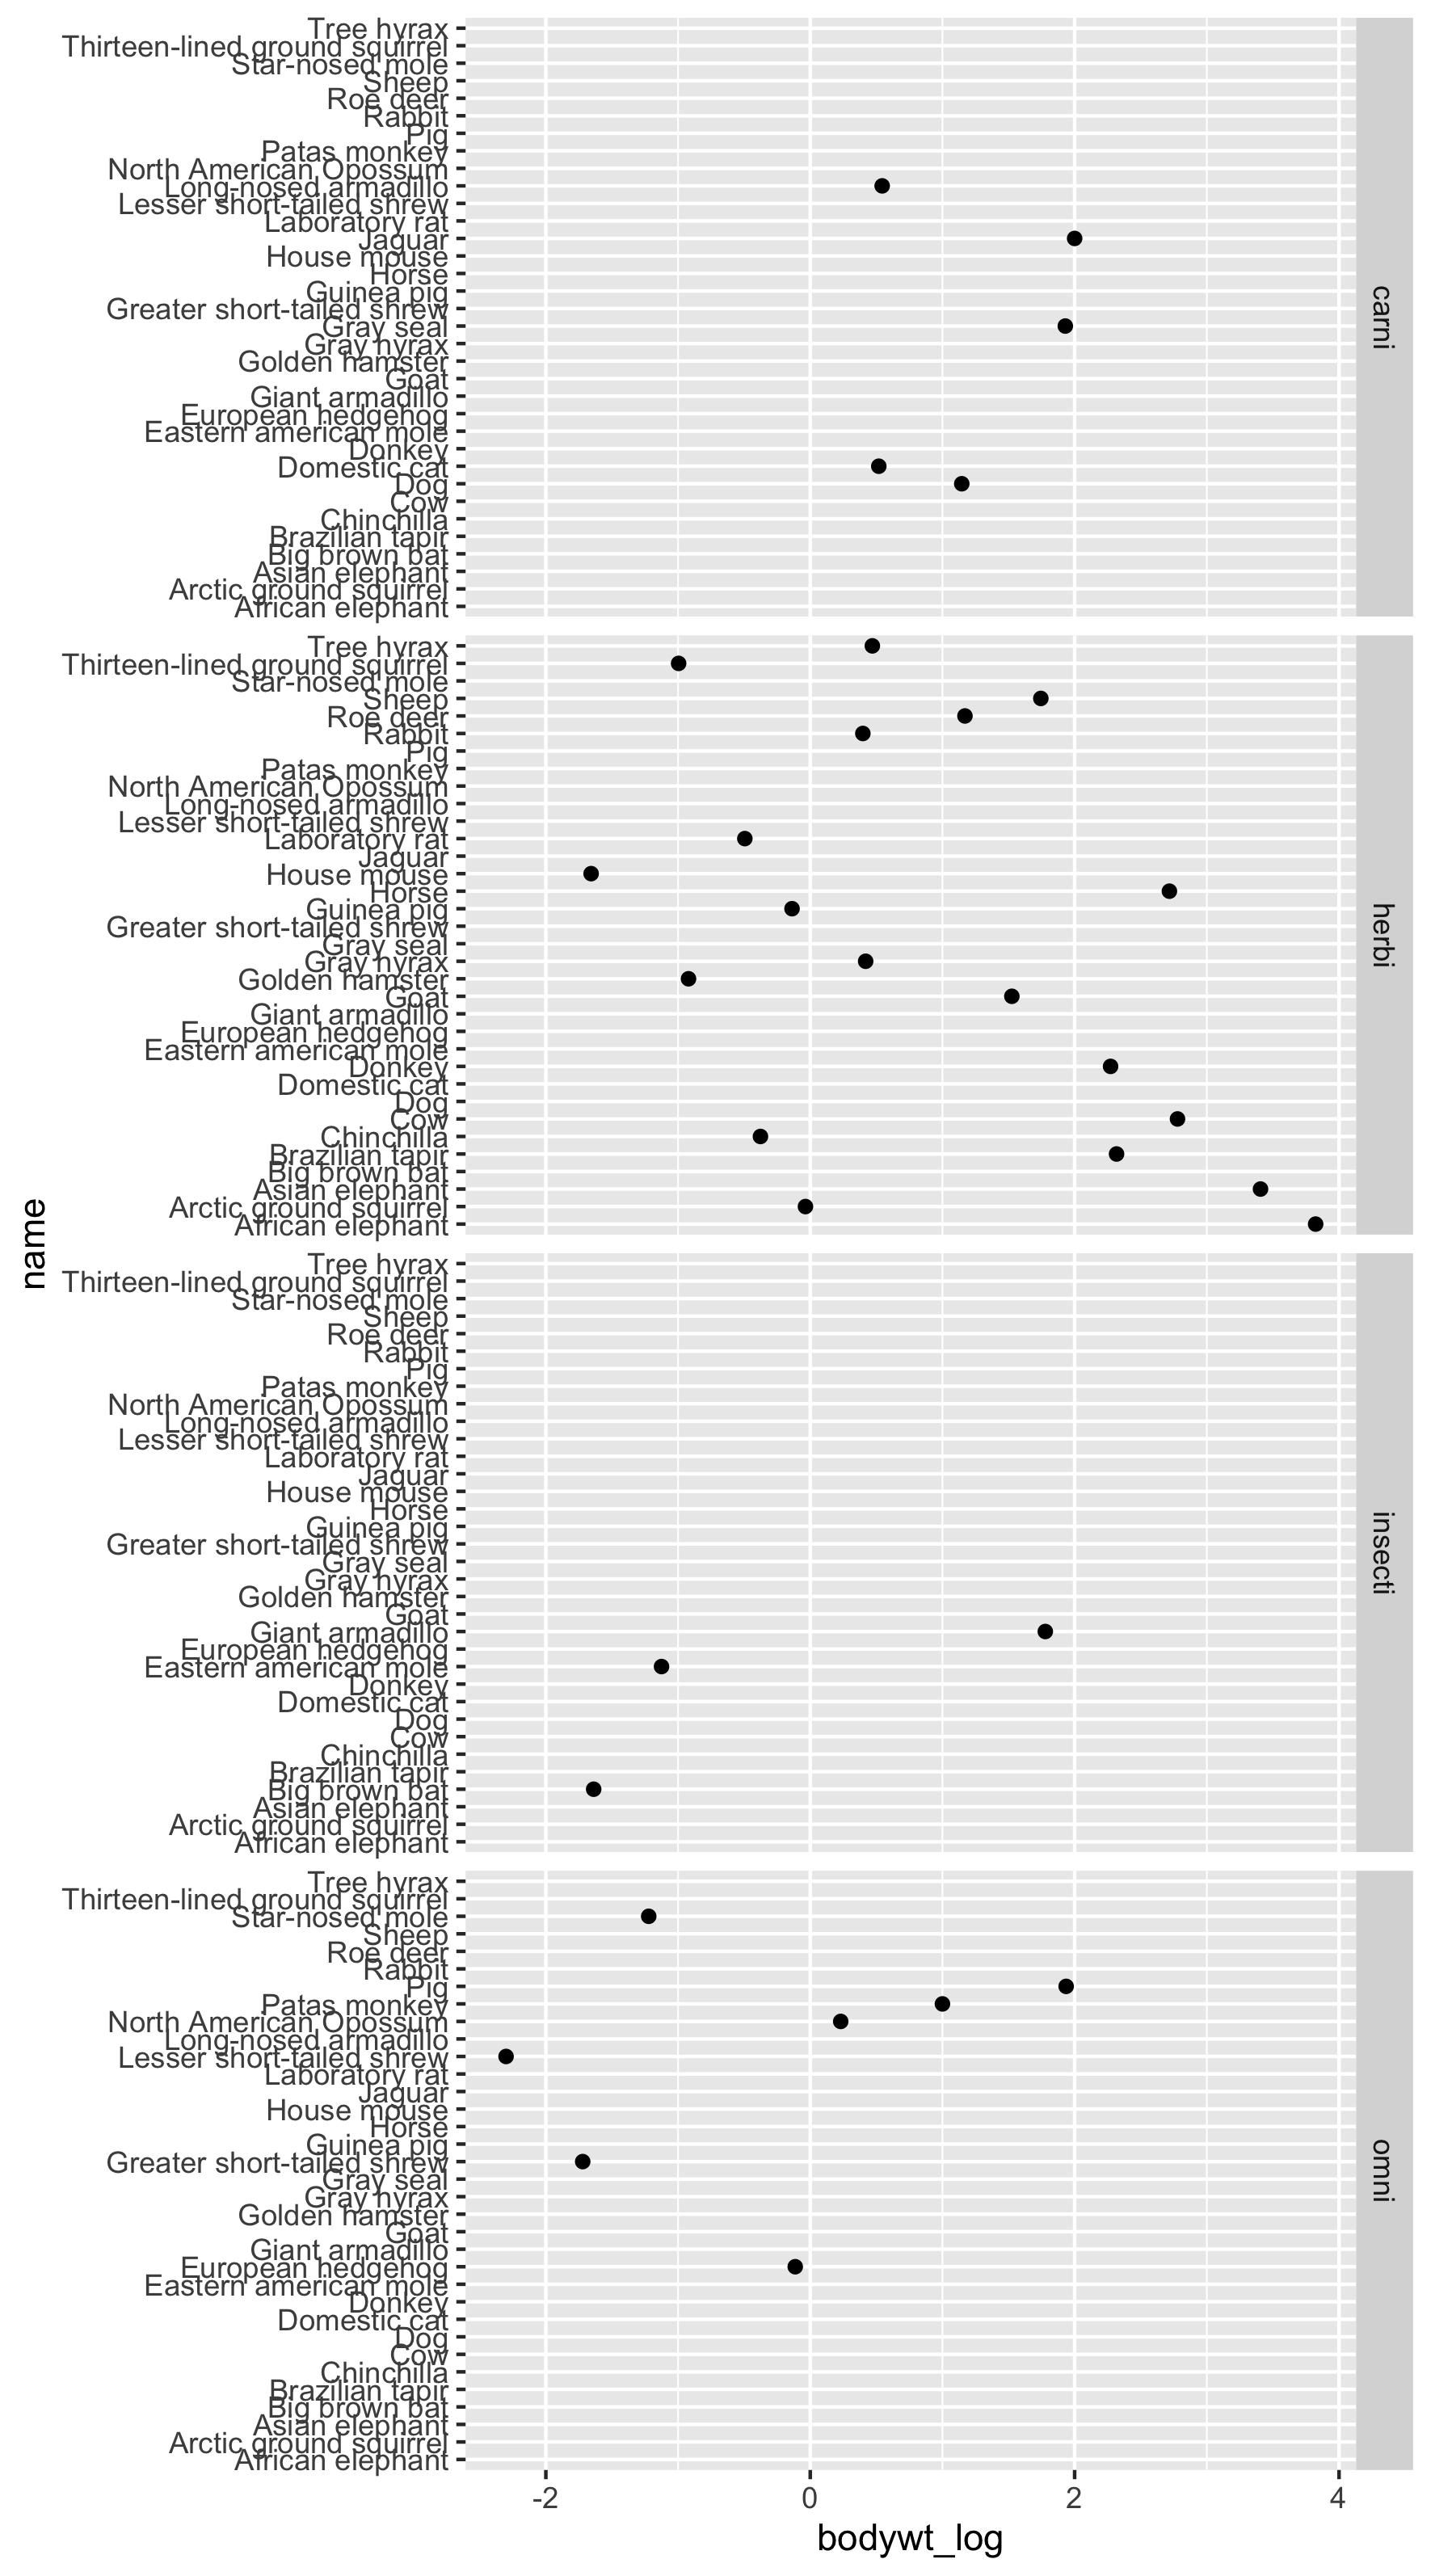
Espaços de plotagem em facetas
Visualização de Dados Intermediária com ggplot2

Rick Scavetta
Founder, Scavetta Academy
Ajustando o espaço de plotagem...
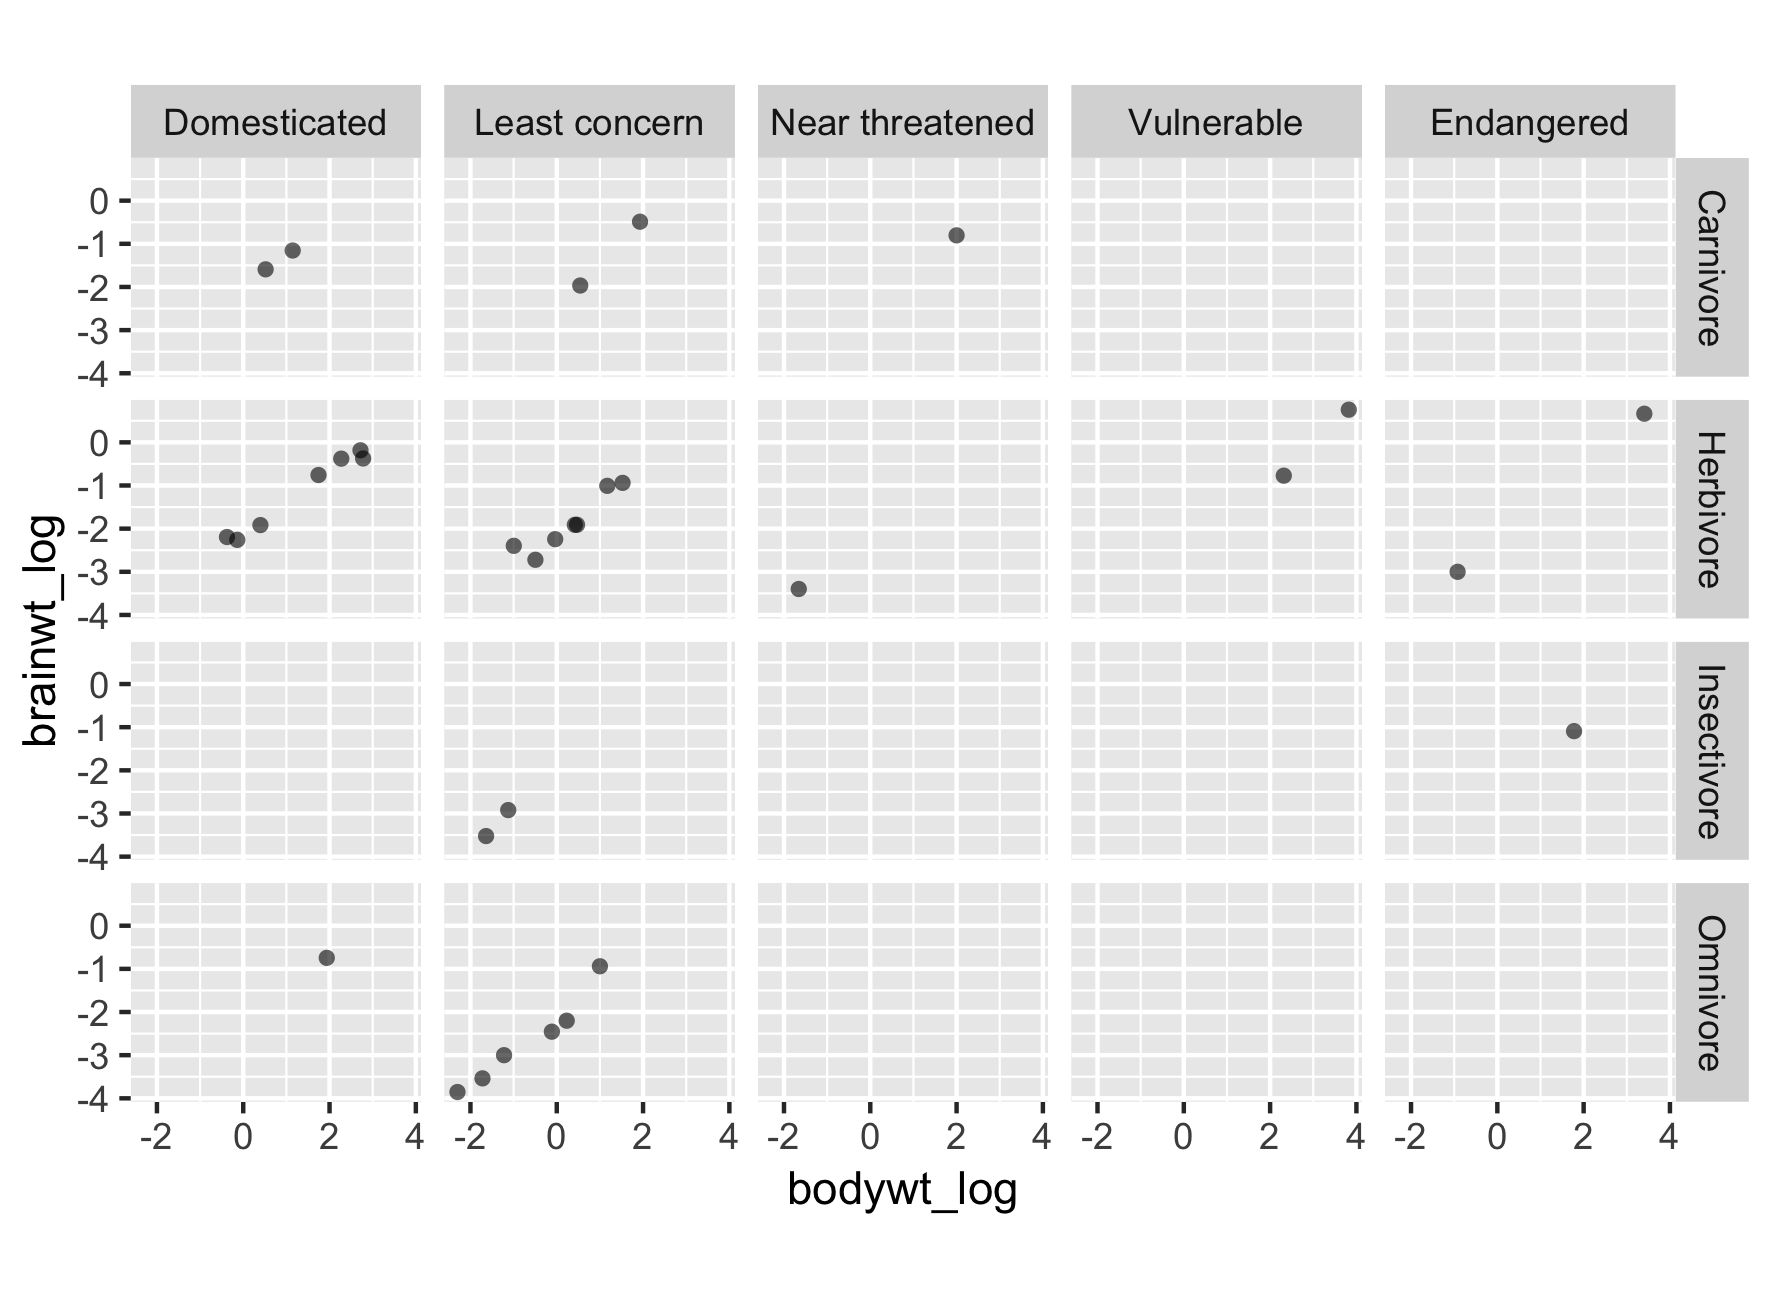
Ajustando o espaço de plotagem
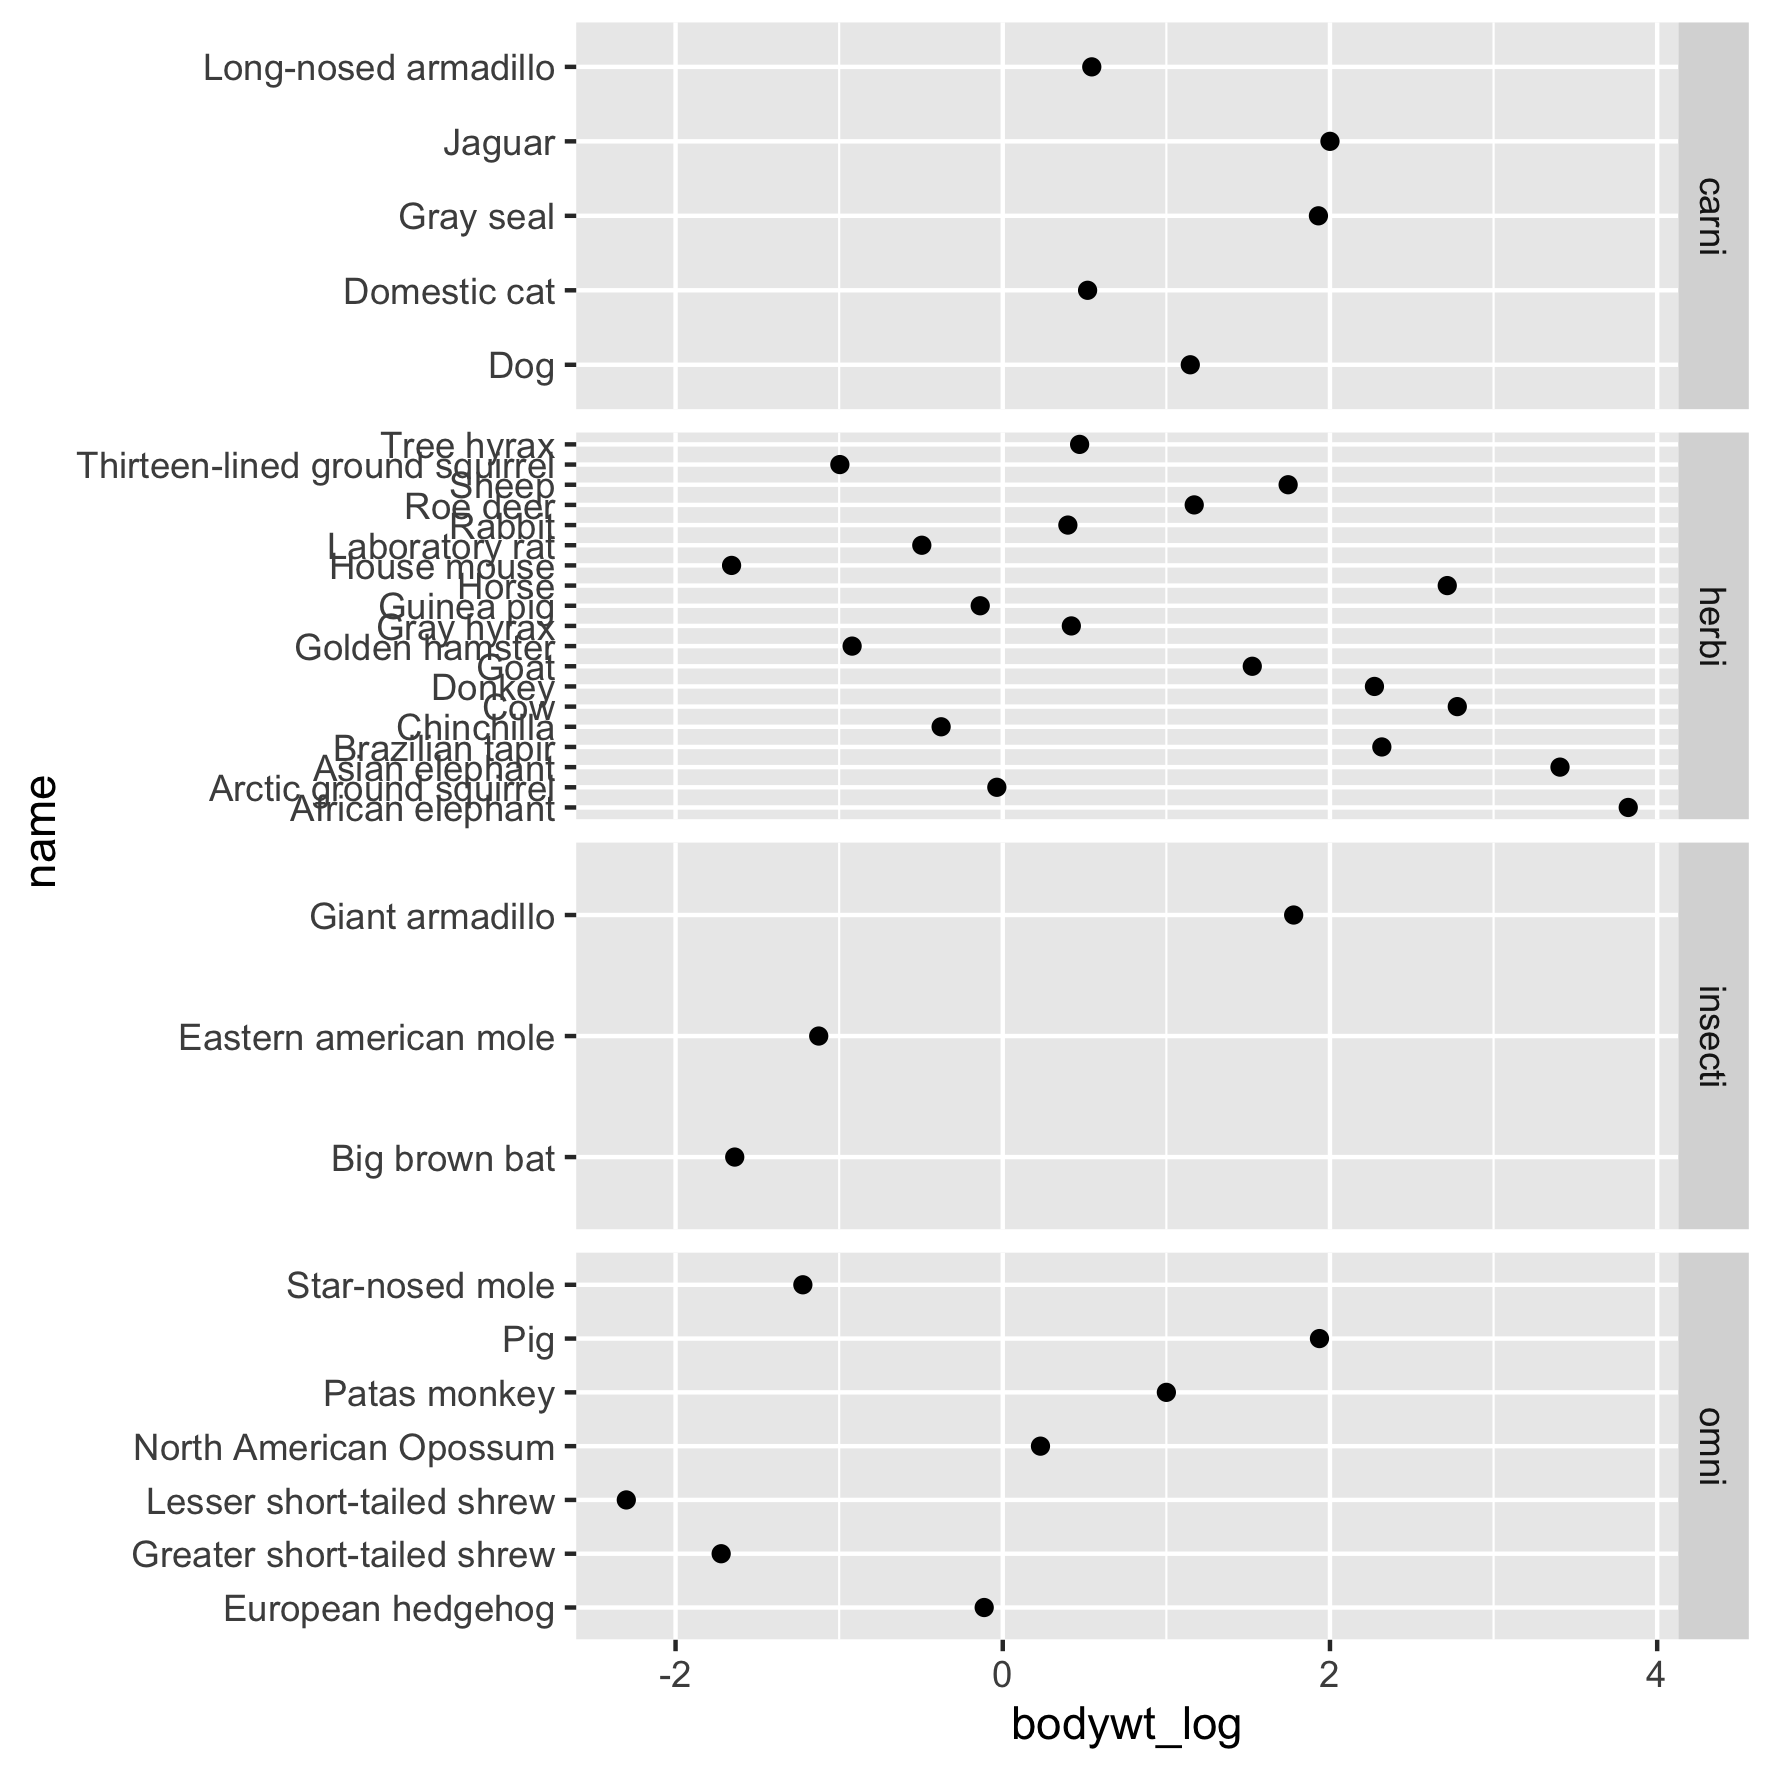
Ajustando o espaço de plotagem

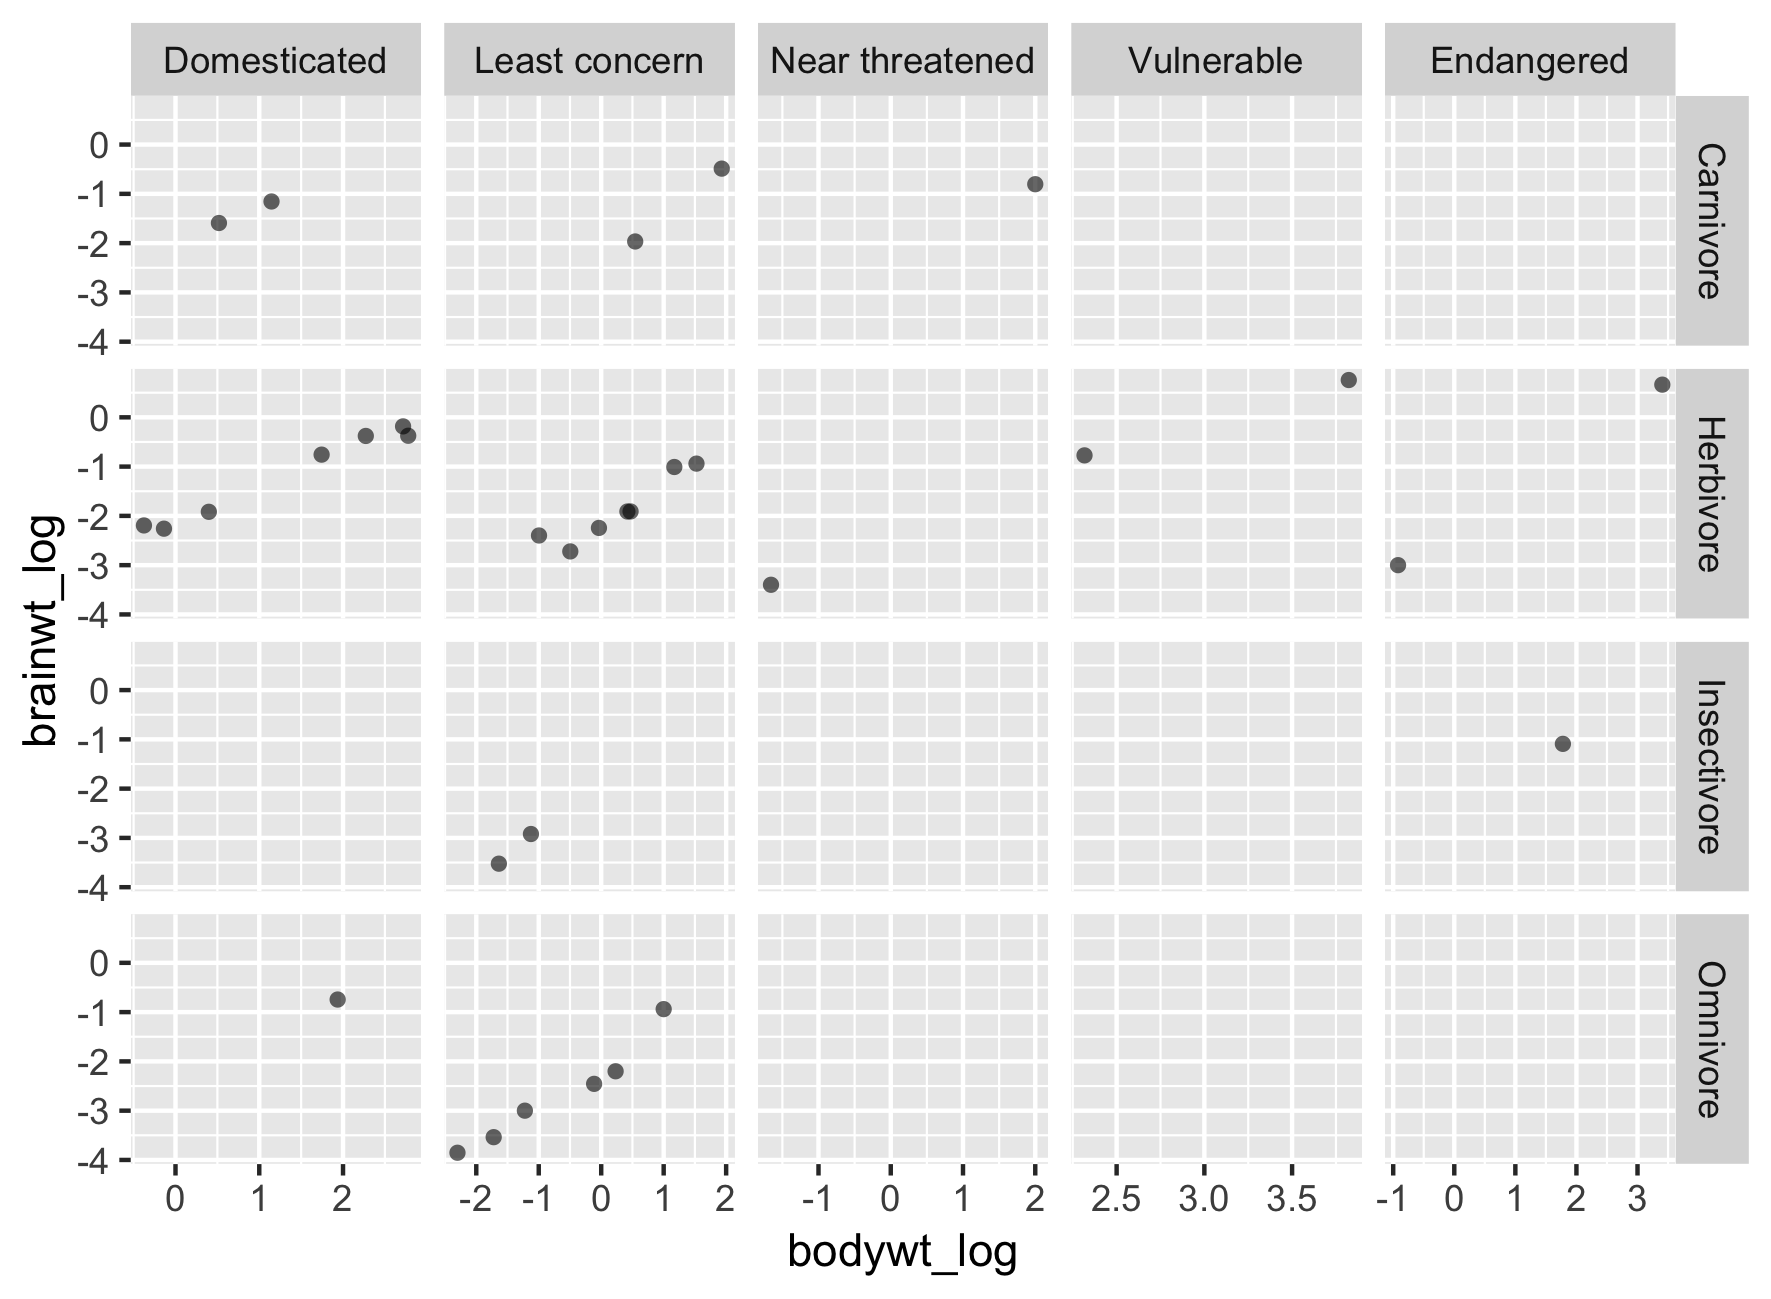
Ajustando o espaço de plotagem
Ajustando o espaço de plotagem
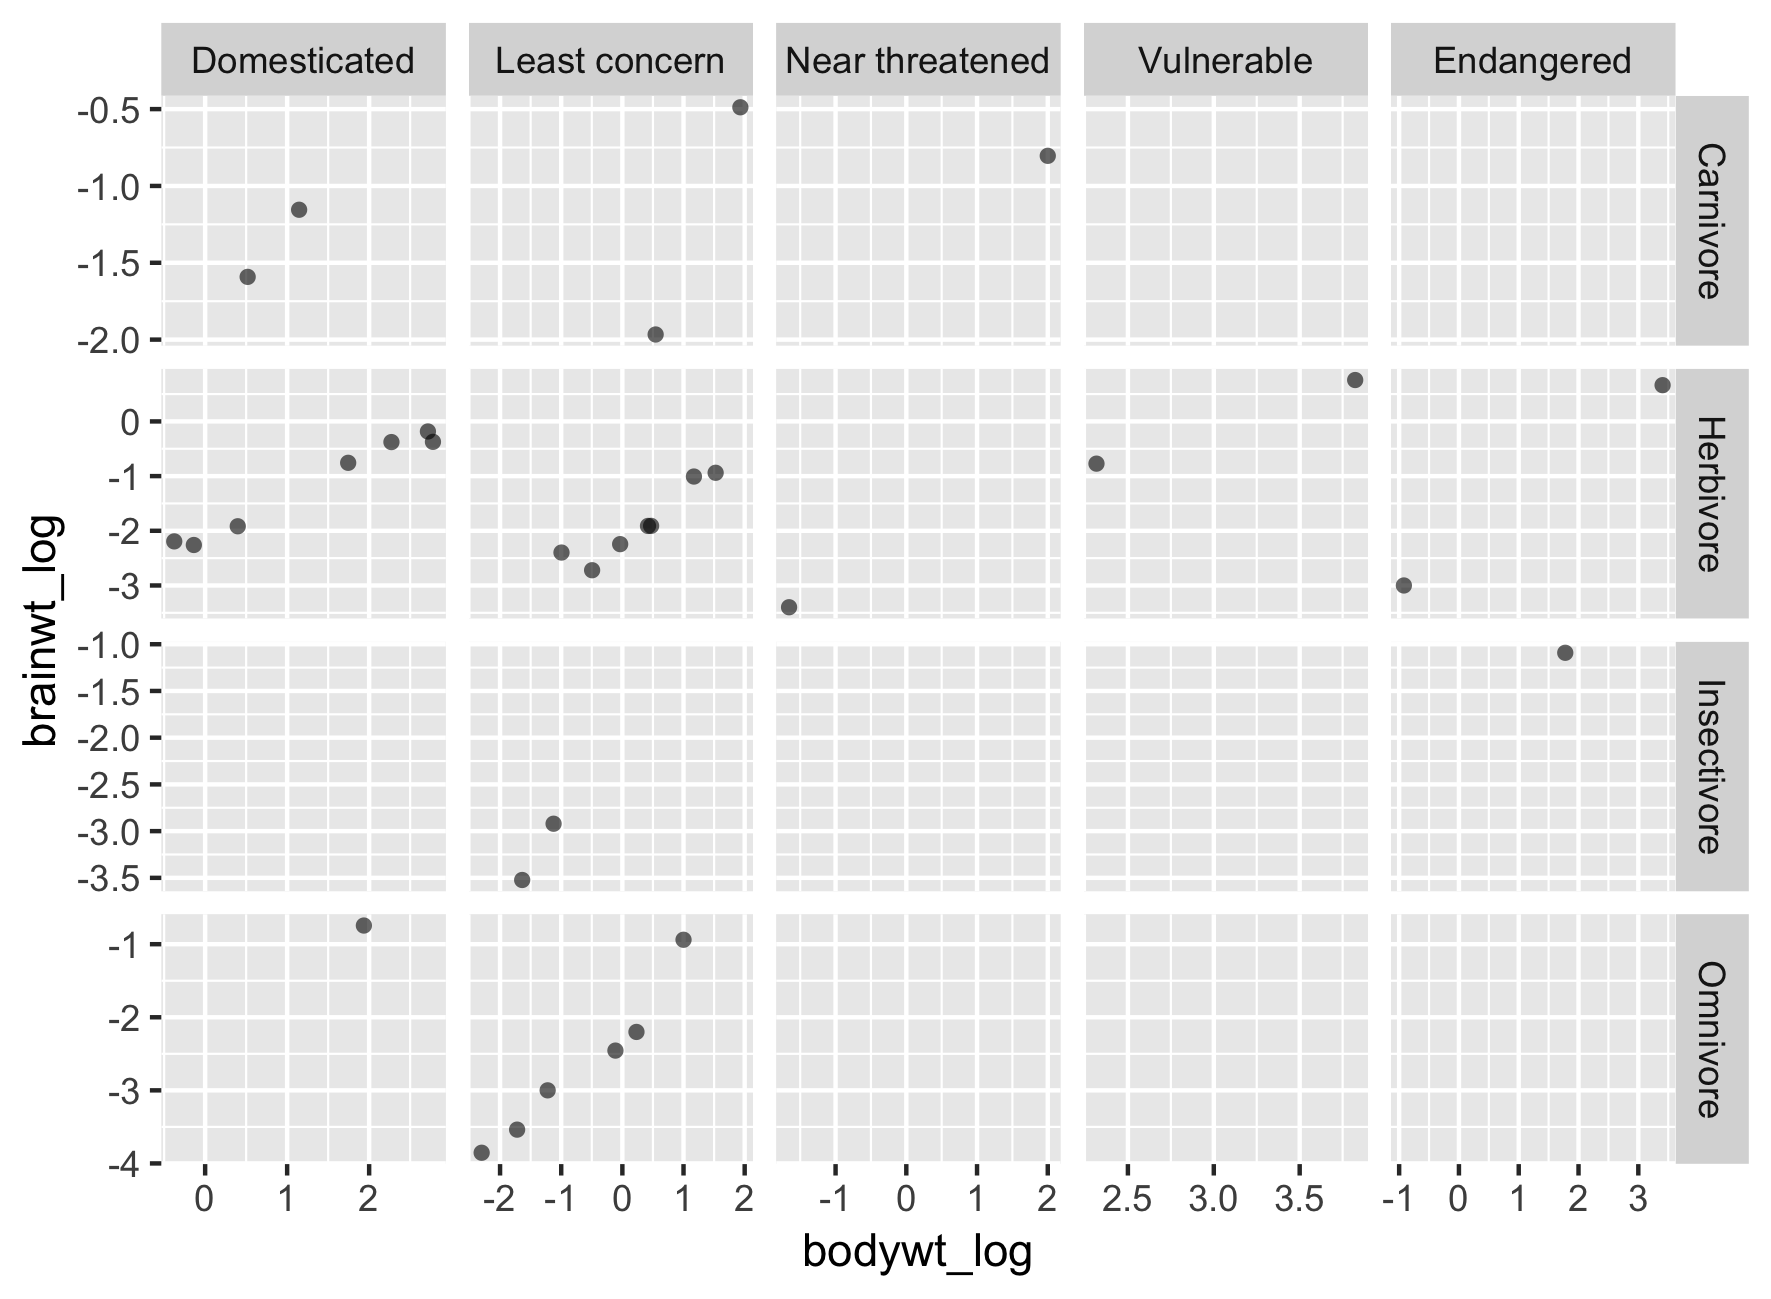
Ajustando o espaço de plotagem
Ajustando o espaço de plotagem
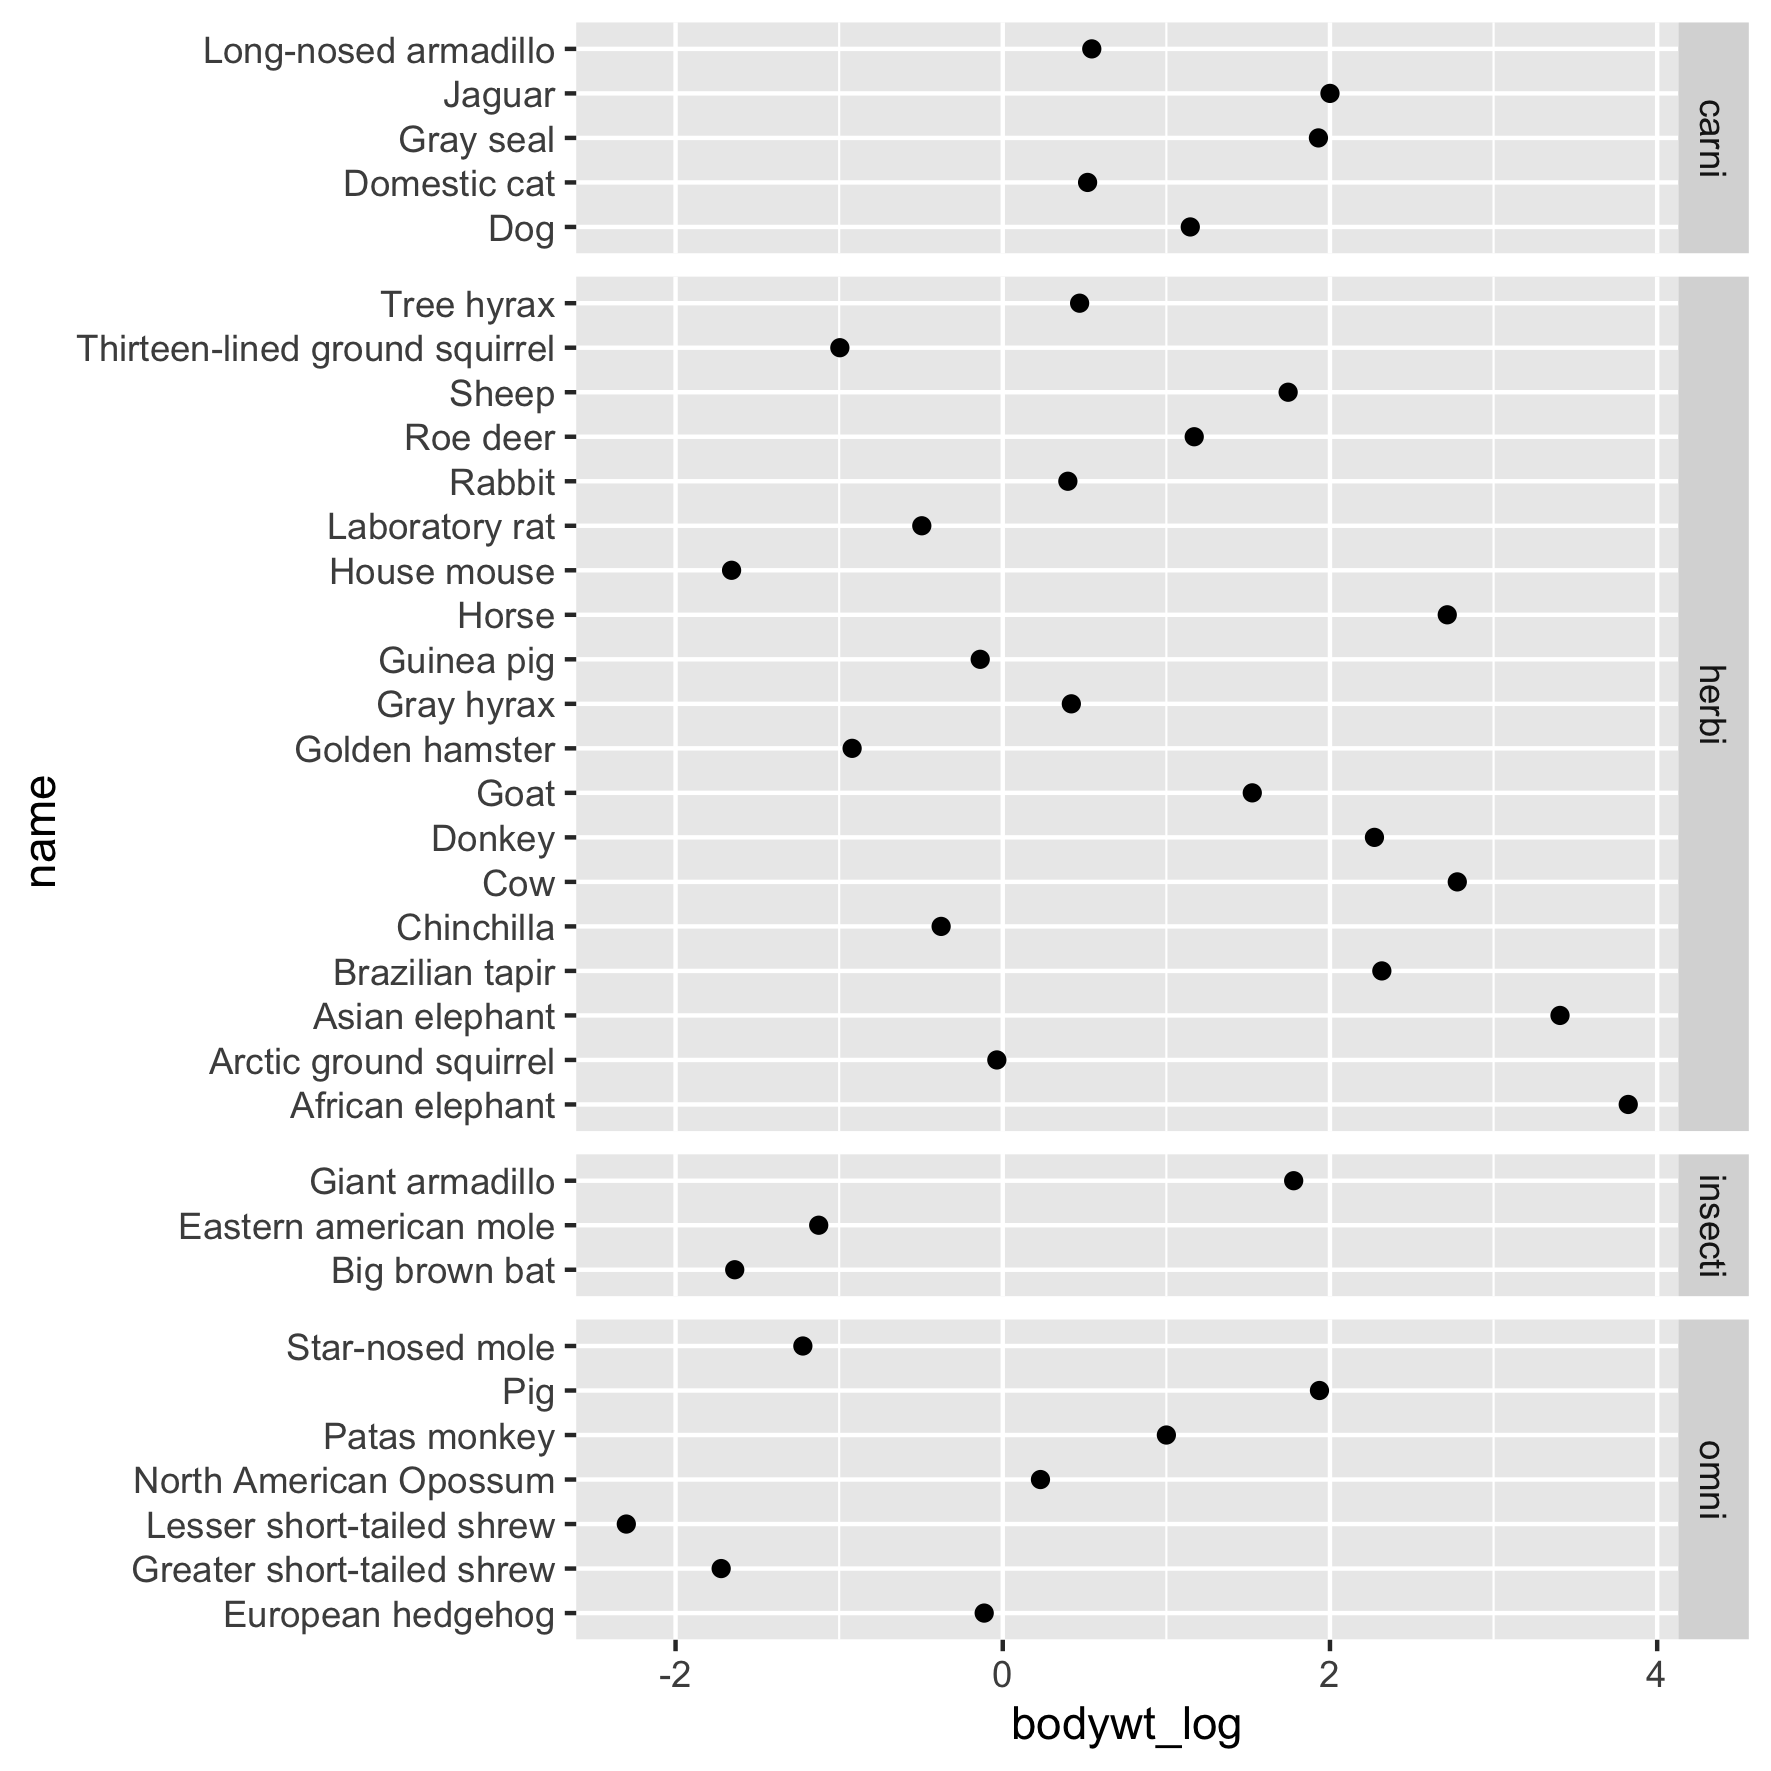
Ajustes finais