Boas práticas: gráficos de barras
Visualização de Dados Intermediária com ggplot2

Rick Scavetta
Founder, Scavetta Academy
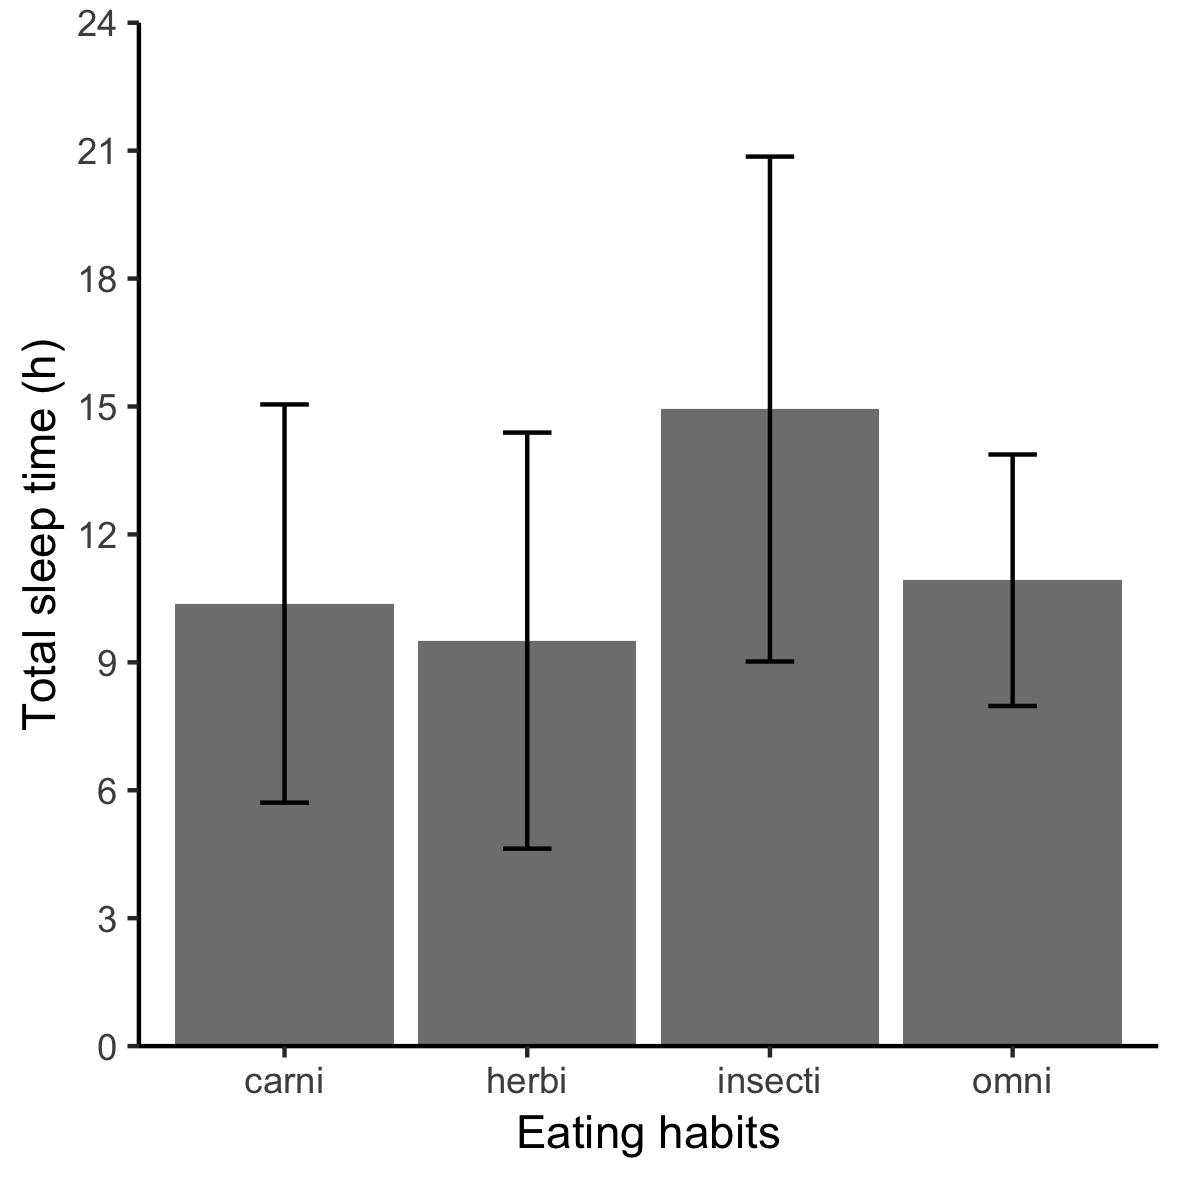
Gráfico dinamite
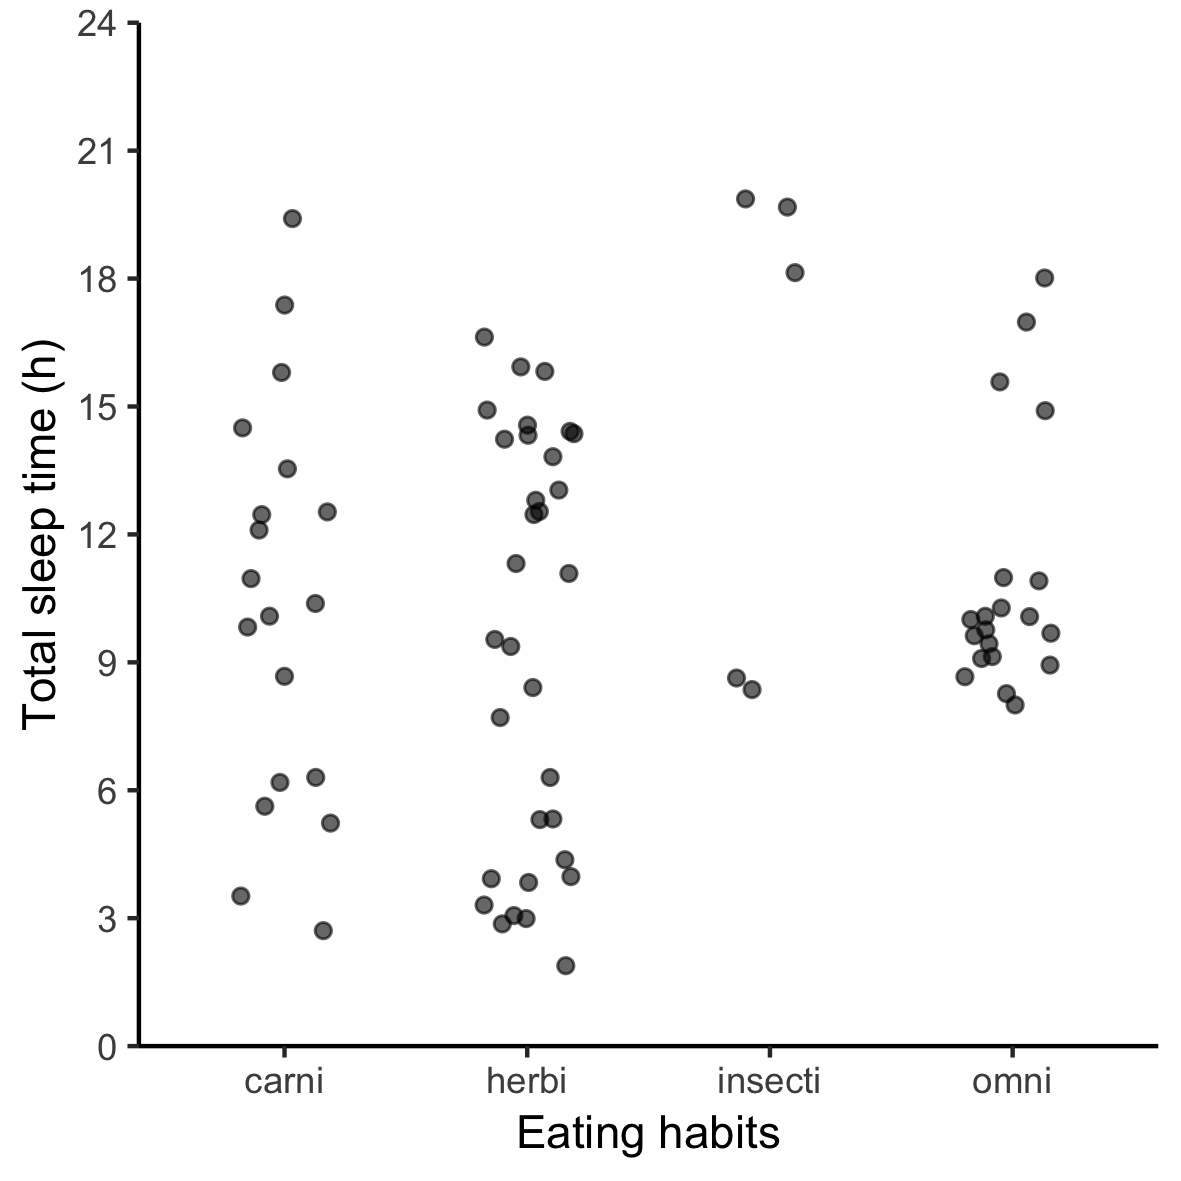
Pontos individuais
geom_errorbar()
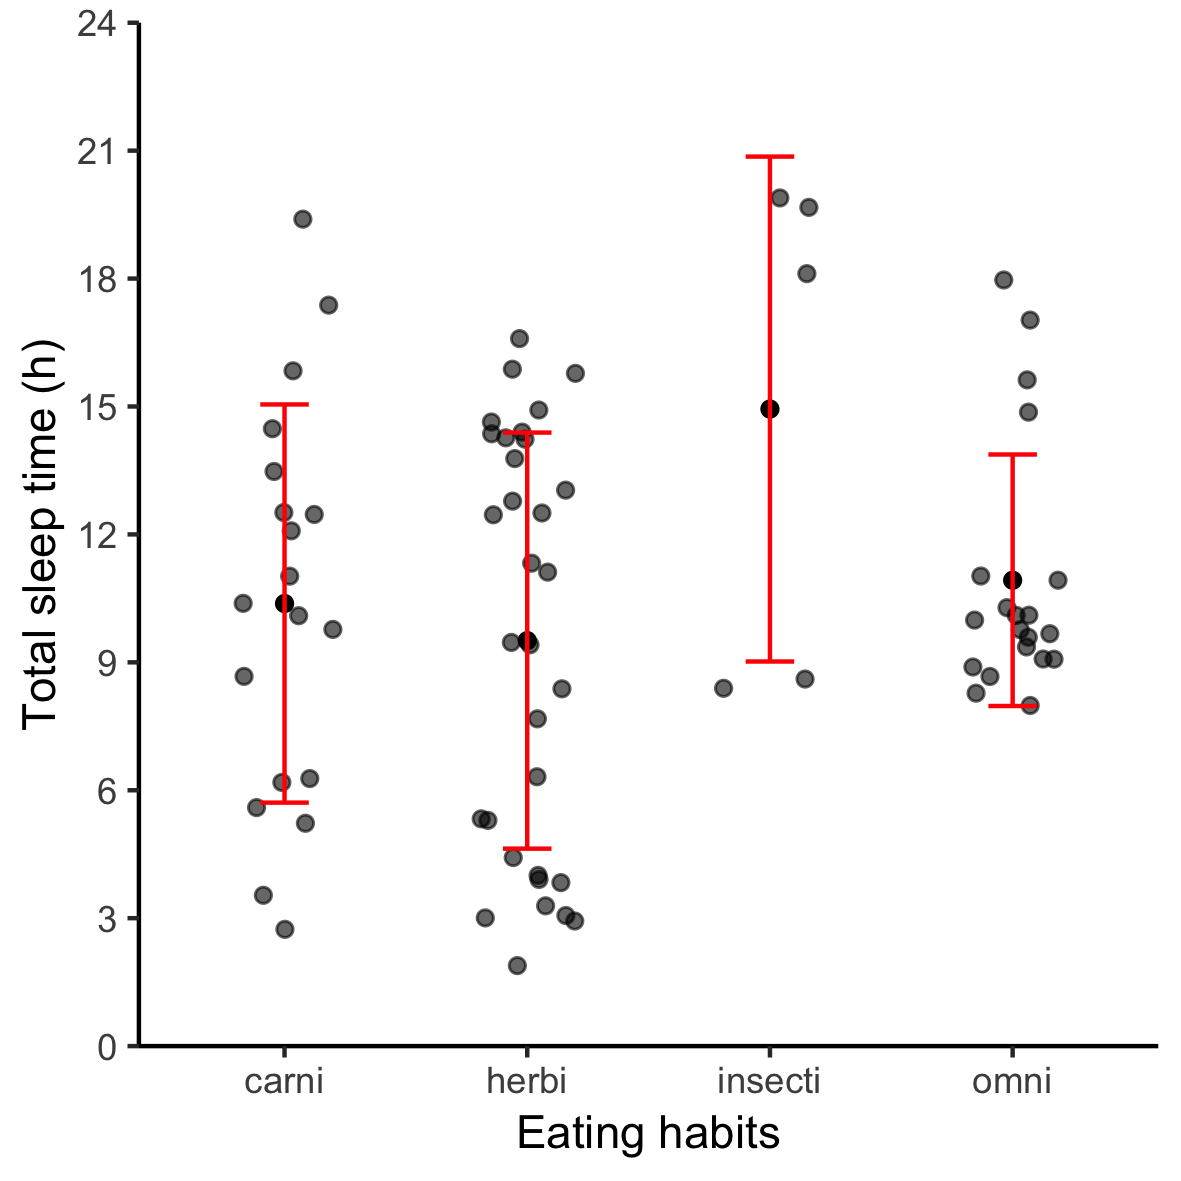
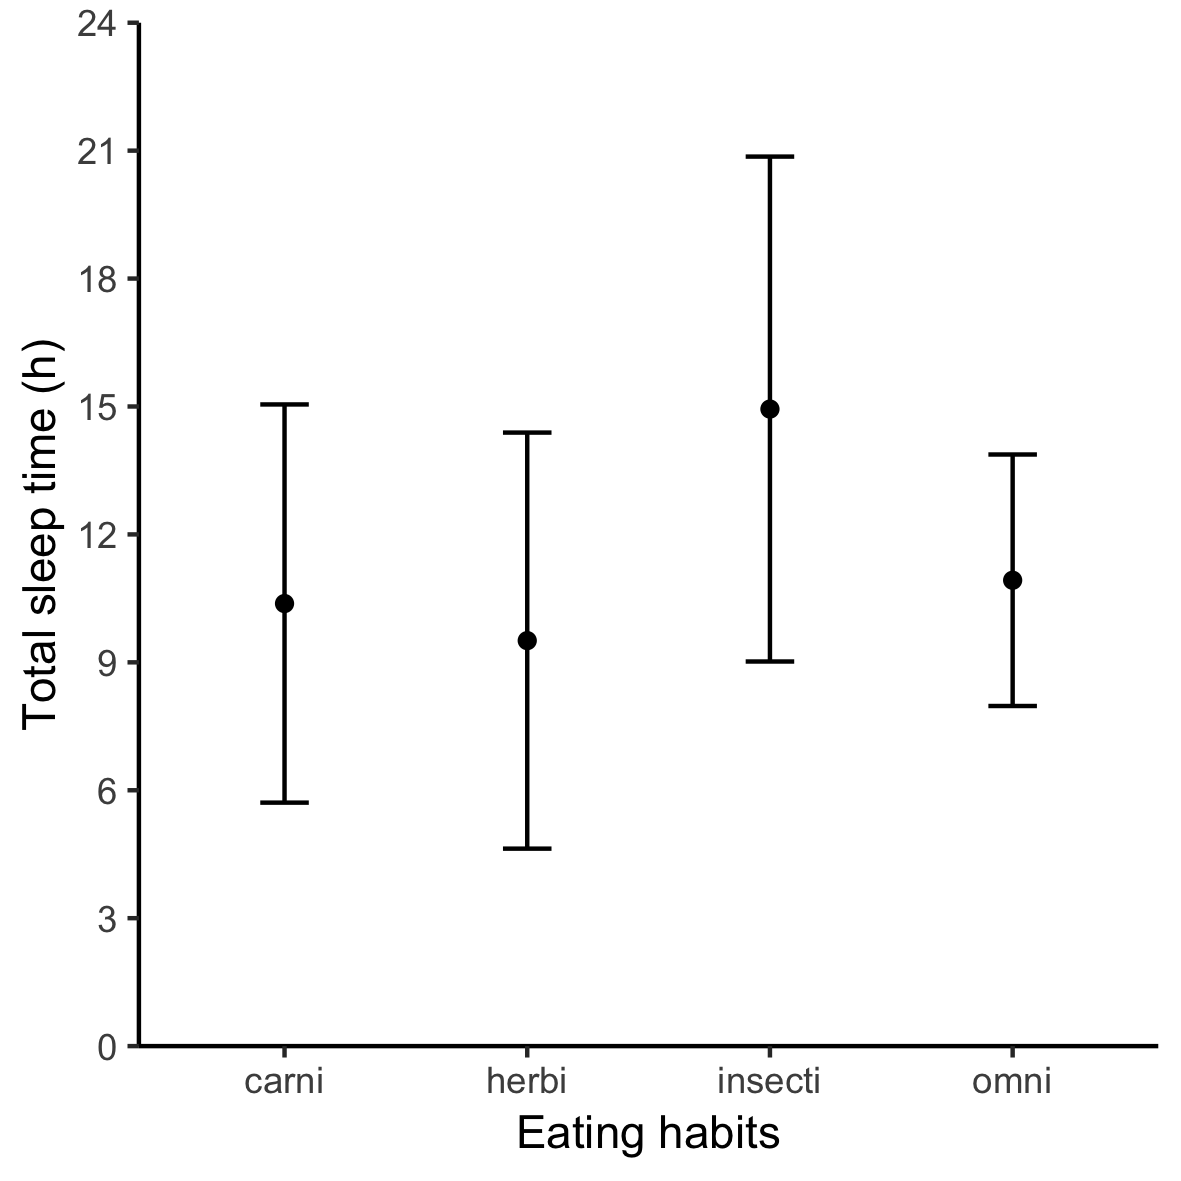
geom_pointrange()
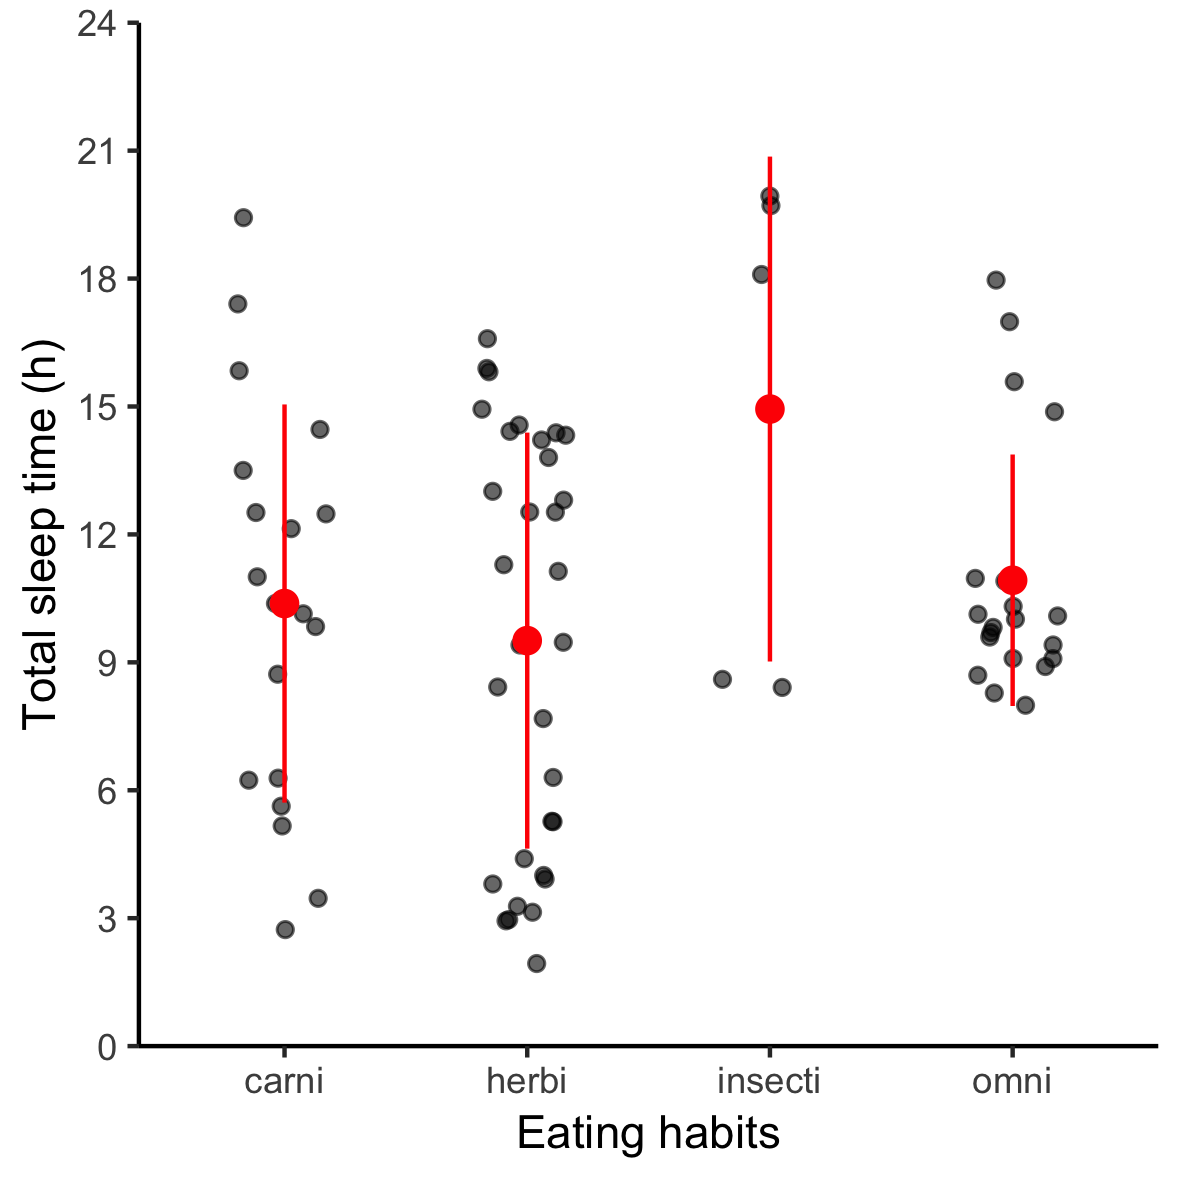
Sem pontos de dados
Barras nem sempre são necessárias
Visualização de Dados Intermediária com ggplot2
Rick Scavetta
Founder, Scavetta Academy

