Coordenadas polares
Visualização de Dados Intermediária com ggplot2

Rick Scavetta
Founder, Scavetta Academy
Projeções moldam a percepção
Projeções moldam a percepção
Prévia de projeções de mapas
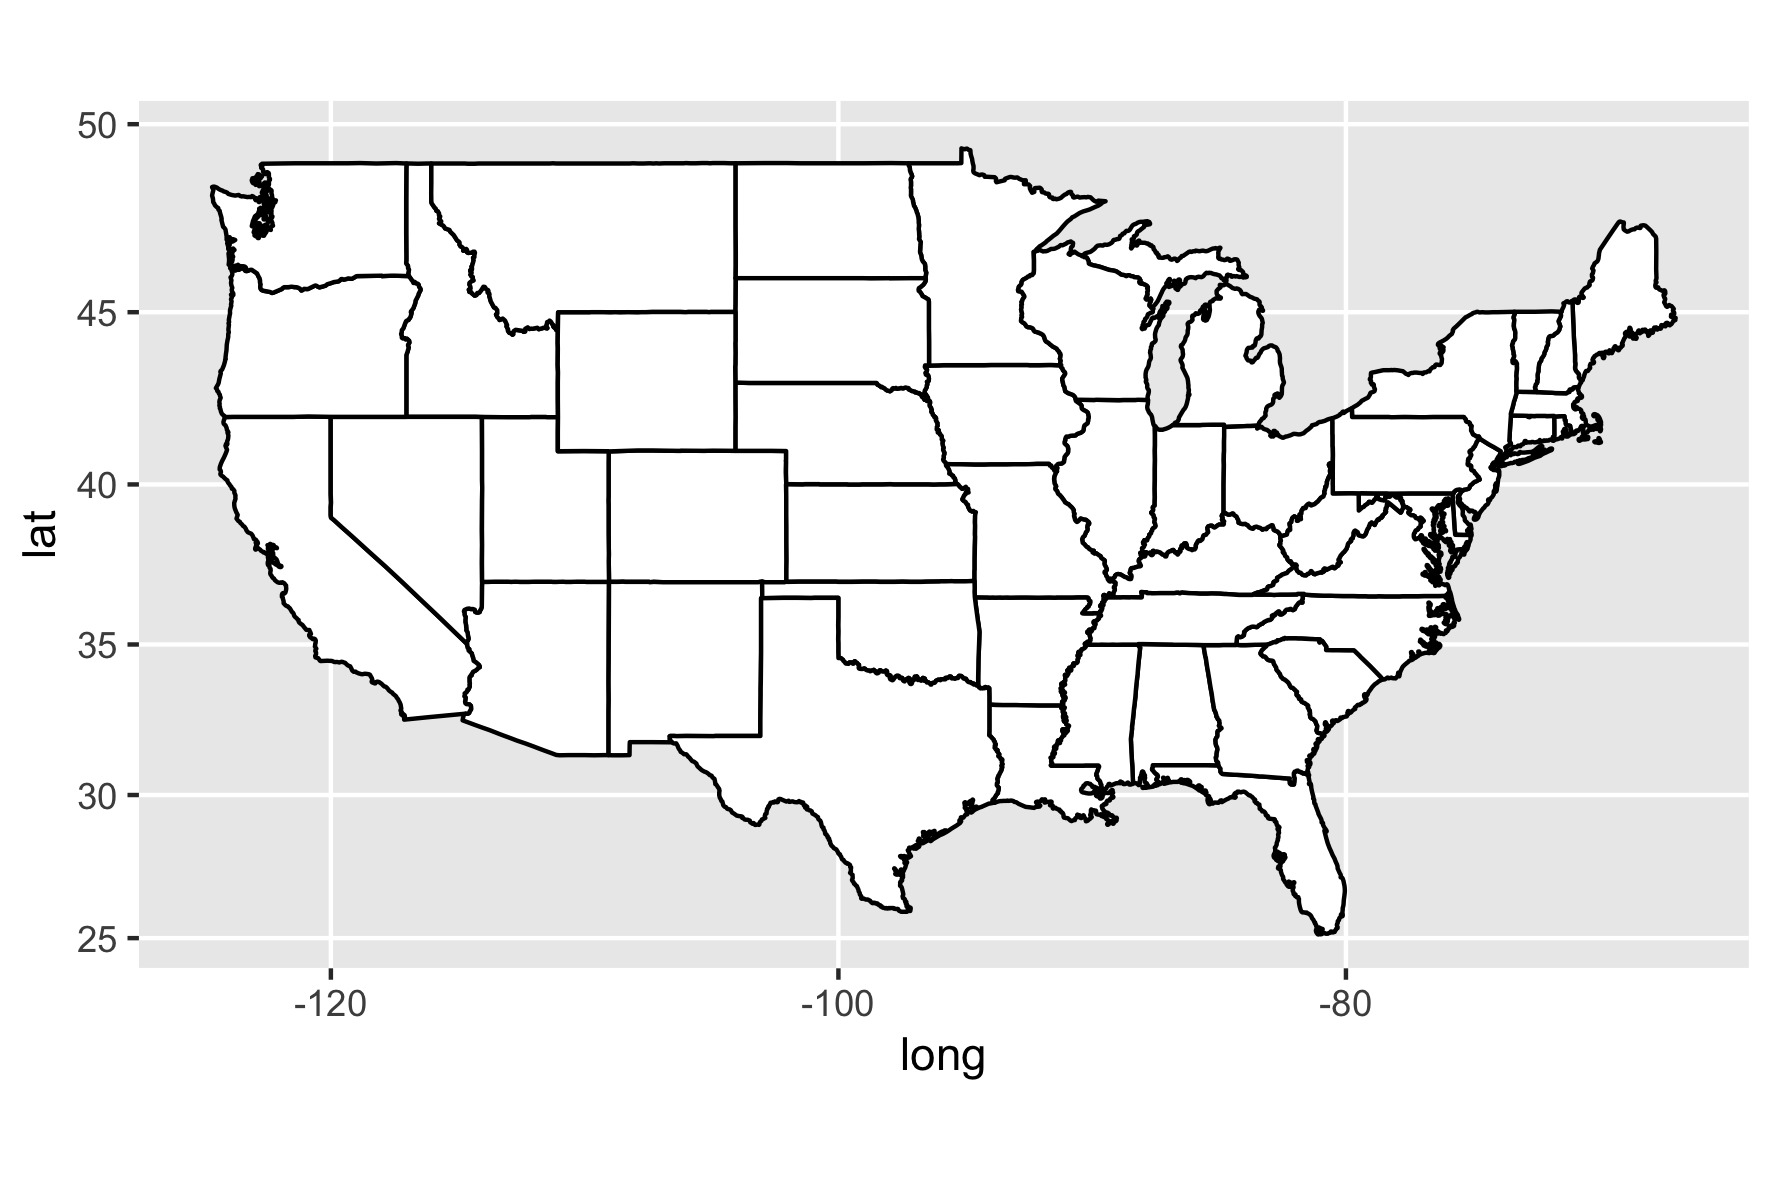
Projeção de Mercator
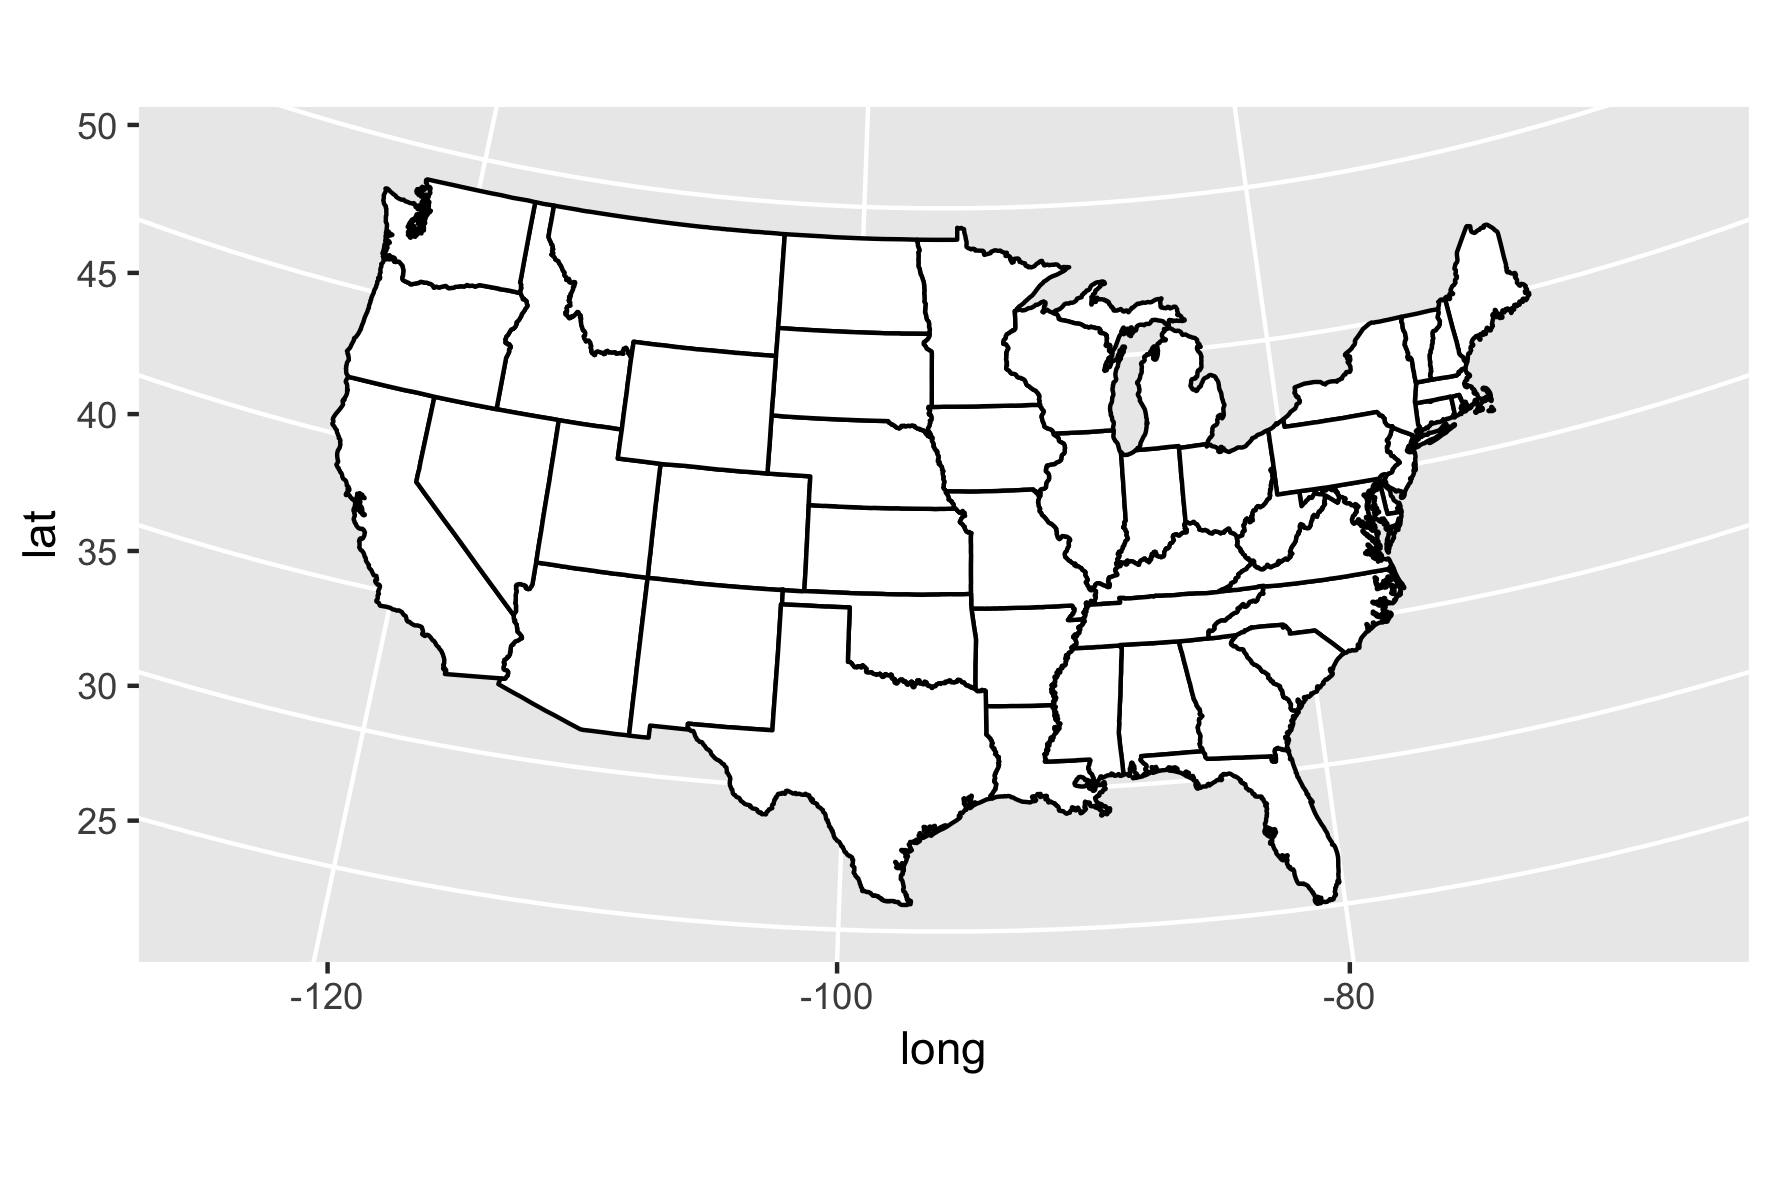
Projeção cônica
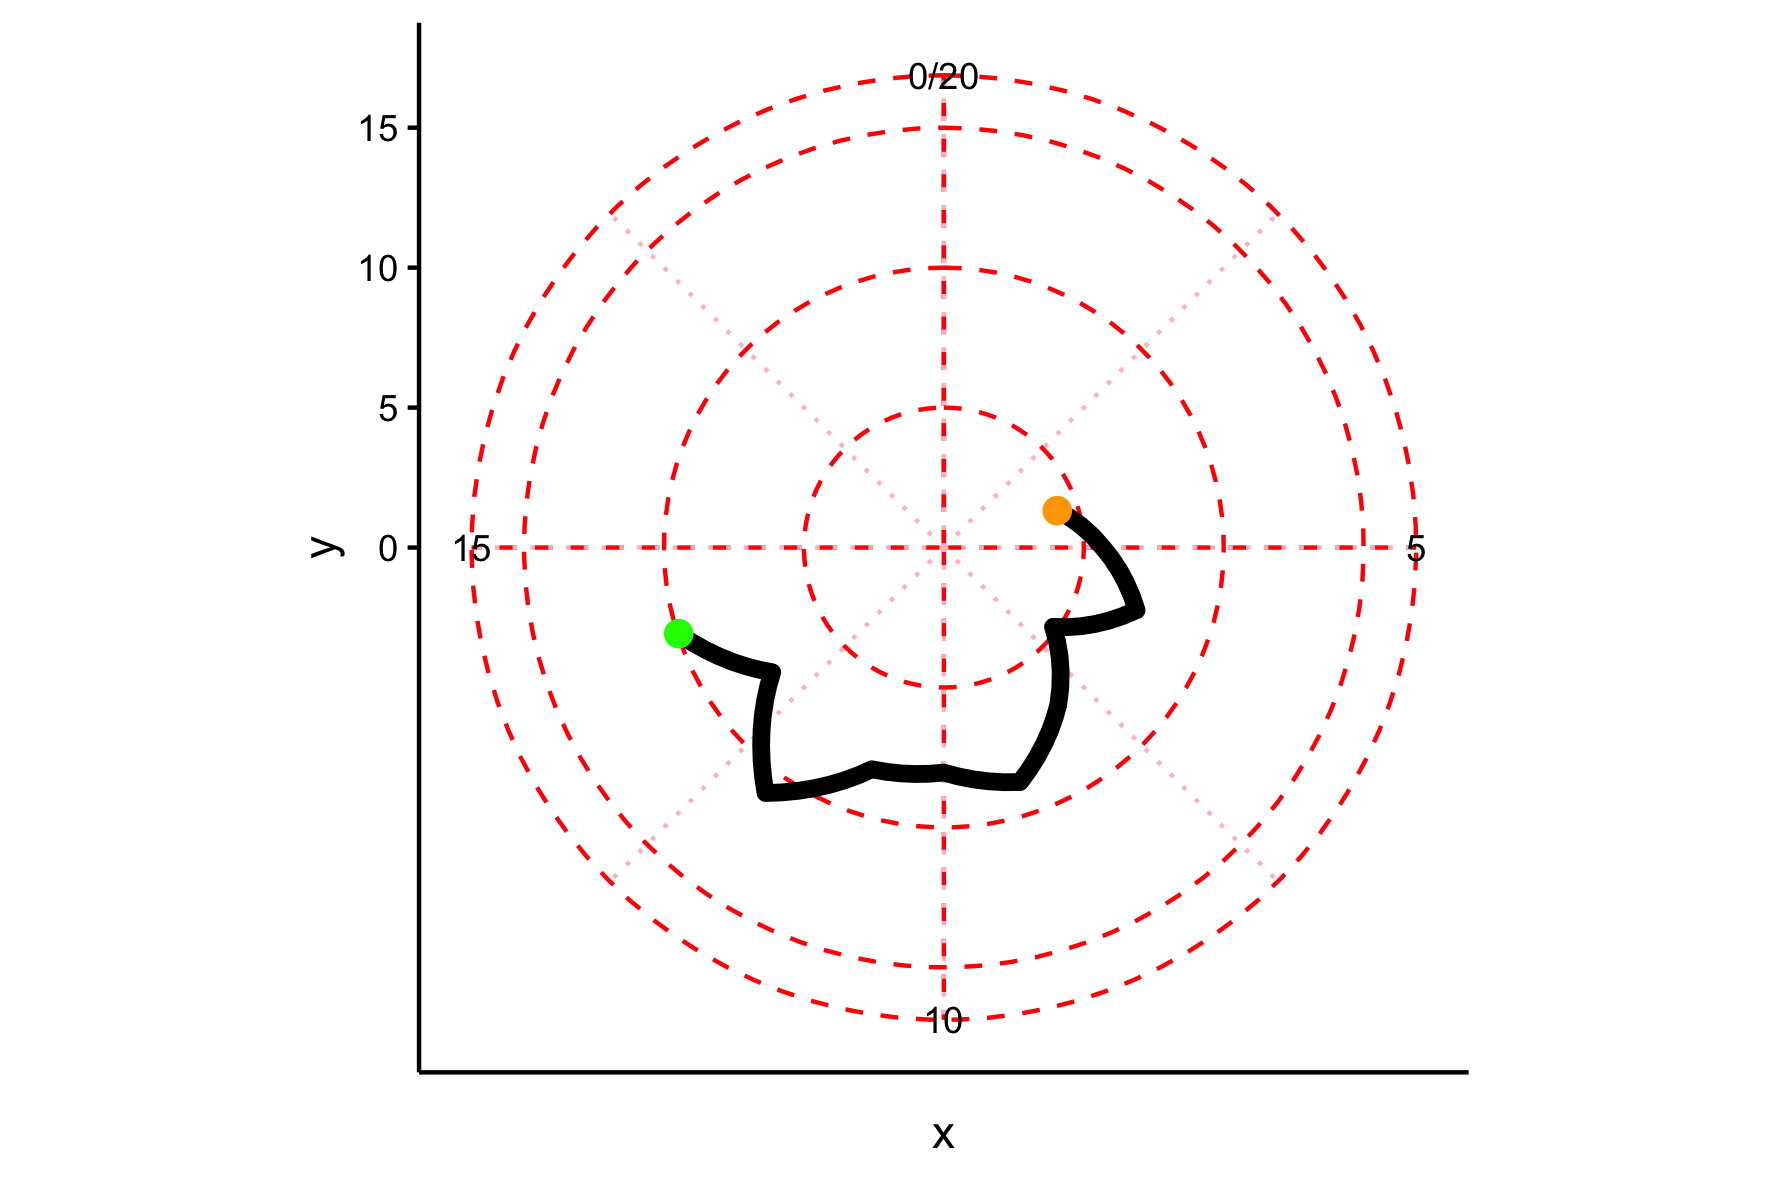
coord_polar()
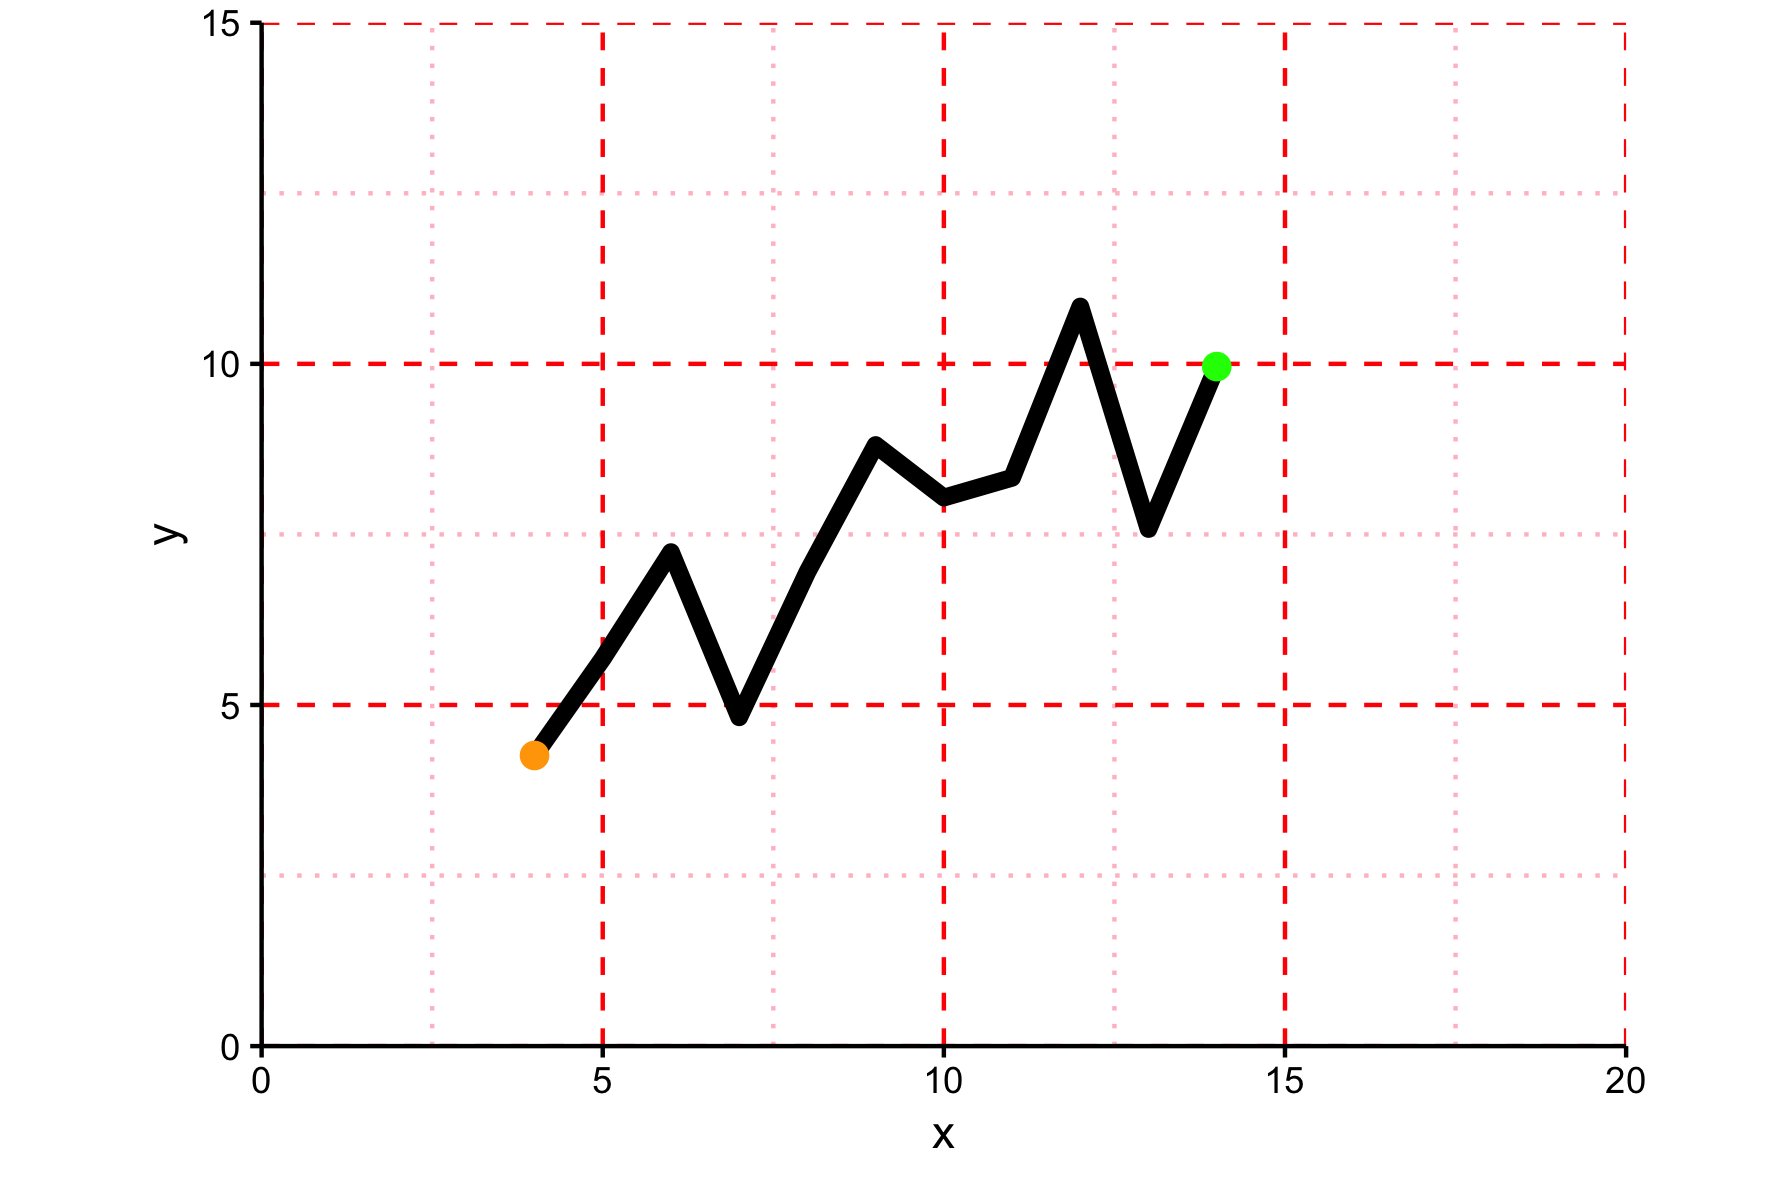
p + coord_fixed()
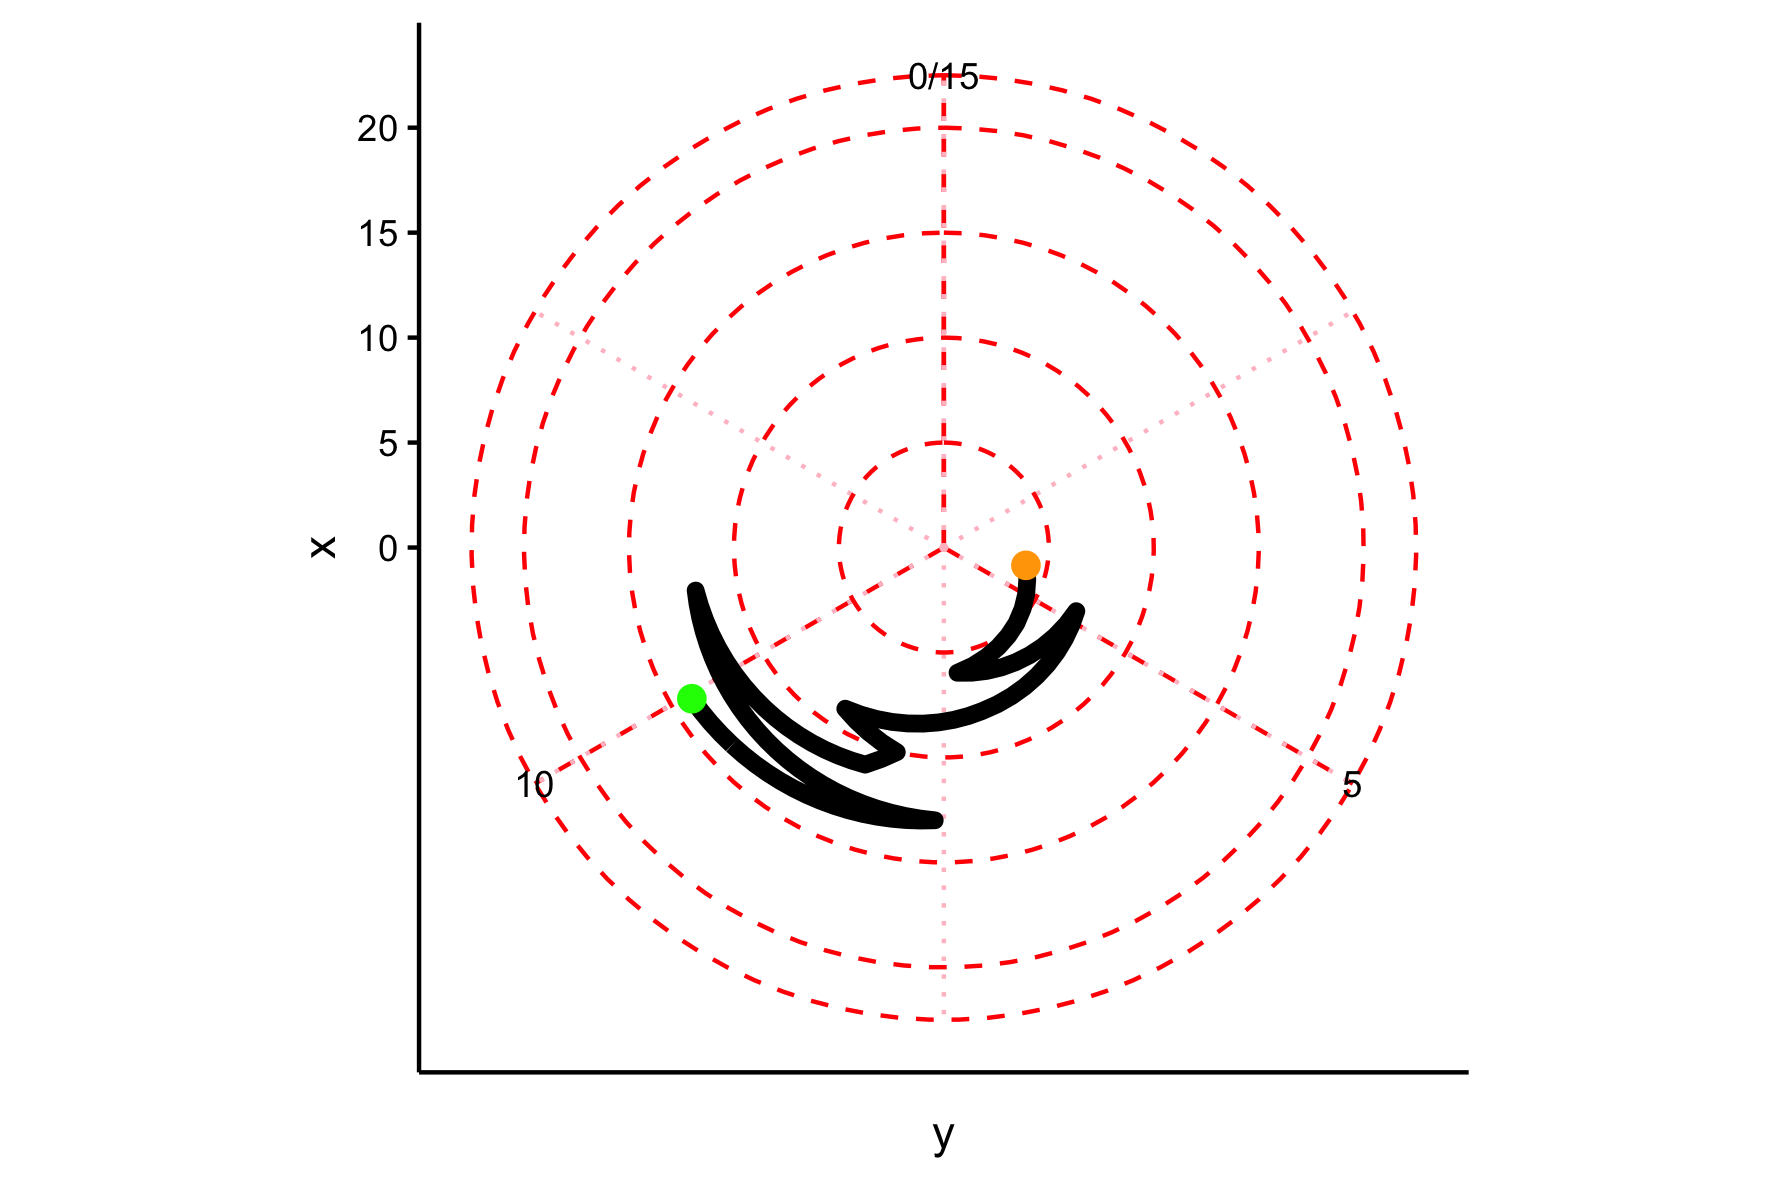
p + coord_polar()
coord_polar(theta = "y")
p + coord_fixed()
p + coord_polar(theta = "y")