Calculating p-values from t-statistics
Hypothesis Testing in R

Richie Cotton
Data Evangelist at DataCamp
t-distributions
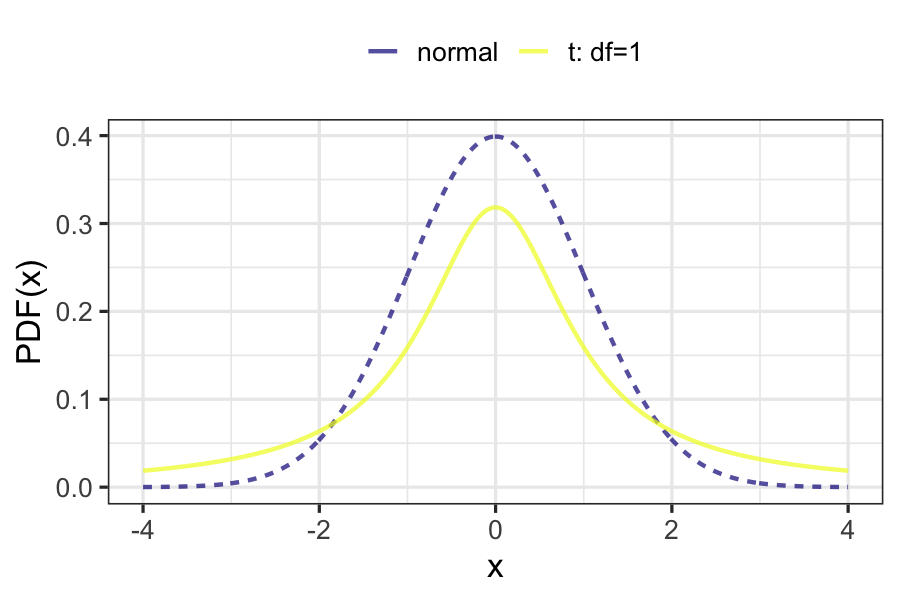
- The test statistic, t, follows a t-distribution.
- t-distributions have a parameter named degrees of freedom, or df.
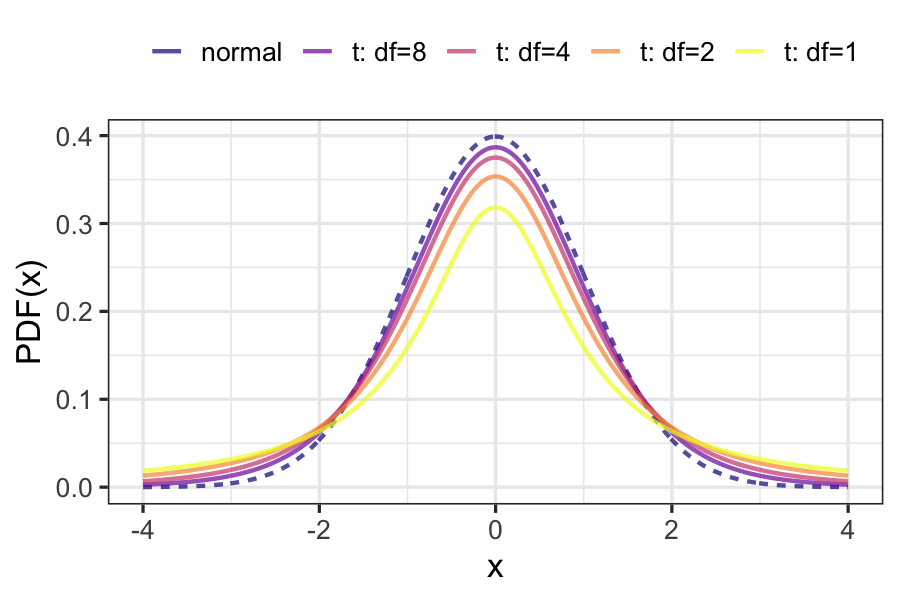
- t-distributions look like normal distributions, with fatter tails.

Degrees of freedom
- As you increase the degrees of freedom, the t-distribution gets closer to the normal distribution.
- A normal distribution is a t-distribution with infinite degrees of freedom.
- Degrees of freedom are the maximum number of logically independent values in the data sample.

Calculating degrees of freedom
- Suppose your dataset has 5 independent observations.
- Four of the values are 2, 6, 8, and 5.
- You also know the sample mean is 5.
- The last value is no longer independent; it must be 4.
- There are 4 degrees of freedom.
- $df = n_{child} + n_{adult} - 2$
Hypotheses
$H_{0}$: The mean compensation (in USD) is the same for those that coded first as a child and those that coded first as an adult.
$H_{A}$: The mean compensation (in USD) is greater for those that coded first as a child compared to those that coded first as an adult.
Use a right-tailed test.
Significance level
$\alpha = 0.1$
If $p \le \alpha$ then reject $H_{0}$.
Calculating p-values: one proportion vs. a value
p_value <- pnorm(z_score, lower.tail = FALSE)
Calculating p-values: two means from different groups
numerator <- xbar_child - xbar_adult
denominator <- sqrt(s_child ^ 2 / n_child + s_adult ^ 2 / n_adult)
t_stat <- numerator / denominator
2.4046
degrees_of_freedom <- n_child + n_adult - 2
2578
- Test statistic standard error used an approximation (not bootstrapping).
- Use t-distribution CDF not normal CDF.
p_value <- pt(t_stat, df = degrees_of_freedom, lower.tail = FALSE)
0.008130
Let's practice!
Hypothesis Testing in R

