Correlation of Two Time Series
Time Series Analysis in Python

Rob Reider
Adjunct Professor, NYU-Courant Consultant, Quantopian
Correlation of Two Time Series
- Plot of S&P500 and JPMorgan stock

Correlation of Two Time Series
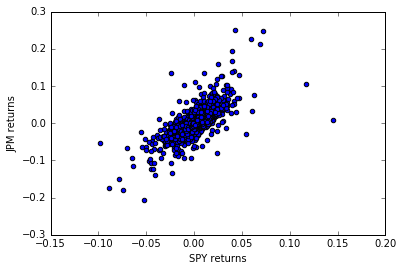
- Scatter plot of S&P500 and JP Morgan returns
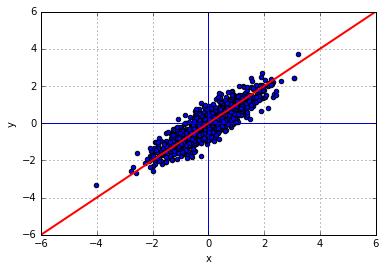
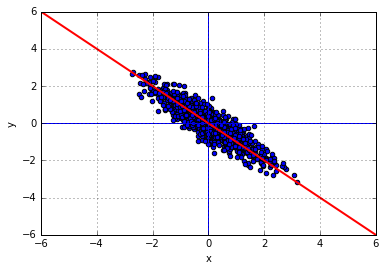
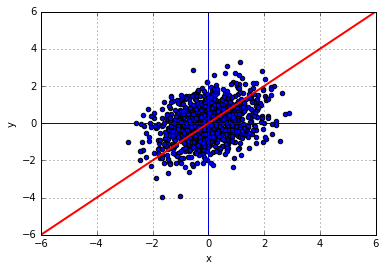
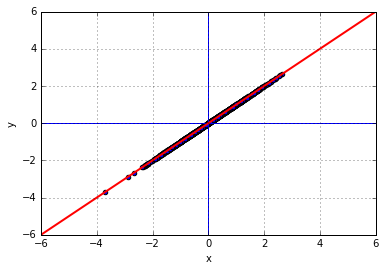
More Scatter Plots
Correlation = 0.9
Correlation = -0.9
Correlation = 0.4
Corelation = 1.0
Common Mistake: Correlation of Two Trending Series
Dow Jones Industrial Average and UFO Sightings (www.nuforc.org)
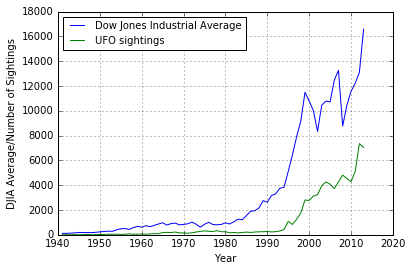
Correlation of levels: 0.94
- Correlation of percent changes: $\large \approx$ 0
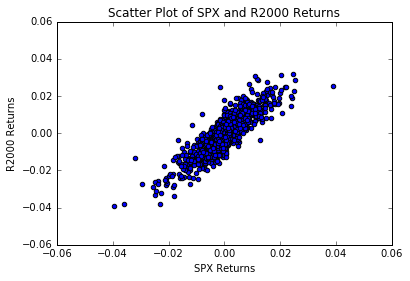
Example: Correlation of Large Cap and Small Cap Stocks
- Visualize correlation with scattter plot
  plt.scatter(df['SPX_Ret'], df['R2000_Ret'])
  plt.show()